| Param | Original file | Final file |
|---|---|---|
| Filename | modeM0/AS1P01_141T01_9000000096cztM0_level2.fits | modeM0/AS1P01_141T01_9000000096cztM0_level2_quad_clean.evt |
| Size (bytes) | 578,030,400 | 640,293,120 |
| Size | 551.3 MB | 610.6 MB |
| Events in quadrant A | 3,365,124 | 3,846,112 |
| Events in quadrant B | 3,358,036 | 3,891,999 |
| Events in quadrant C | 3,206,230 | 3,595,132 |
| Events in quadrant D | 2,803,782 | 3,288,639 |
| Mode M9 | |||
|---|---|---|---|
| Quadrant | BADHDUFLAG | Total packets | Discarded packets |
| A | 0 | 154 | 0 |
| B | 0 | 154 | 0 |
| C | 0 | 154 | 0 |
| D | 0 | 155 | 0 |
| Mode M0 | |||
|---|---|---|---|
| Quadrant | BADHDUFLAG | Total packets | Discarded packets |
| A | 0 | 310826 | 0 |
| B | 0 | 316153 | 0 |
| C | 0 | 282017 | 0 |
| D | 0 | 315263 | 0 |
| Mode SS | |||
|---|---|---|---|
| Quadrant | BADHDUFLAG | Total packets | Discarded packets |
| A | 0 | 1438 | 0 |
| B | 0 | 1438 | 0 |
| C | 0 | 1438 | 0 |
| D | 0 | 1438 | 0 |
| Quadrant | Total seconds | Saturated seconds | Saturation percentage |
|---|---|---|---|
| A | 70587 | 916 | 1.297689% |
| B | 70421 | 1030 | 1.462632% |
| C | 67219 | 1021 | 1.518916% |
| D | 69979 | 2782 | 3.975478% |
Noise dominated data is calculated using 1-second bins in cleaned event files. If a bin has >2000 counts, and if more than 50% of those come from <1% of pixels, then it is considered to be noise-dominated and hence unusable.
| Quadrant | # 1 sec bins | Bins with >0 counts | Bins with >2000 counts | High rate bins dominated by noise | Noise dominated (total time) | Noise dominated (detector-on time) | Marked lightcurve |
|---|---|---|---|---|---|---|---|
| A | 85624 | 70588 | 0 | 0 | 0.00% | 0.00% |  |
| B | 85624 | 70419 | 0 | 0 | 0.00% | 0.00% |  |
| C | 85623 | 67215 | 0 | 0 | 0.00% | 0.00% |  |
| D | 85624 | 69971 | 0 | 0 | 0.00% | 0.00% |  |
Top three noisy pixels from each quadrant. If the there are fewer than three noisy pixels in the level2.evt file, extra rows are filled as -1
| Pixel properties | Quadrant properties | ||||||
|---|---|---|---|---|---|---|---|
| Quadrant | DetID | PixID | Counts | Sigma | Mean | Median | Sigma |
| A | 7 | 110 | 3343 | 12.05 | 874 | 813 | 209.9 |
| A | 0 | 29 | 3211 | 11.42 | 874 | 813 | 209.9 |
| A | 0 | 30 | 2423 | 7.67 | 874 | 813 | 209.9 |
| B | 2 | 9 | 2755 | 11.19 | 886 | 841 | 171.1 |
| B | 2 | 18 | 2115 | 7.45 | 886 | 841 | 171.1 |
| B | 5 | 225 | 2071 | 7.19 | 886 | 841 | 171.1 |
| C | 2 | 191 | 2220 | 6.81 | 847 | 779 | 211.5 |
| C | 12 | 241 | 2203 | 6.73 | 847 | 779 | 211.5 |
| C | 1 | 81 | 2182 | 6.63 | 847 | 779 | 211.5 |
| D | 6 | 44 | 2084 | 6.86 | 800 | 733 | 196.9 |
| D | 6 | 231 | 2009 | 6.48 | 800 | 733 | 196.9 |
| D | 11 | 82 | 2008 | 6.48 | 800 | 733 | 196.9 |
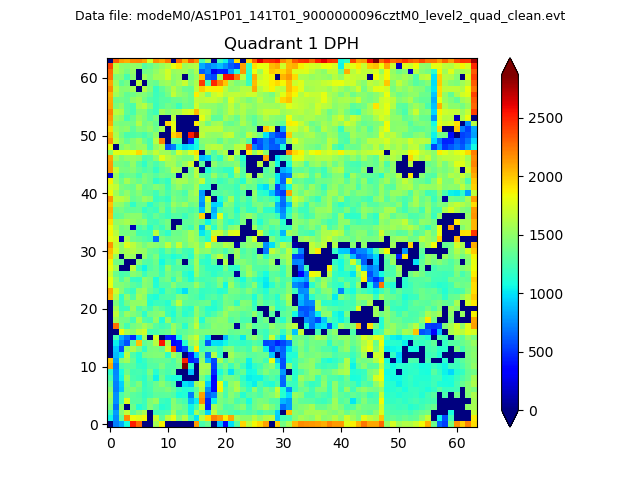
Histogram calculated using DETX and DETY for each event in the final _common_clean file
| Quadrant A |  |
 |
Quadrant B |
|---|---|---|---|
| Quadrant D | 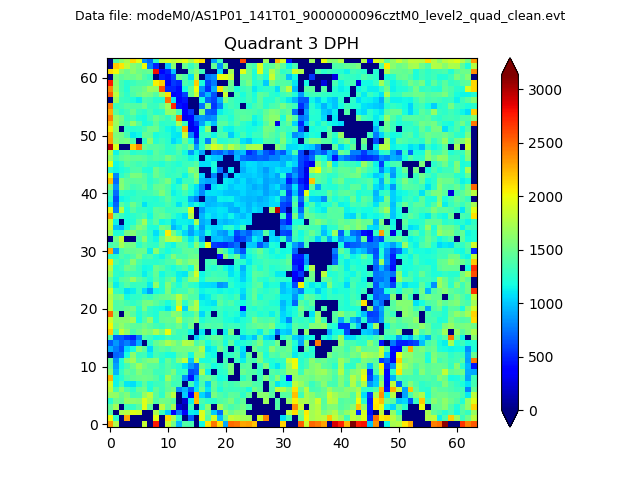 |
 |
Quadrant C |
| Plot type | Count rate plots | Images |
|---|---|---|
| Comparison with Poisson distribution Blue bars denote a histogram of data divided into 1 sec bins. Red curve is a Poisson curve with rate = median count rate of data. |
 |
 |
| Quadrant-wise count rates Data is divided into 100 sec bins |
 |
|
| Module-wise count rates for Quadrant A Data is divided into 100 sec bins |
 |
 |
| Module-wise count rates for Quadrant B Data is divided into 100 sec bins |
 |
 |
| Module-wise count rates for Quadrant C Data is divided into 100 sec bins |
 |
 |
| Module-wise count rates for Quadrant D Data is divided into 100 sec bins |
 |
 |
| Parameter | Plot |
|---|---|
| CZT HV Monitor |  |
| D_VDD |  |
| Temperature 1 |  |
| Veto HV Monitor |  |
| Veto LLD |  |
| Alpha Counter |  |
| _CPM_Rate |  |
| CZT Counter |  |
| +2.5 Volts monitor |  |
| +5 Volts monitor |  |
| _ROLL_ROT |  |
| _Roll_DEC |  |
| _Roll_RA |  |
| Veto Counter |  |