| Param | Original file | Final file |
|---|---|---|
| Filename | modeM0/AS1P01_141T01_9000000096_00668cztM0_level2.evt | modeM0/AS1P01_141T01_9000000096_00668cztM0_level2_quad_clean.evt |
| Size (bytes) | 731,171,520 | 41,909,760 |
| Size | 697.3 MB | 40.0 MB |
| Events in quadrant A | 5,492,232 | 239,798 |
| Events in quadrant B | 5,580,187 | 242,729 |
| Events in quadrant C | 4,898,660 | 241,544 |
| Events in quadrant D | 5,872,032 | 226,903 |
| Mode M9 | |||
|---|---|---|---|
| Quadrant | BADHDUFLAG | Total packets | Discarded packets |
| A | 0 | 22 | 0 |
| B | 0 | 22 | 0 |
| C | 0 | 22 | 0 |
| D | 0 | 22 | 0 |
| Mode M0 | |||
|---|---|---|---|
| Quadrant | BADHDUFLAG | Total packets | Discarded packets |
| A | 0 | 19534 | 1 |
| B | 0 | 19802 | 4 |
| C | 0 | 17774 | 1 |
| D | 0 | 20662 | 1 |
| Mode SS | |||
|---|---|---|---|
| Quadrant | BADHDUFLAG | Total packets | Discarded packets |
| A | 0 | 92 | 0 |
| B | 0 | 92 | 0 |
| C | 0 | 92 | 0 |
| D | 0 | 92 | 0 |
| Quadrant | Total seconds | Saturated seconds | Saturation percentage |
|---|---|---|---|
| A | 4518 | 3 | 0.066401% |
| B | 4517 | 33 | 0.730573% |
| C | 4517 | 2 | 0.044277% |
| D | 4517 | 75 | 1.660394% |
Noise dominated data is calculated using 1-second bins in cleaned event files. If a bin has >2000 counts, and if more than 50% of those come from <1% of pixels, then it is considered to be noise-dominated and hence unusable.
| Quadrant | # 1 sec bins | Bins with >0 counts | Bins with >2000 counts | High rate bins dominated by noise | Noise dominated (total time) | Noise dominated (detector-on time) | Marked lightcurve |
|---|---|---|---|---|---|---|---|
| A | 6674 | 4519 | 91 | 91 | 1.36% | 2.01% | 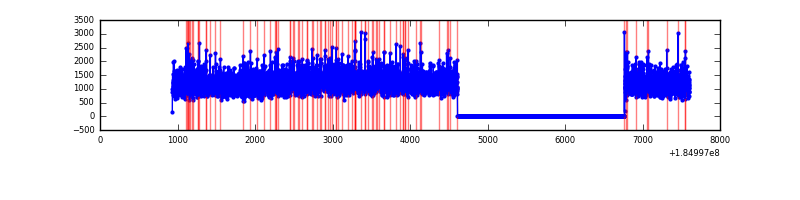 |
| B | 6673 | 4518 | 157 | 157 | 2.35% | 3.47% | 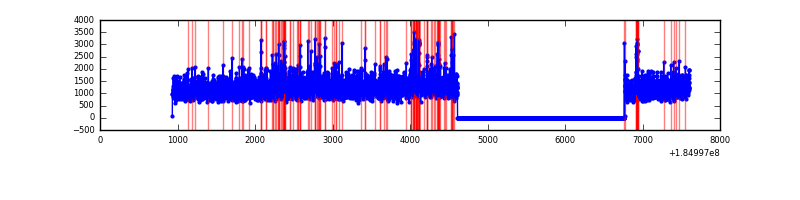 |
| C | 6673 | 4518 | 36 | 36 | 0.54% | 0.80% | 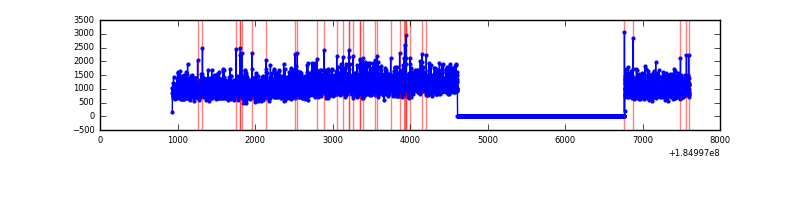 |
| D | 6673 | 4518 | 333 | 333 | 4.99% | 7.37% |  |
Top three noisy pixels from each quadrant. If the there are fewer than three noisy pixels in the level2.evt file, extra rows are filled as -1
| Pixel properties | Quadrant properties | ||||||
|---|---|---|---|---|---|---|---|
| Quadrant | DetID | PixID | Counts | Sigma | Mean | Median | Sigma |
| A | 12 | 236 | 44206 | 139.21 | 1393 | 1381 | 307.6 |
| A | 14 | 79 | 16453 | 48.99 | 1393 | 1381 | 307.6 |
| A | 15 | 171 | 15258 | 45.11 | 1393 | 1381 | 307.6 |
| B | 7 | 221 | 168077 | 519.97 | 1356 | 1369 | 320.6 |
| B | 5 | 191 | 110856 | 341.5 | 1356 | 1369 | 320.6 |
| B | 4 | 172 | 41210 | 124.27 | 1356 | 1369 | 320.6 |
| C | 15 | 241 | 10667 | 26.73 | 1244 | 1291 | 350.8 |
| C | 10 | 38 | 3918 | 7.49 | 1244 | 1291 | 350.8 |
| C | -1 | -1 | -1 | -1.0 | 1244 | 1291 | 350.8 |
| D | 12 | 237 | 637029 | 1646.0 | 1224 | 1271 | 386.2 |
| D | 13 | 221 | 191460 | 492.41 | 1224 | 1271 | 386.2 |
| D | 2 | 18 | 86080 | 219.57 | 1224 | 1271 | 386.2 |
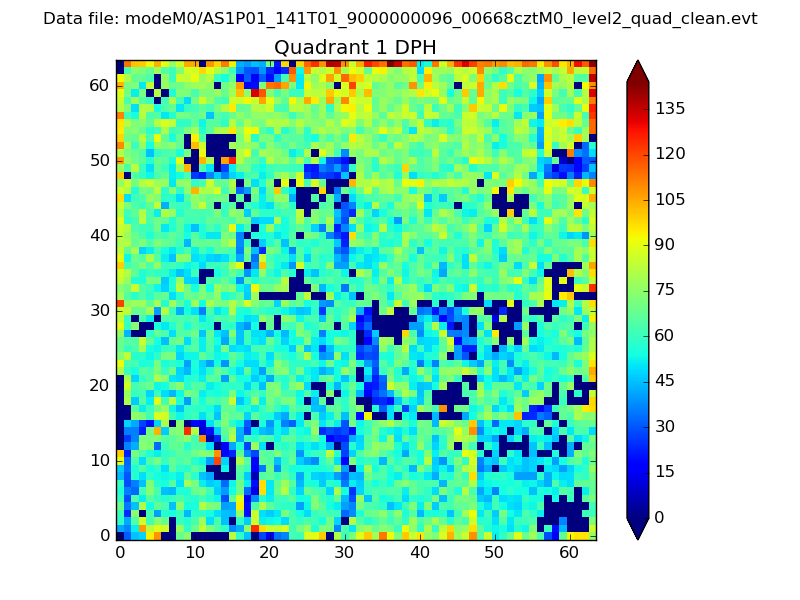
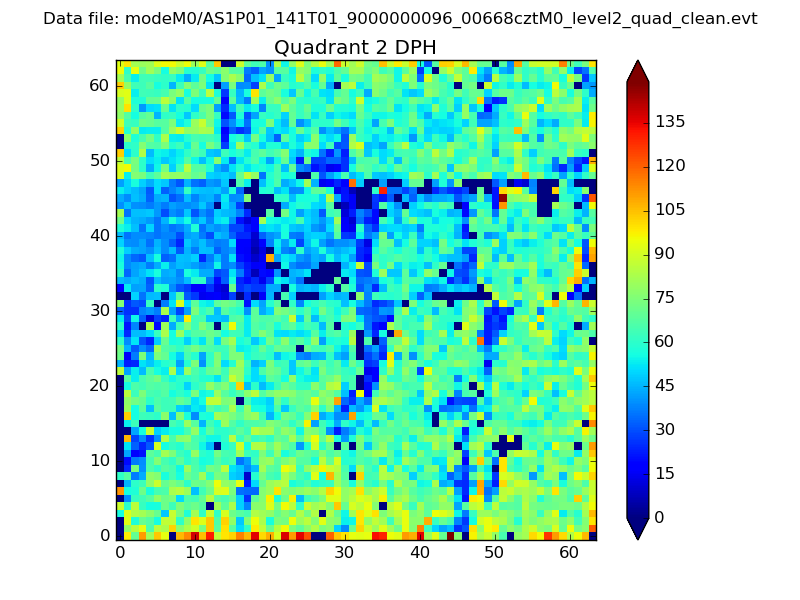
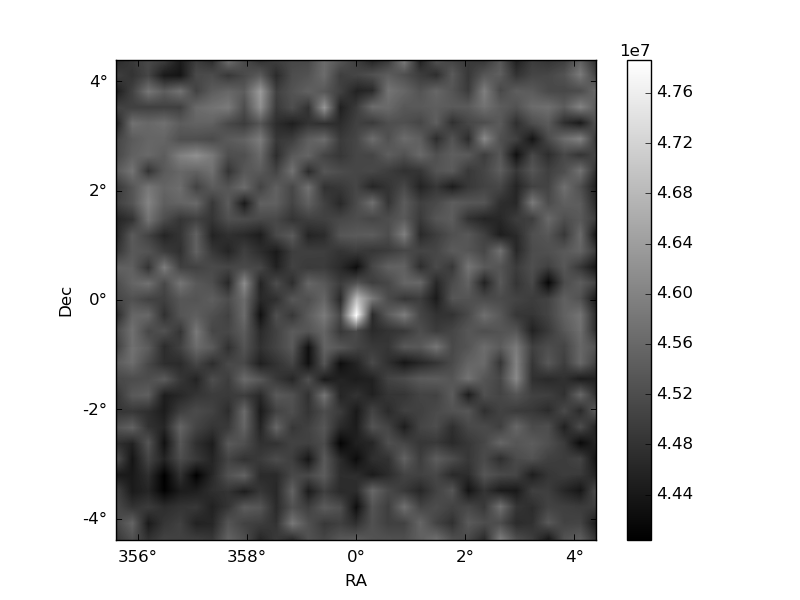
Histogram calculated using DETX and DETY for each event in the final _common_clean file
| Quadrant A | 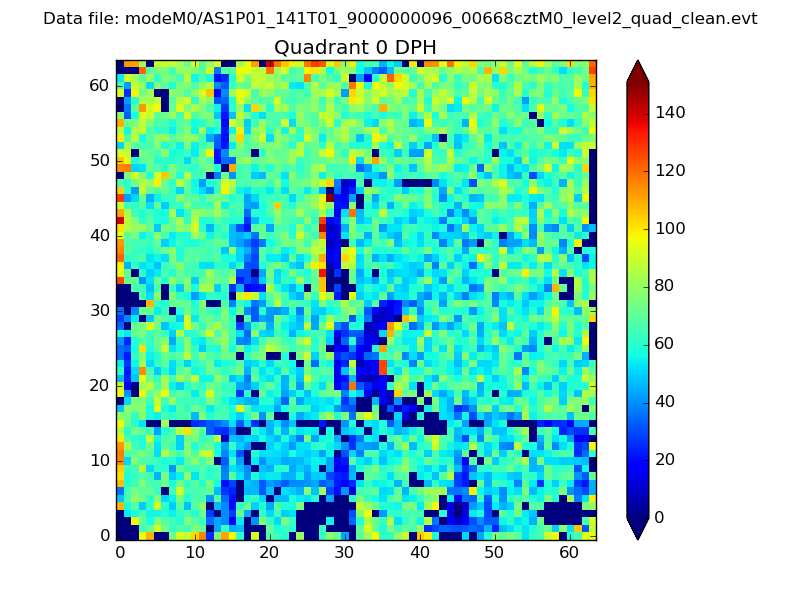 |
 |
Quadrant B |
|---|---|---|---|
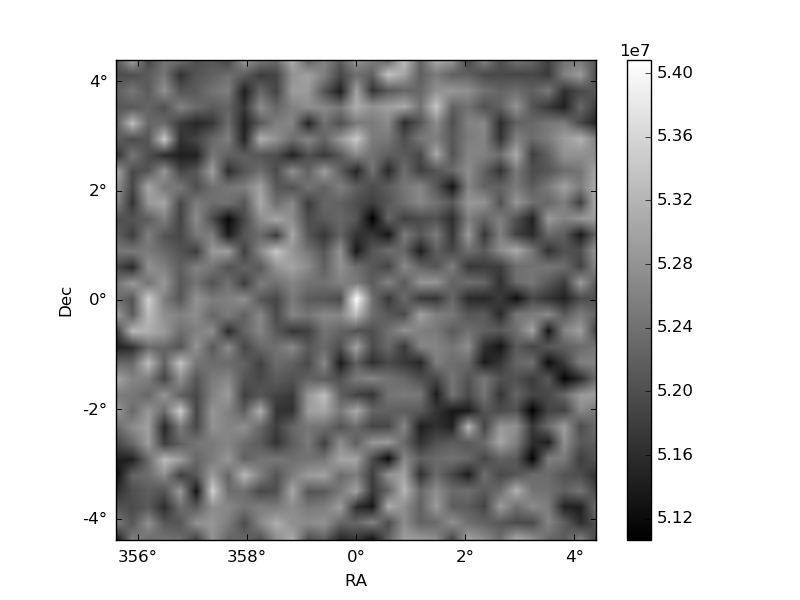
| Quadrant D | 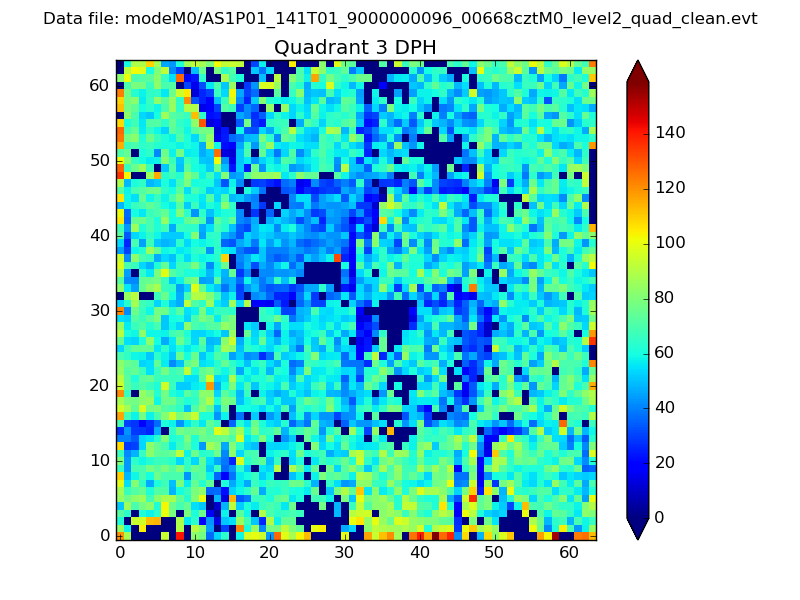 |
 |
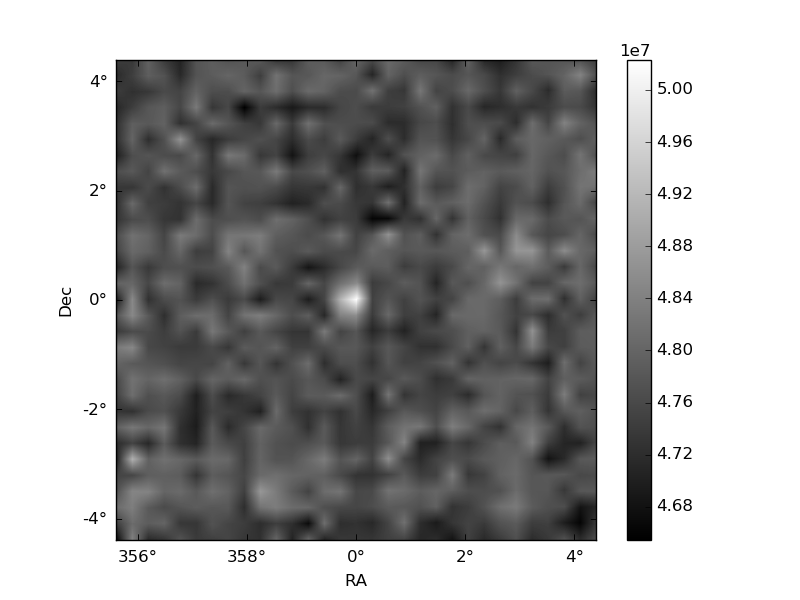
Quadrant C |
| Plot type | Count rate plots | Images |
|---|---|---|
| Comparison with Poisson distribution Blue bars denote a histogram of data divided into 1 sec bins. Red curve is a Poisson curve with rate = median count rate of data. |
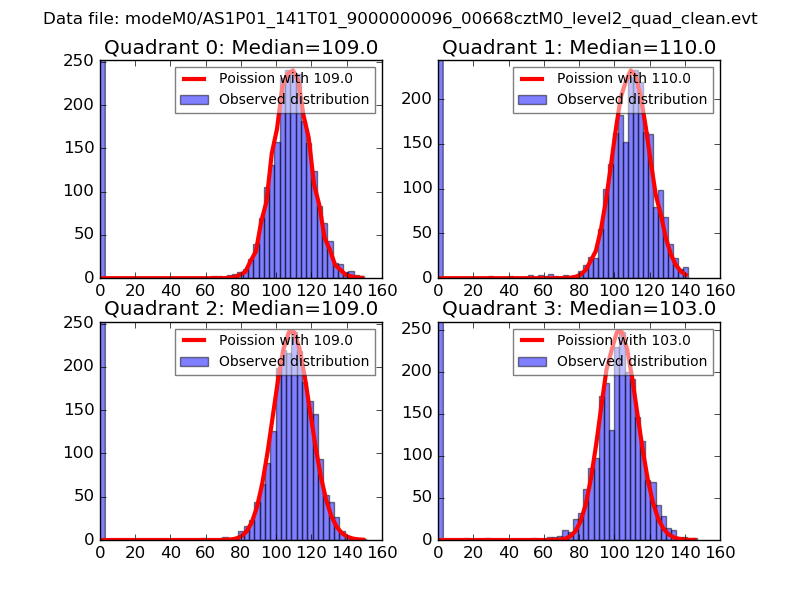 |
 |
| Quadrant-wise count rates Data is divided into 100 sec bins |
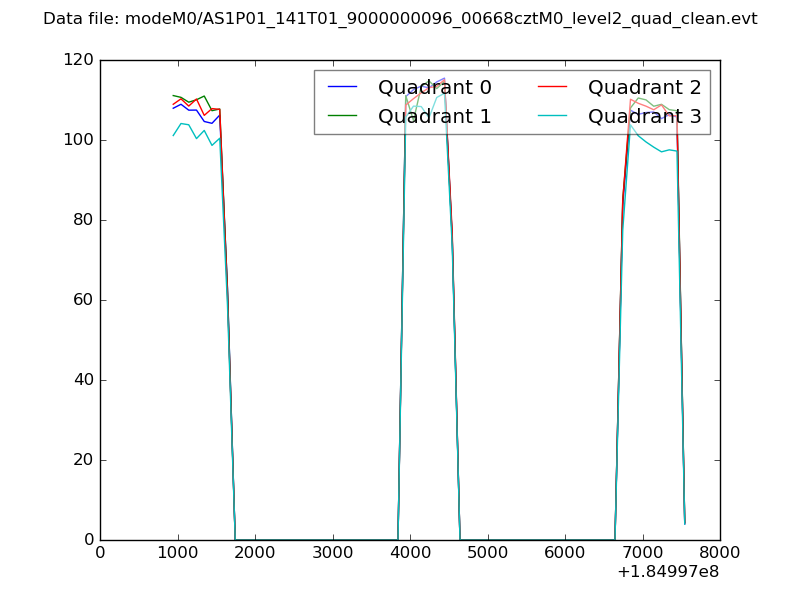 |
|
| Module-wise count rates for Quadrant A Data is divided into 100 sec bins |
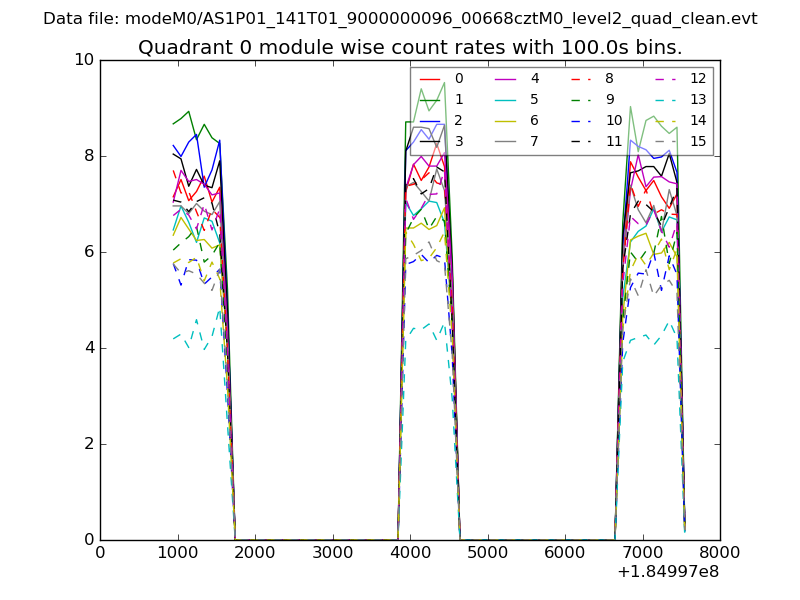 |
 |
| Module-wise count rates for Quadrant B Data is divided into 100 sec bins |
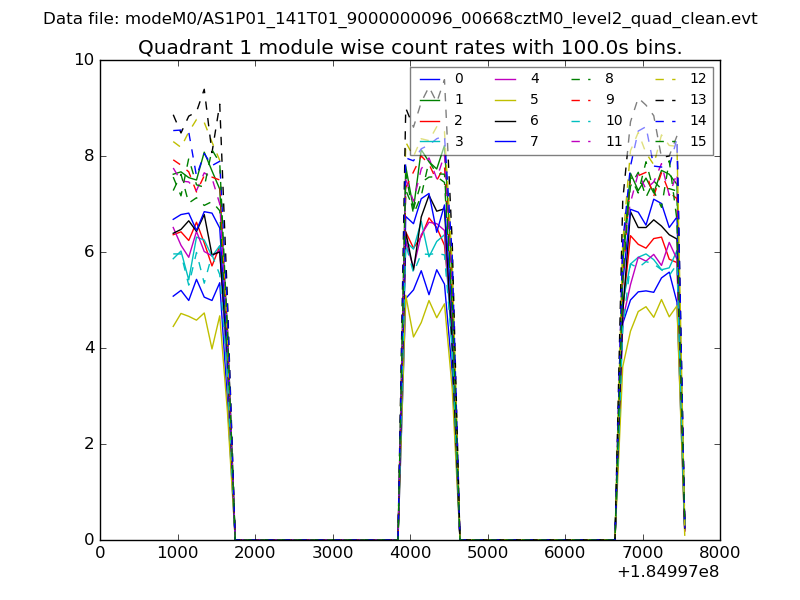 |
 |
| Module-wise count rates for Quadrant C Data is divided into 100 sec bins |
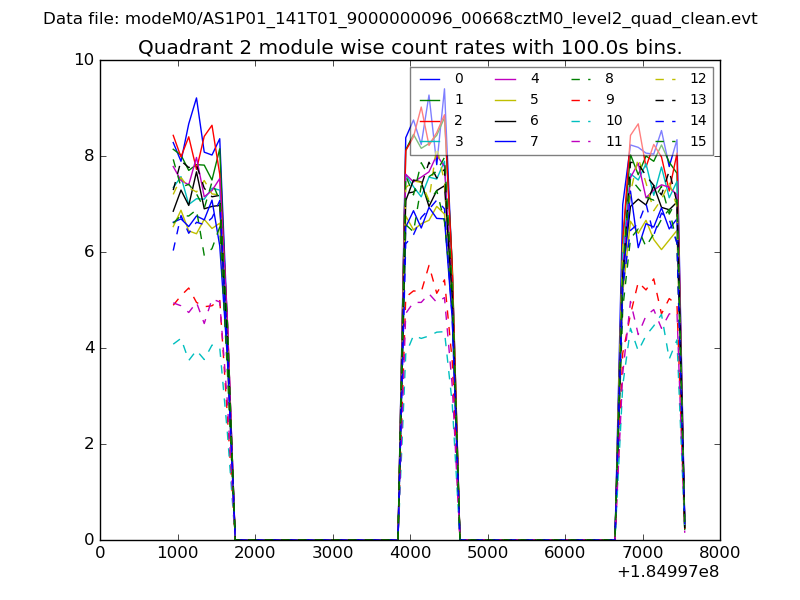 |
 |
| Module-wise count rates for Quadrant D Data is divided into 100 sec bins |
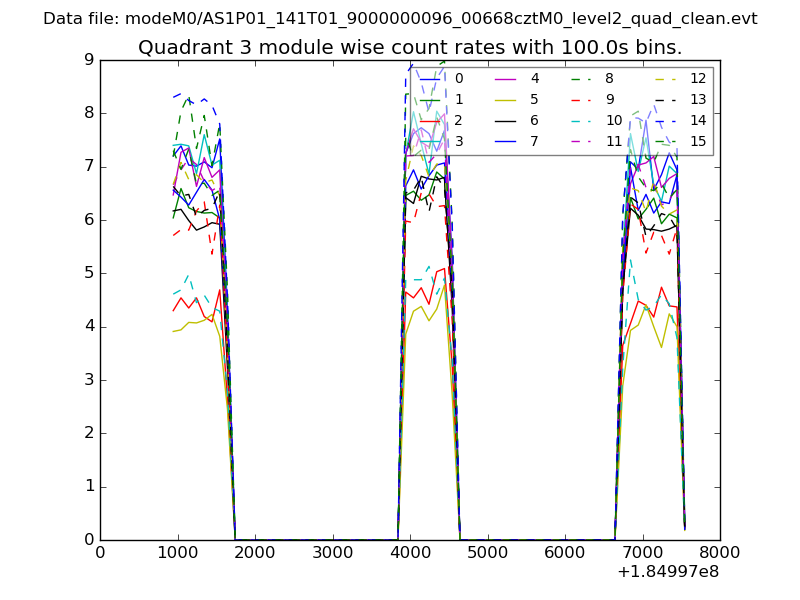 |
 |
| Parameter | Plot |
|---|---|
| CZT HV Monitor | 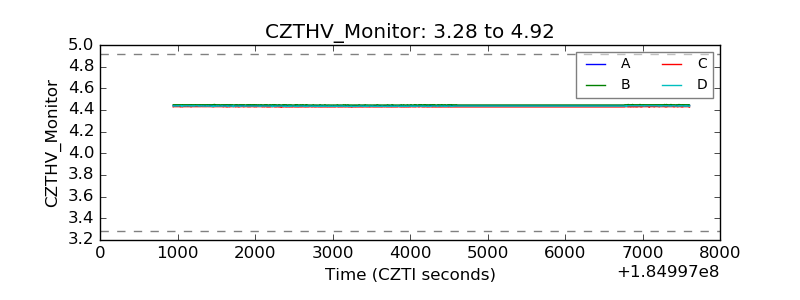 |
| D_VDD |  |
| Temperature 1 | 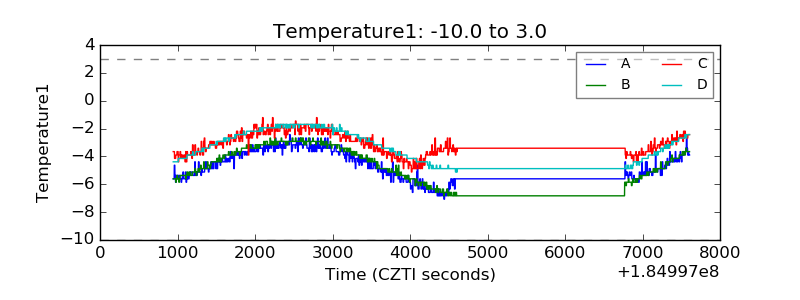 |
| Veto HV Monitor |  |
| Veto LLD | 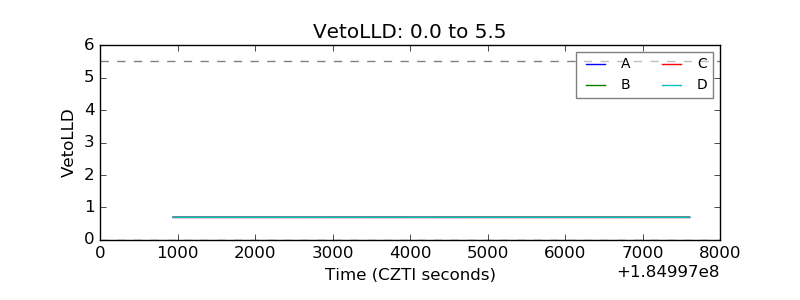 |
| Alpha Counter | 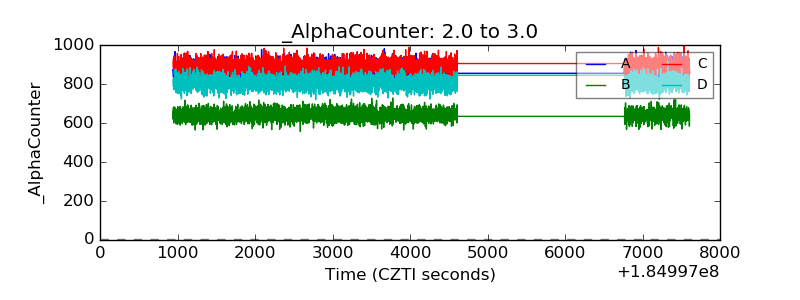 |
| _CPM_Rate | 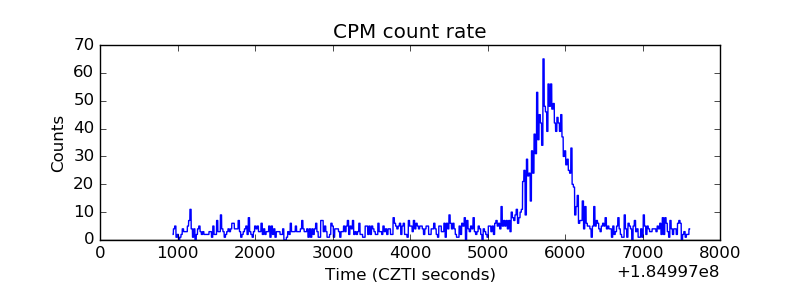 |
| CZT Counter | 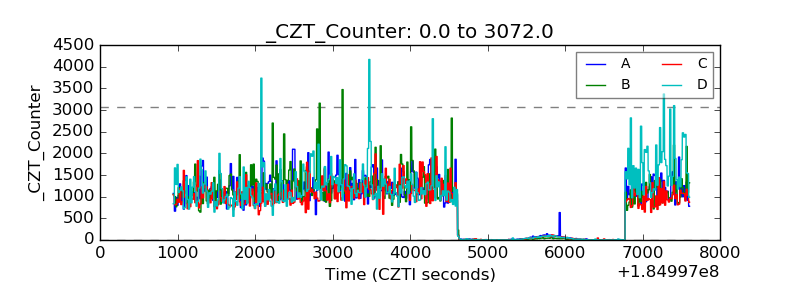 |
| +2.5 Volts monitor |  |
| +5 Volts monitor |  |
| _ROLL_ROT | 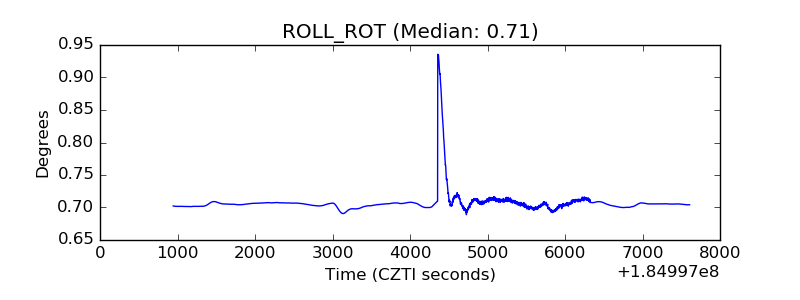 |
| _Roll_DEC | 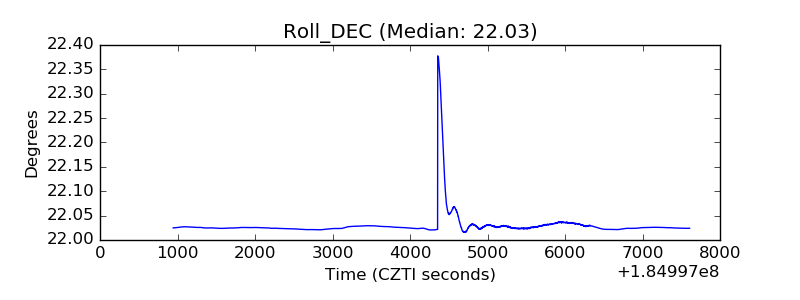 |
| _Roll_RA |  |
| Veto Counter | 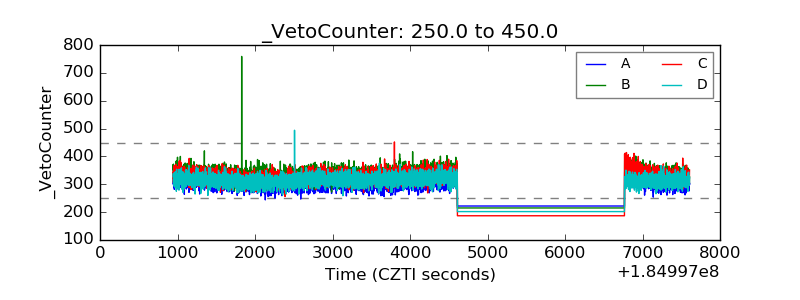 |