| Param | Original file | Final file |
|---|---|---|
| Filename | modeM0/AS1P01_141T01_9000000096_00669cztM0_level2.evt | modeM0/AS1P01_141T01_9000000096_00669cztM0_level2_quad_clean.evt |
| Size (bytes) | 820,002,240 | 38,531,520 |
| Size | 782.0 MB | 36.7 MB |
| Events in quadrant A | 5,566,055 | 212,408 |
| Events in quadrant B | 5,521,687 | 214,756 |
| Events in quadrant C | 5,214,219 | 212,866 |
| Events in quadrant D | 8,222,737 | 198,651 |
| Mode M9 | |||
|---|---|---|---|
| Quadrant | BADHDUFLAG | Total packets | Discarded packets |
| A | 0 | 21 | 0 |
| B | 0 | 21 | 0 |
| C | 0 | 21 | 0 |
| D | 0 | 21 | 0 |
| Mode M0 | |||
|---|---|---|---|
| Quadrant | BADHDUFLAG | Total packets | Discarded packets |
| A | 0 | 19940 | 1 |
| B | 0 | 19838 | 1 |
| C | 0 | 18864 | 1 |
| D | 0 | 27844 | 1 |
| Mode SS | |||
|---|---|---|---|
| Quadrant | BADHDUFLAG | Total packets | Discarded packets |
| A | 0 | 98 | 0 |
| B | 0 | 98 | 0 |
| C | 0 | 98 | 0 |
| D | 0 | 98 | 0 |
| Quadrant | Total seconds | Saturated seconds | Saturation percentage |
|---|---|---|---|
| A | 4592 | 8 | 0.174216% |
| B | 4530 | 8 | 0.176600% |
| C | 4758 | 1 | 0.021017% |
| D | 4758 | 378 | 7.944515% |
Noise dominated data is calculated using 1-second bins in cleaned event files. If a bin has >2000 counts, and if more than 50% of those come from <1% of pixels, then it is considered to be noise-dominated and hence unusable.
| Quadrant | # 1 sec bins | Bins with >0 counts | Bins with >2000 counts | High rate bins dominated by noise | Noise dominated (total time) | Noise dominated (detector-on time) | Marked lightcurve |
|---|---|---|---|---|---|---|---|
| A | 6912 | 4594 | 97 | 97 | 1.40% | 2.11% | 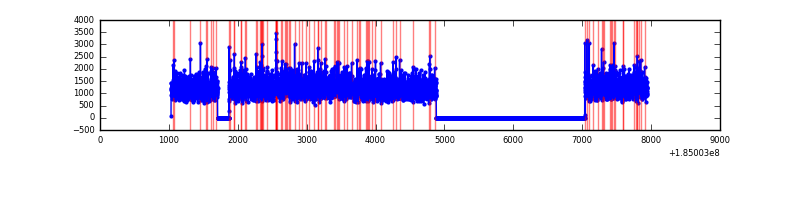 |
| B | 6910 | 4532 | 82 | 82 | 1.19% | 1.81% | 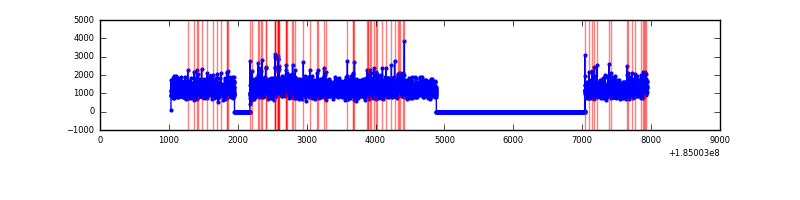 |
| C | 6913 | 4759 | 36 | 36 | 0.52% | 0.76% | 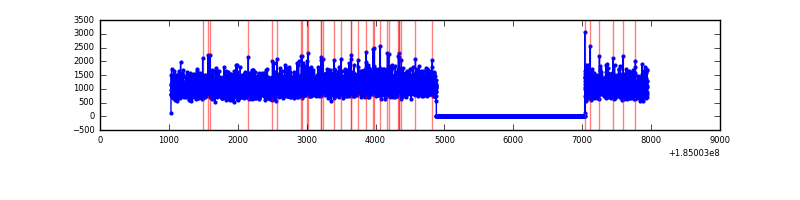 |
| D | 6913 | 4759 | 1543 | 1543 | 22.32% | 32.42% | 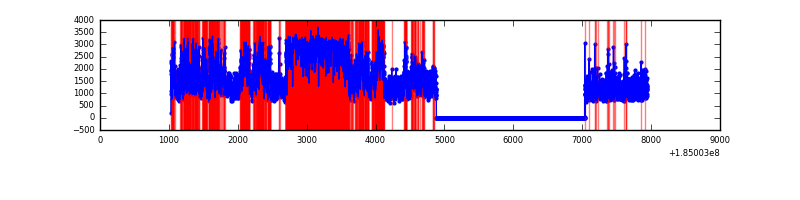 |
Top three noisy pixels from each quadrant. If the there are fewer than three noisy pixels in the level2.evt file, extra rows are filled as -1
| Pixel properties | Quadrant properties | ||||||
|---|---|---|---|---|---|---|---|
| Quadrant | DetID | PixID | Counts | Sigma | Mean | Median | Sigma |
| A | 14 | 79 | 23796 | 70.18 | 1422 | 1412 | 318.9 |
| A | 12 | 150 | 15446 | 44.0 | 1422 | 1412 | 318.9 |
| A | 0 | 238 | 9863 | 26.5 | 1422 | 1412 | 318.9 |
| B | 7 | 221 | 118633 | 354.3 | 1374 | 1387 | 330.9 |
| B | 5 | 191 | 45418 | 133.06 | 1374 | 1387 | 330.9 |
| B | 0 | 220 | 31886 | 92.16 | 1374 | 1387 | 330.9 |
| C | 15 | 241 | 11949 | 28.37 | 1323 | 1374 | 372.8 |
| C | 2 | 192 | 4744 | 9.04 | 1323 | 1374 | 372.8 |
| C | 5 | 254 | 4141 | 7.42 | 1323 | 1374 | 372.8 |
| D | 12 | 237 | 2924999 | 7192.14 | 1293 | 1348 | 406.5 |
| D | 13 | 216 | 67281 | 162.19 | 1293 | 1348 | 406.5 |
| D | 13 | 221 | 55983 | 134.4 | 1293 | 1348 | 406.5 |
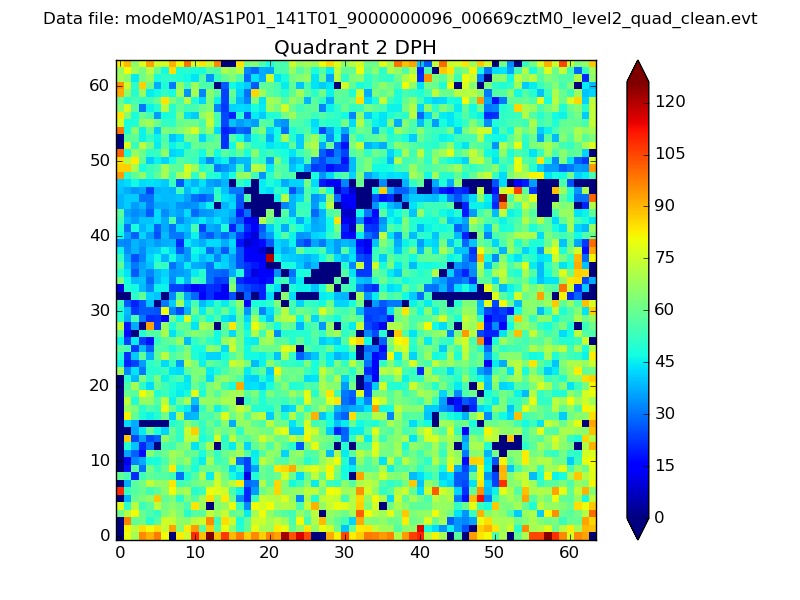
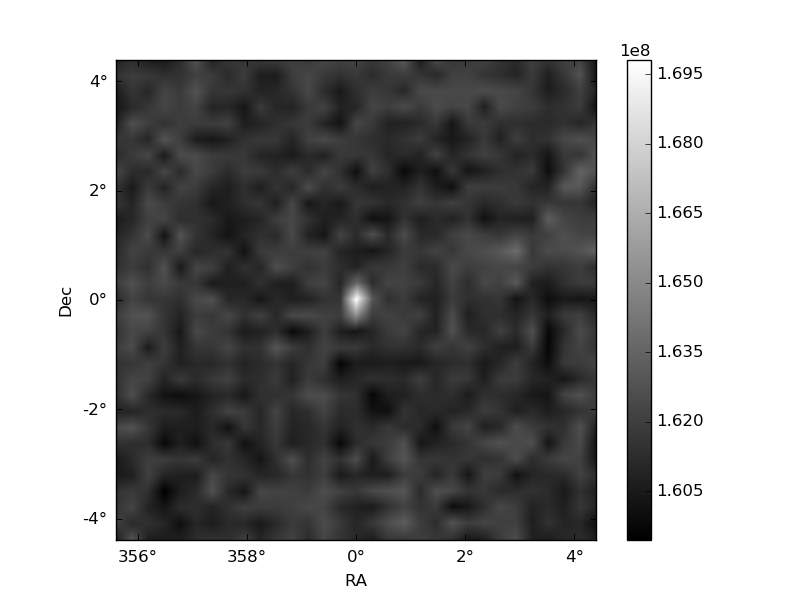
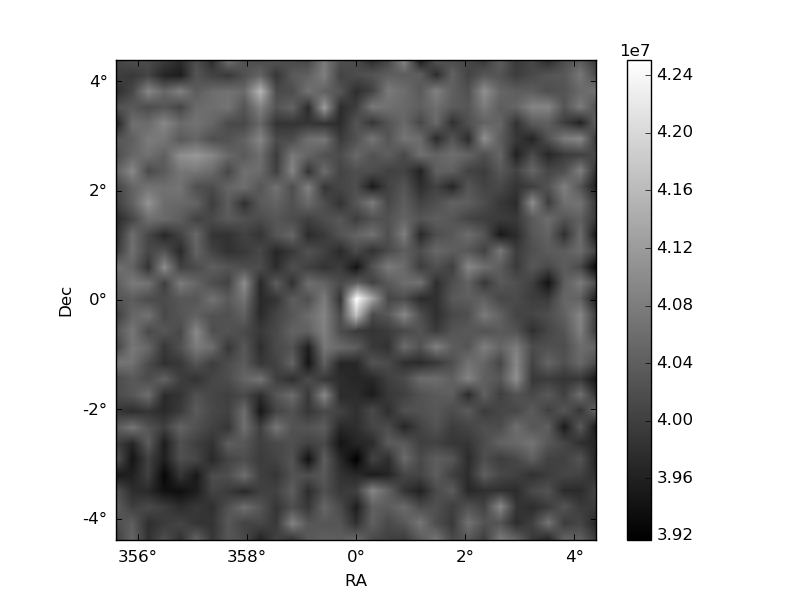
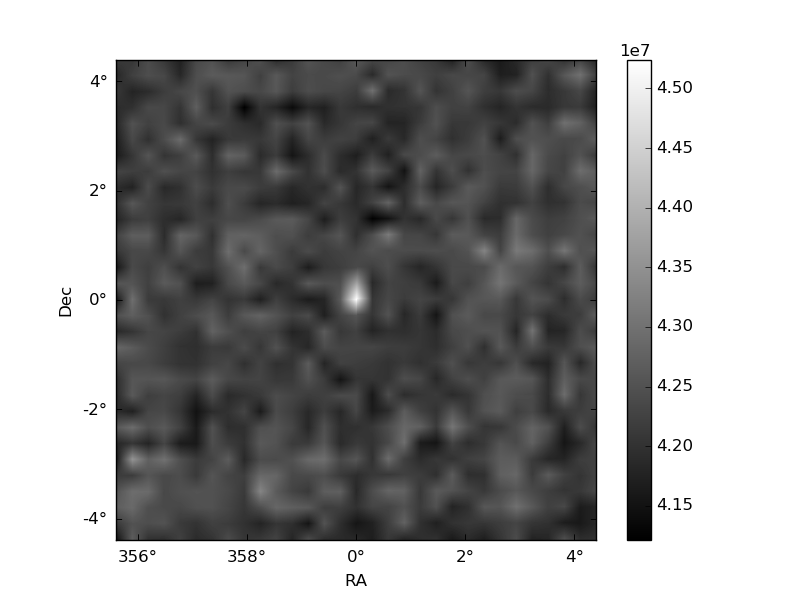
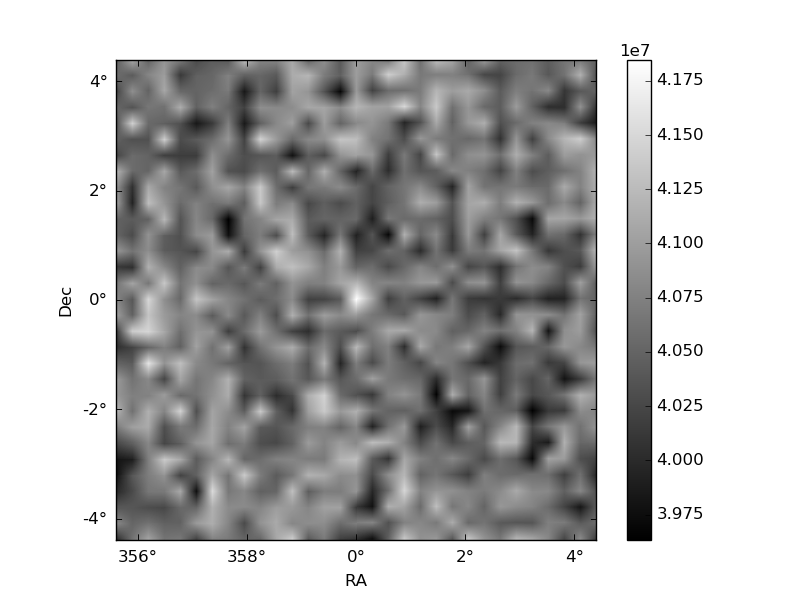
Histogram calculated using DETX and DETY for each event in the final _common_clean file
| Quadrant A | 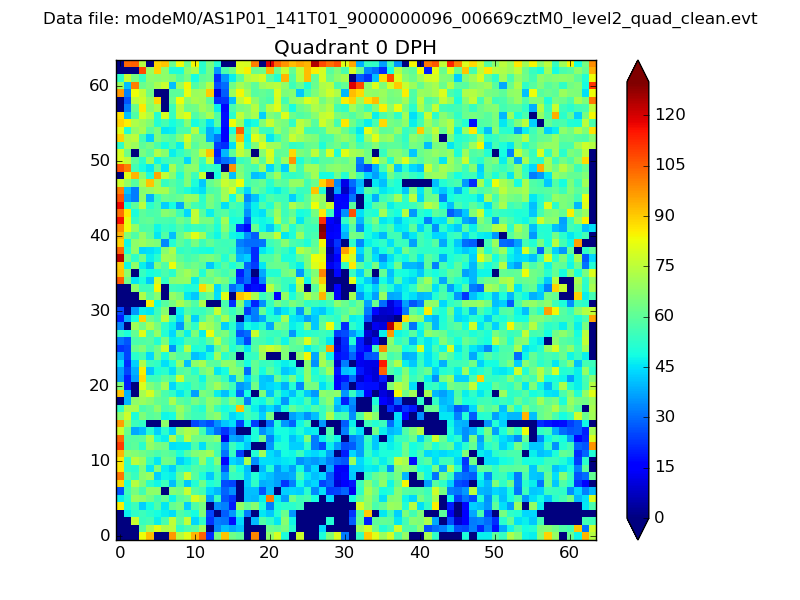 |
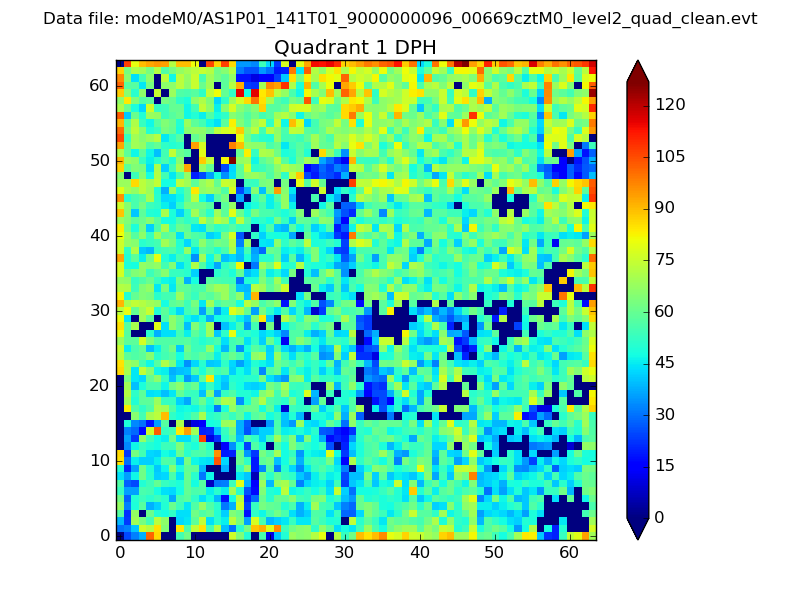 |
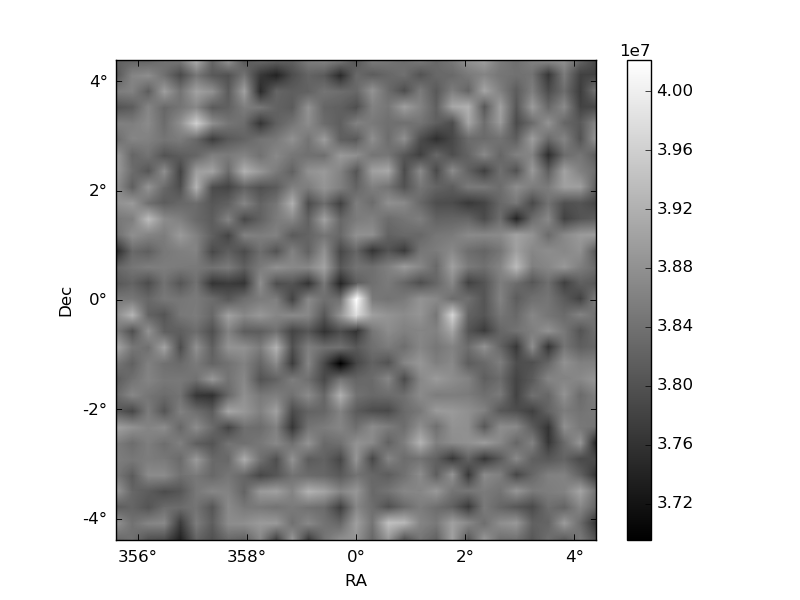
Quadrant B |
|---|---|---|---|
| Quadrant D | 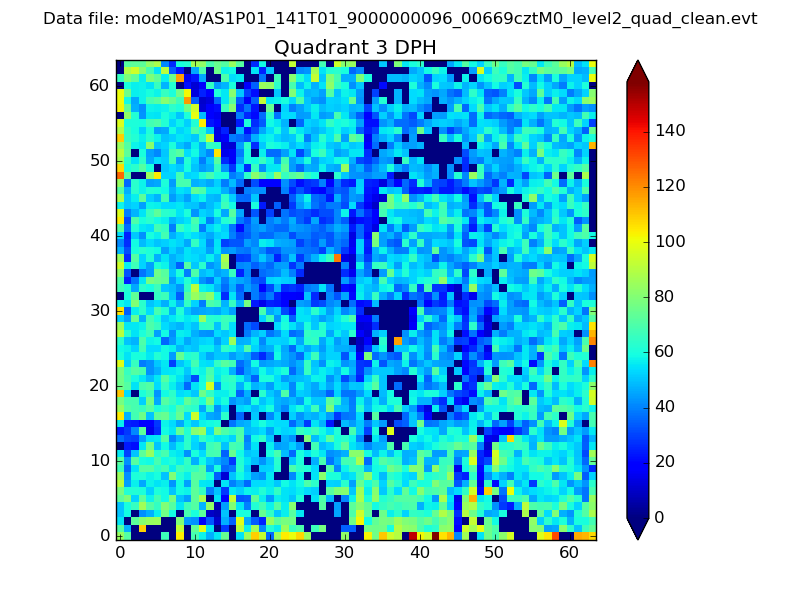 |
 |
Quadrant C |
| Plot type | Count rate plots | Images |
|---|---|---|
| Comparison with Poisson distribution Blue bars denote a histogram of data divided into 1 sec bins. Red curve is a Poisson curve with rate = median count rate of data. |
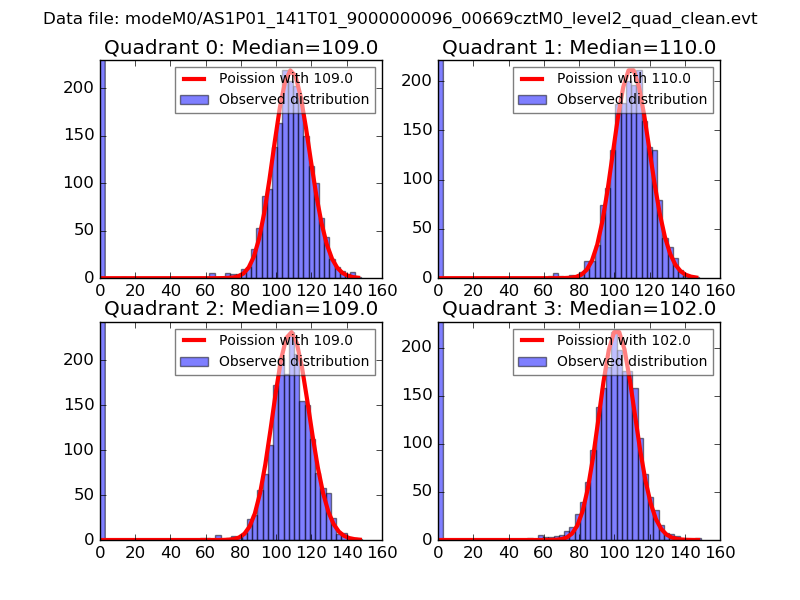 |
 |
| Quadrant-wise count rates Data is divided into 100 sec bins |
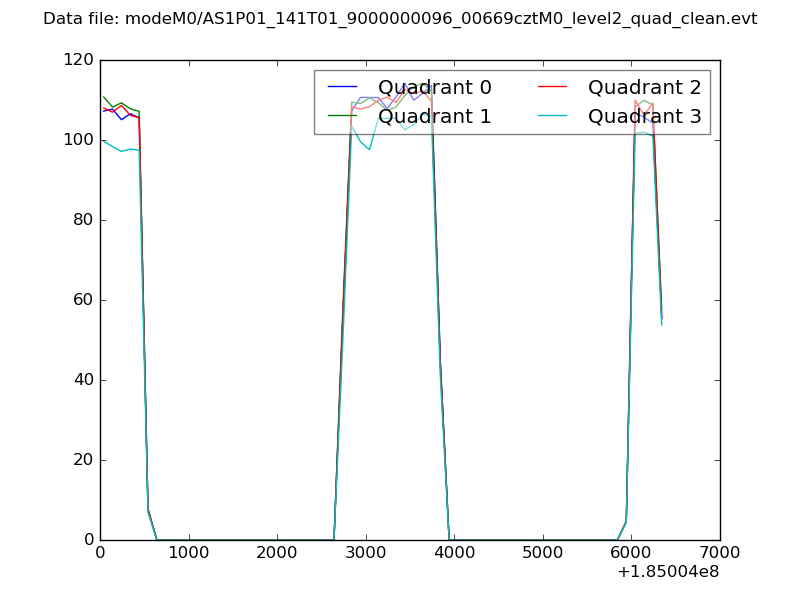 |
|
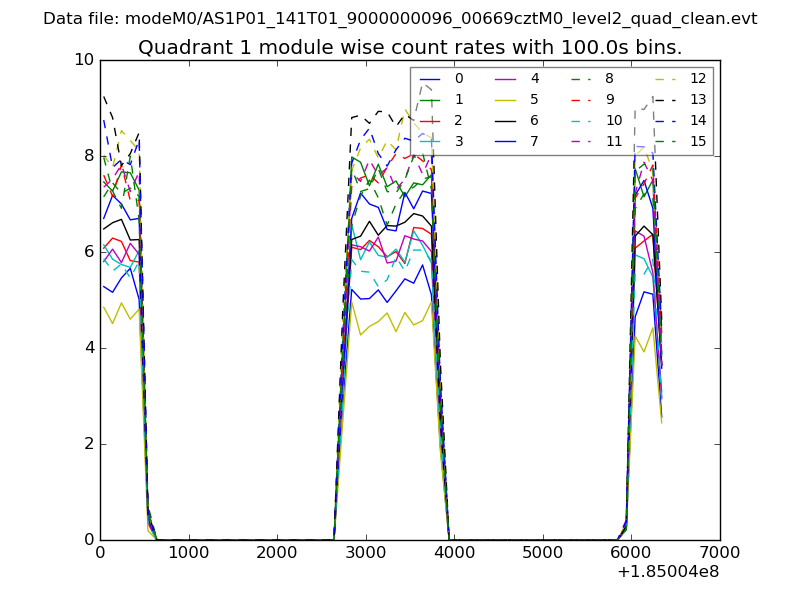
| Module-wise count rates for Quadrant A Data is divided into 100 sec bins |
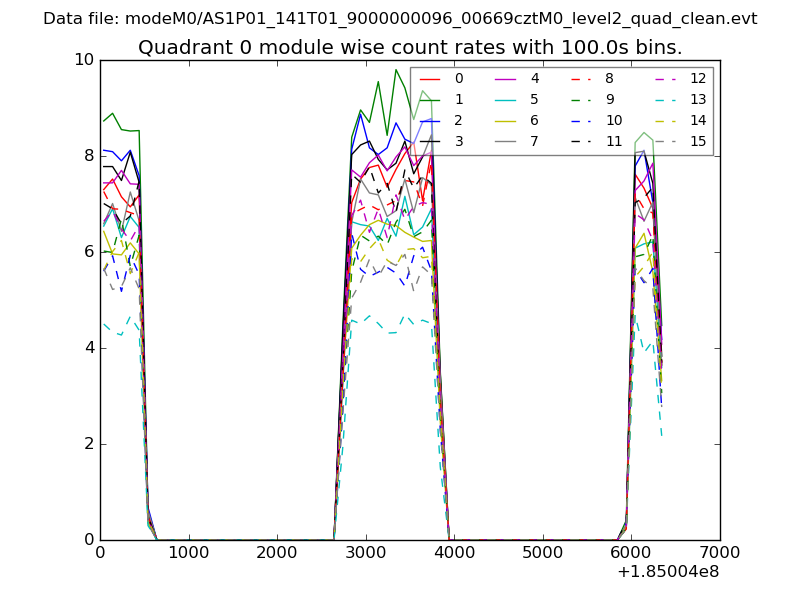 |
 |
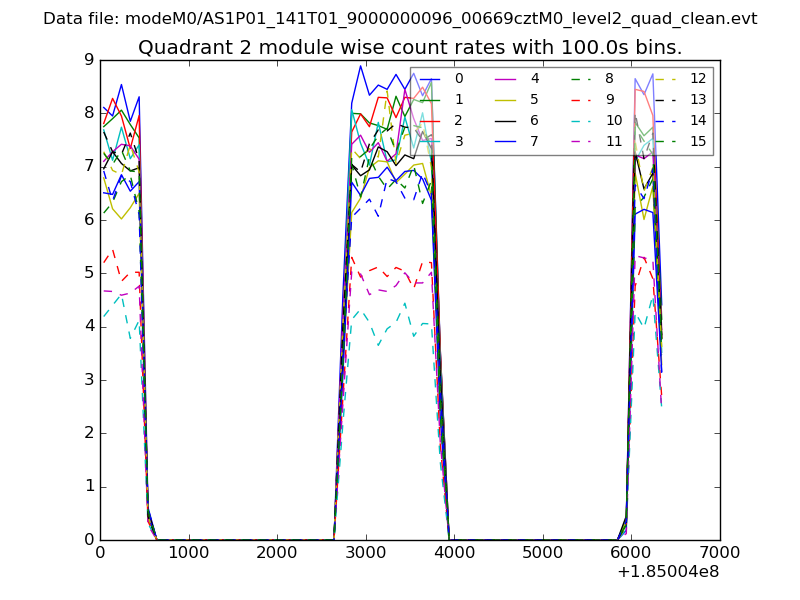
| Module-wise count rates for Quadrant B Data is divided into 100 sec bins |
 |
 |
| Module-wise count rates for Quadrant C Data is divided into 100 sec bins |
 |
 |
| Module-wise count rates for Quadrant D Data is divided into 100 sec bins |
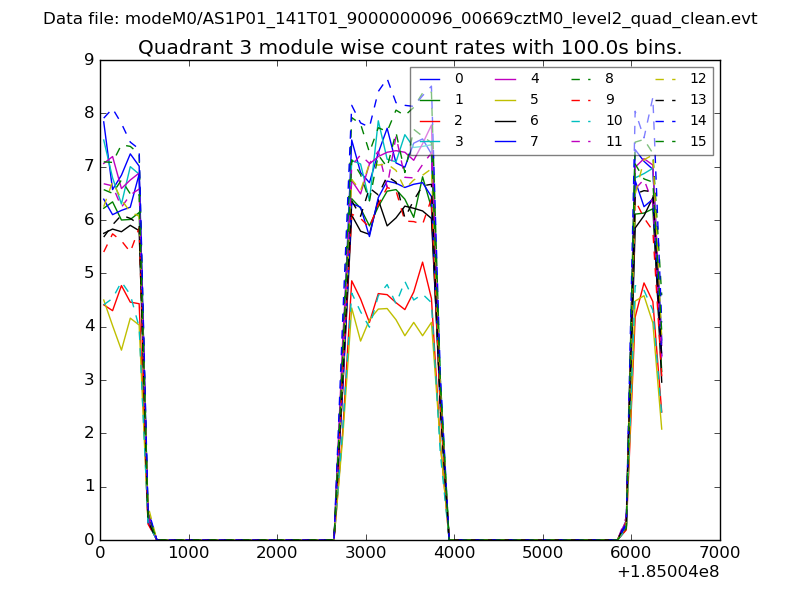 |
 |
| Parameter | Plot |
|---|---|
| CZT HV Monitor | 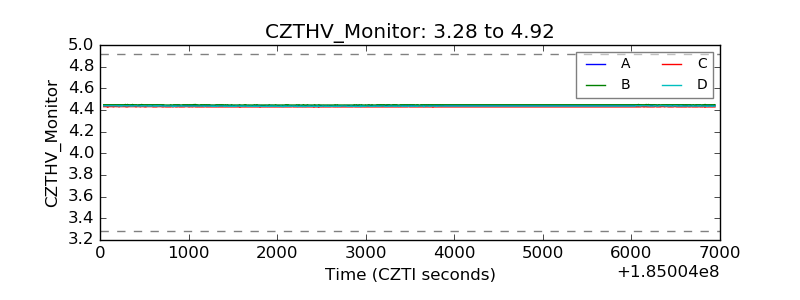 |
| D_VDD | 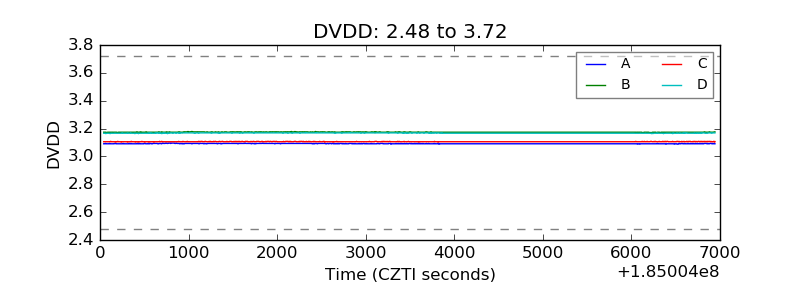 |
| Temperature 1 | 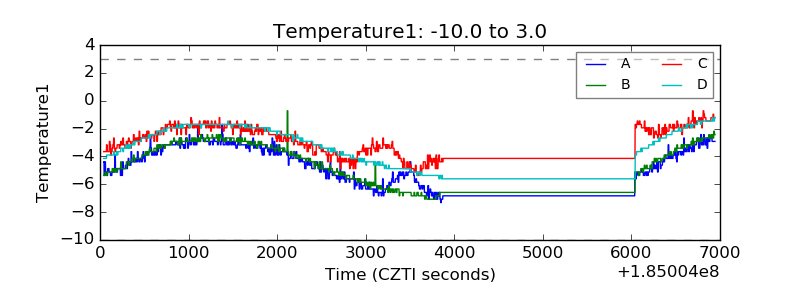 |
| Veto HV Monitor | 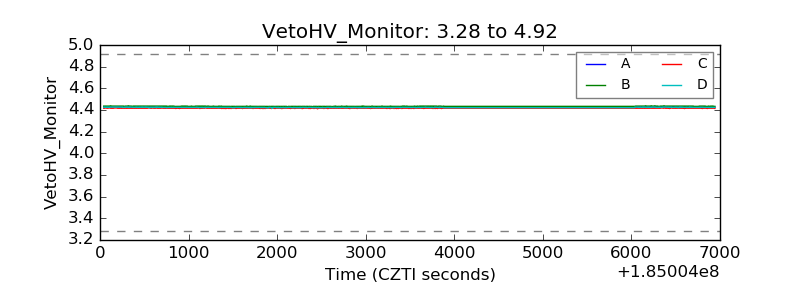 |
| Veto LLD | 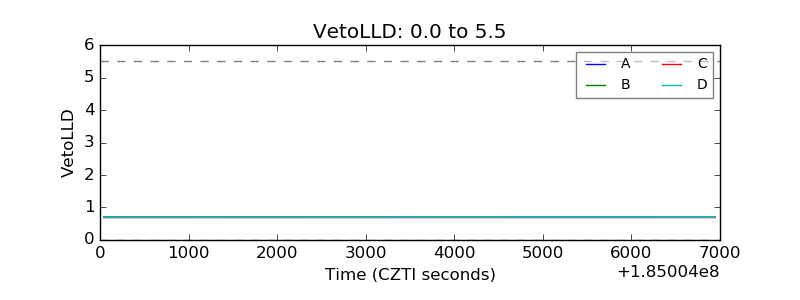 |
| Alpha Counter | 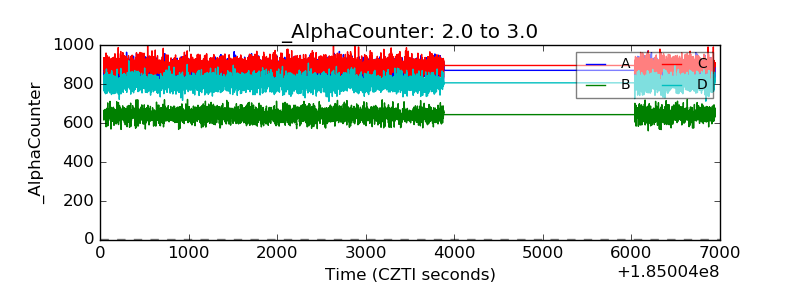 |
| _CPM_Rate | 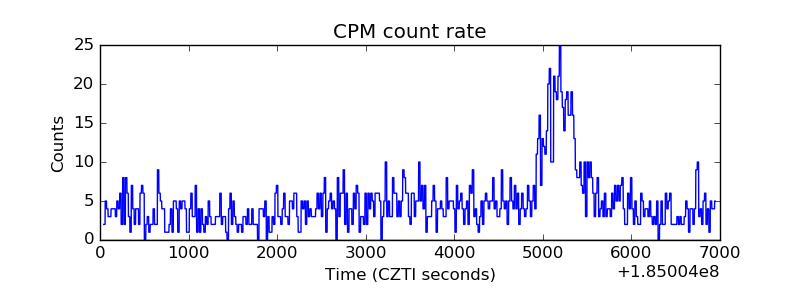 |
| CZT Counter | 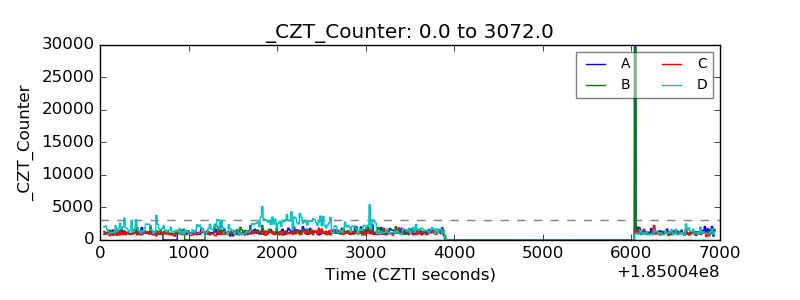 |
| +2.5 Volts monitor |  |
| +5 Volts monitor |  |
| _ROLL_ROT | 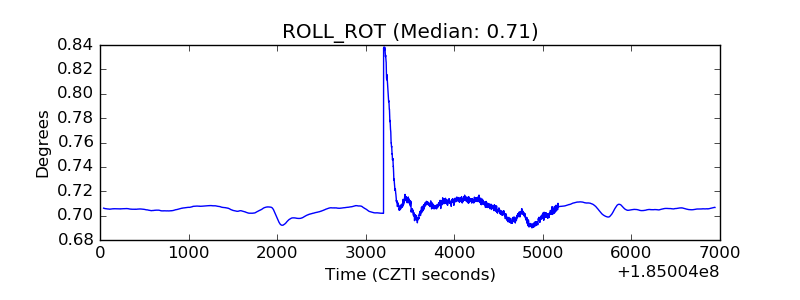 |
| _Roll_DEC | 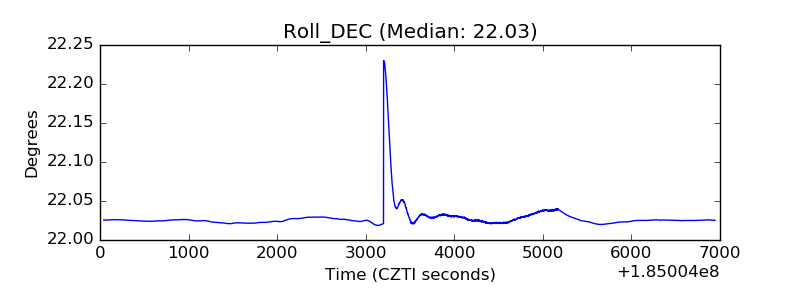 |
| _Roll_RA |  |
| Veto Counter | 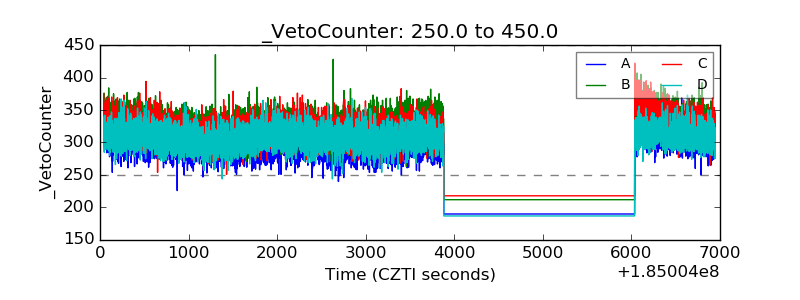 |