| Param | Original file | Final file |
|---|---|---|
| Filename | modeM0/AS1P01_141T01_9000000096_00670cztM0_level2.evt | modeM0/AS1P01_141T01_9000000096_00670cztM0_level2_quad_clean.evt |
| Size (bytes) | 653,175,360 | 30,202,560 |
| Size | 622.9 MB | 28.8 MB |
| Events in quadrant A | 6,013,551 | 201,096 |
| Events in quadrant B | 5,890,985 | 201,330 |
| Events in quadrant C | 1,532,212 | 37,433 |
| Events in quadrant D | 6,077,027 | 190,541 |
| Mode M9 | |||
|---|---|---|---|
| Quadrant | BADHDUFLAG | Total packets | Discarded packets |
| A | 0 | 22 | 0 |
| B | 0 | 22 | 0 |
| C | 0 | 22 | 0 |
| D | 0 | 22 | 0 |
| Mode M0 | |||
|---|---|---|---|
| Quadrant | BADHDUFLAG | Total packets | Discarded packets |
| A | 0 | 21394 | 2 |
| B | 0 | 21071 | 2 |
| C | 0 | 9094 | 2 |
| D | 0 | 21569 | 2 |
| Mode SS | |||
|---|---|---|---|
| Quadrant | BADHDUFLAG | Total packets | Discarded packets |
| A | 0 | 100 | 0 |
| B | 0 | 100 | 0 |
| C | 0 | 100 | 0 |
| D | 0 | 100 | 0 |
| Quadrant | Total seconds | Saturated seconds | Saturation percentage |
|---|---|---|---|
| A | 4944 | 18 | 0.364078% |
| B | 4786 | 15 | 0.313414% |
| C | 1409 | 1 | 0.070972% |
| D | 4944 | 64 | 1.294498% |
Noise dominated data is calculated using 1-second bins in cleaned event files. If a bin has >2000 counts, and if more than 50% of those come from <1% of pixels, then it is considered to be noise-dominated and hence unusable.
| Quadrant | # 1 sec bins | Bins with >0 counts | Bins with >2000 counts | High rate bins dominated by noise | Noise dominated (total time) | Noise dominated (detector-on time) | Marked lightcurve |
|---|---|---|---|---|---|---|---|
| A | 7100 | 4945 | 134 | 134 | 1.89% | 2.71% | 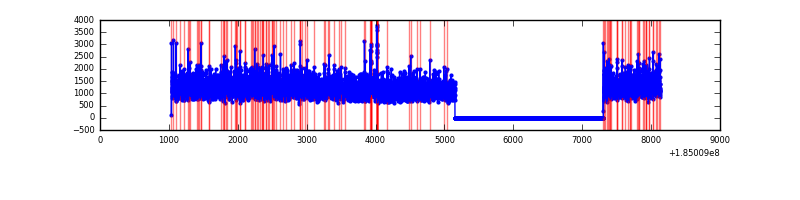 |
| B | 7100 | 4788 | 107 | 107 | 1.51% | 2.23% | 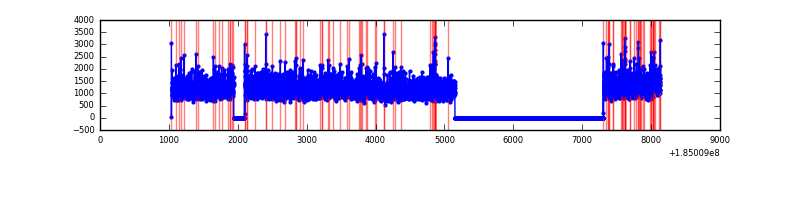 |
| C | 1409 | 1409 | 9 | 9 | 0.64% | 0.64% |  |
| D | 7100 | 4945 | 209 | 209 | 2.94% | 4.23% | 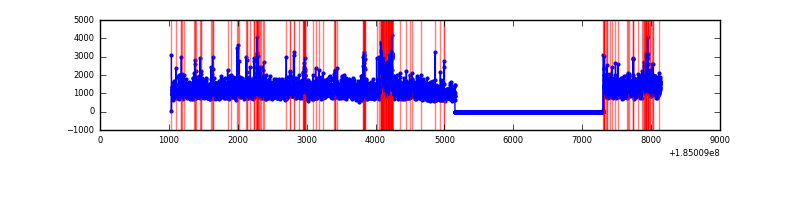 |
Top three noisy pixels from each quadrant. If the there are fewer than three noisy pixels in the level2.evt file, extra rows are filled as -1
| Pixel properties | Quadrant properties | ||||||
|---|---|---|---|---|---|---|---|
| Quadrant | DetID | PixID | Counts | Sigma | Mean | Median | Sigma |
| A | 0 | 69 | 35985 | 102.06 | 1526 | 1511 | 337.8 |
| A | 14 | 79 | 33185 | 93.77 | 1526 | 1511 | 337.8 |
| A | 0 | 238 | 15104 | 40.24 | 1526 | 1511 | 337.8 |
| B | 7 | 221 | 163412 | 457.58 | 1461 | 1471 | 353.9 |
| B | 0 | 220 | 58975 | 162.48 | 1461 | 1471 | 353.9 |
| B | 5 | 191 | 35330 | 95.67 | 1461 | 1471 | 353.9 |
| C | 9 | 52 | 5107 | 42.42 | 387 | 400 | 111.0 |
| C | 15 | 241 | 3539 | 28.29 | 387 | 400 | 111.0 |
| C | 7 | 159 | 1495 | 9.87 | 387 | 400 | 111.0 |
| D | 9 | 64 | 157556 | 365.04 | 1357 | 1408 | 427.8 |
| D | 13 | 216 | 139181 | 322.08 | 1357 | 1408 | 427.8 |
| D | 13 | 221 | 115836 | 267.51 | 1357 | 1408 | 427.8 |
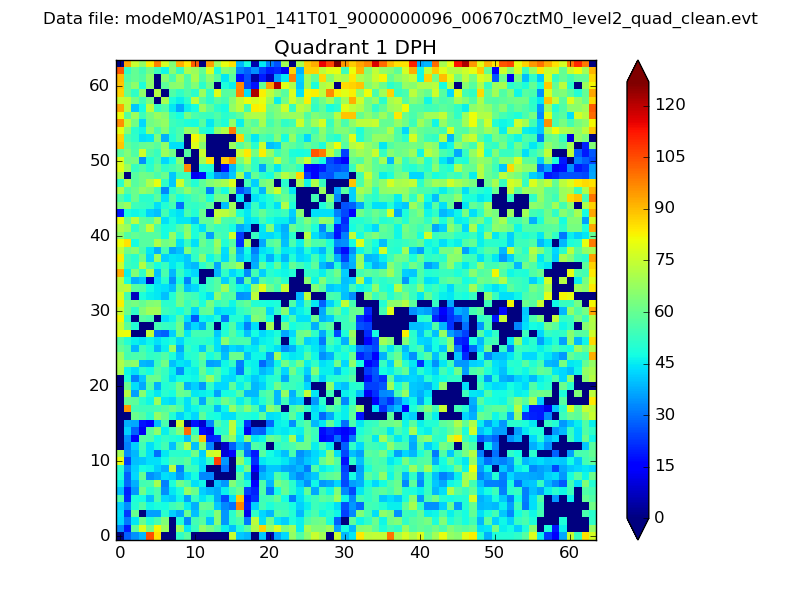
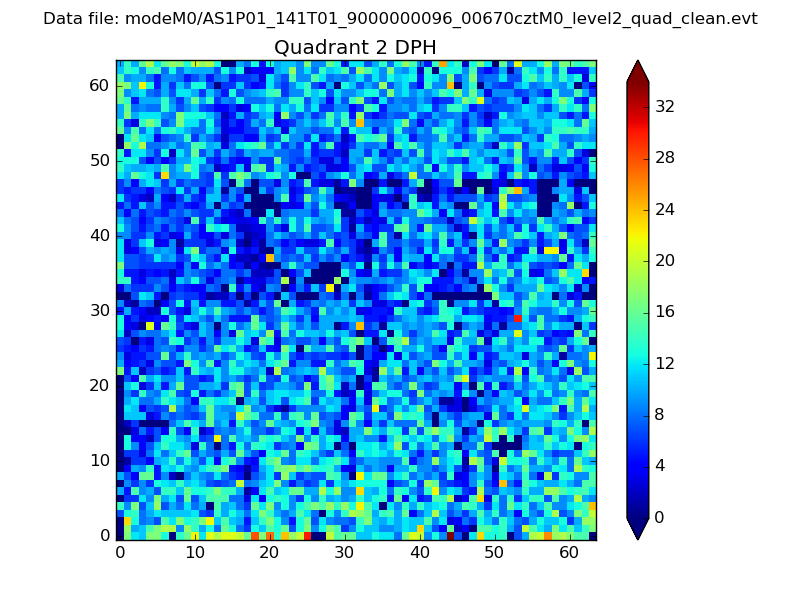
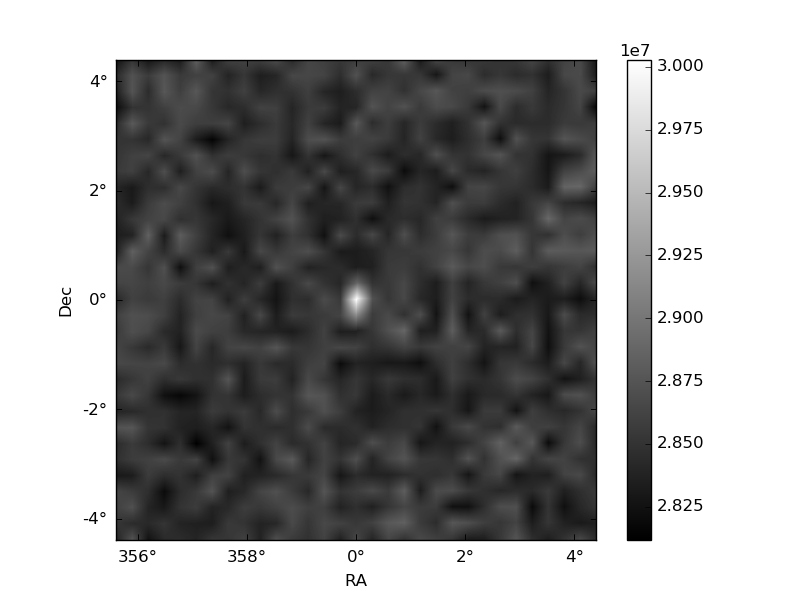
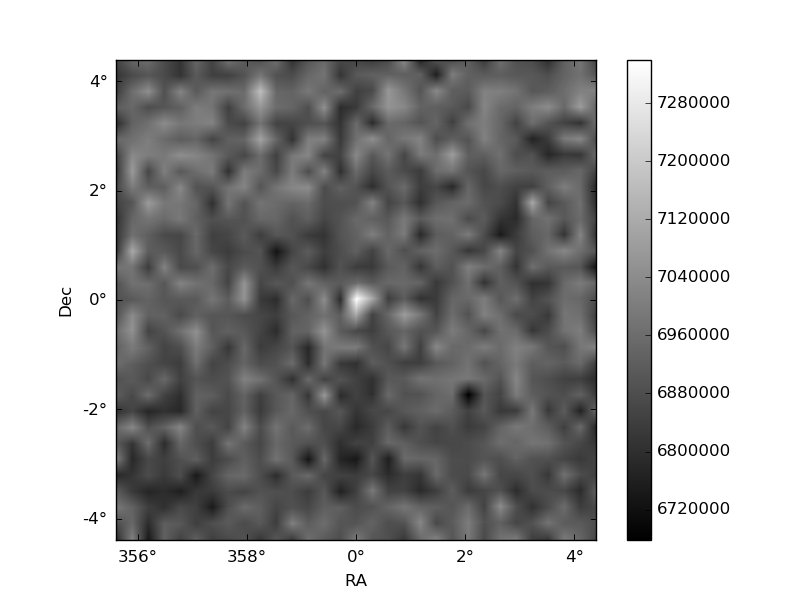
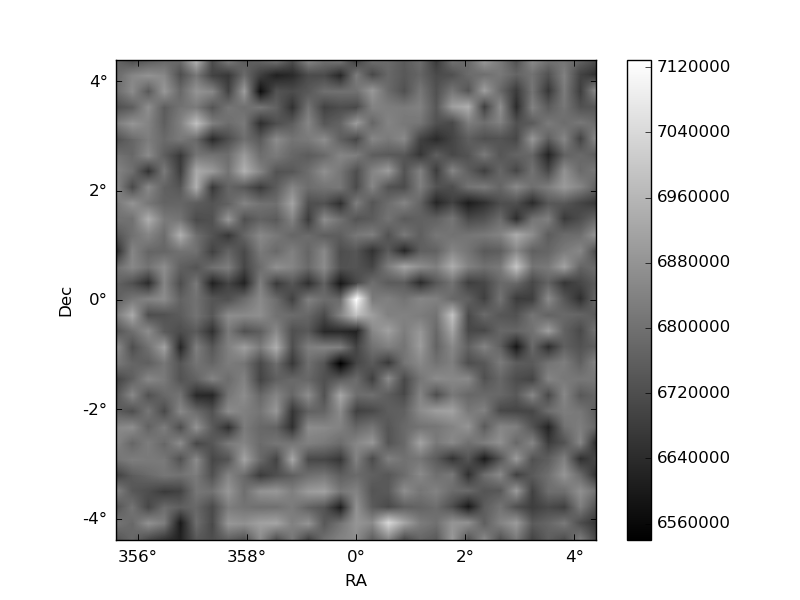
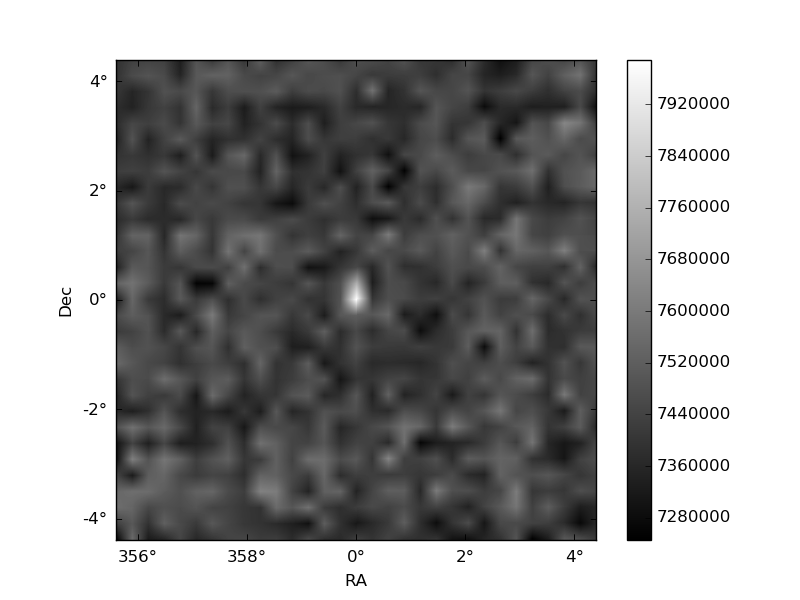
Histogram calculated using DETX and DETY for each event in the final _common_clean file
| Quadrant A | 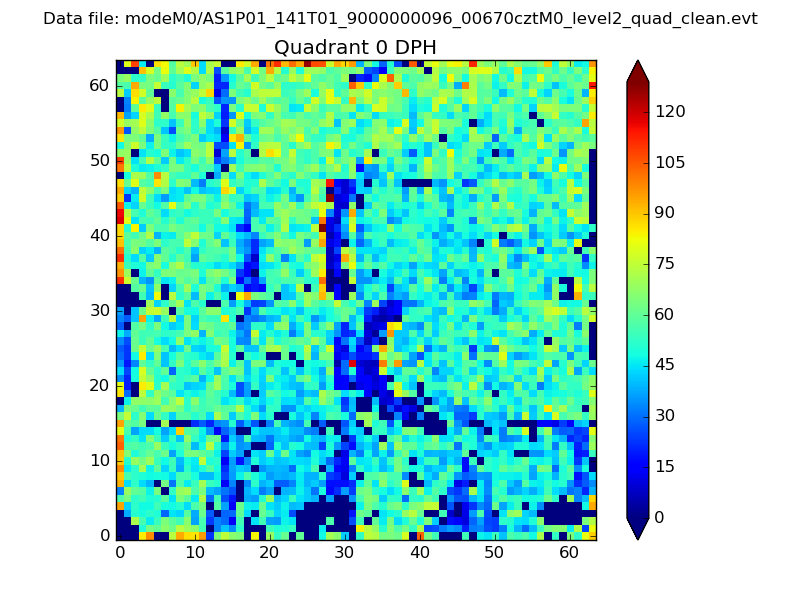 |
 |
Quadrant B |
|---|---|---|---|
| Quadrant D | 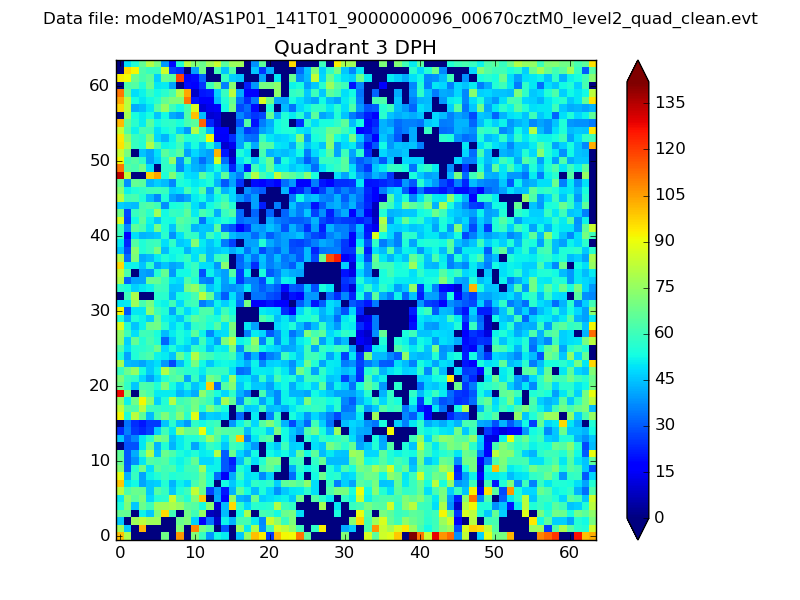 |
 |
Quadrant C |
| Plot type | Count rate plots | Images |
|---|---|---|
| Comparison with Poisson distribution Blue bars denote a histogram of data divided into 1 sec bins. Red curve is a Poisson curve with rate = median count rate of data. |
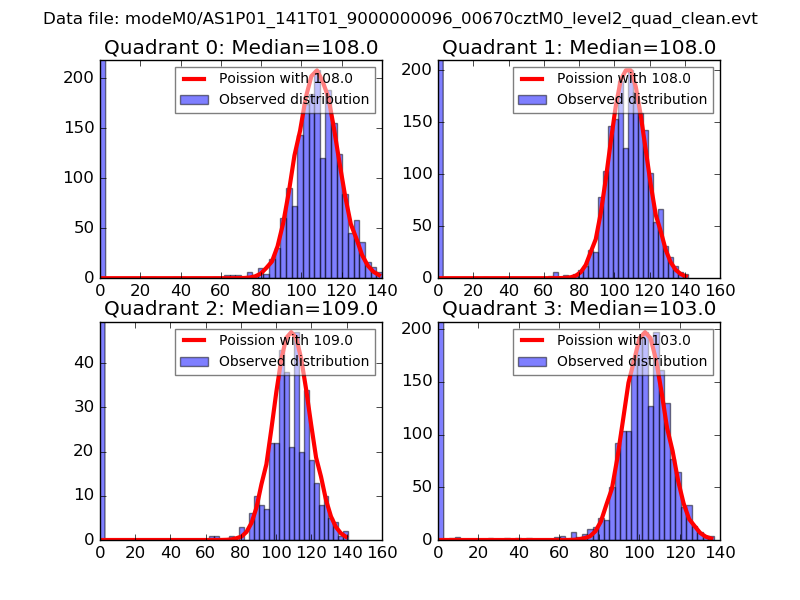 |
 |
| Quadrant-wise count rates Data is divided into 100 sec bins |
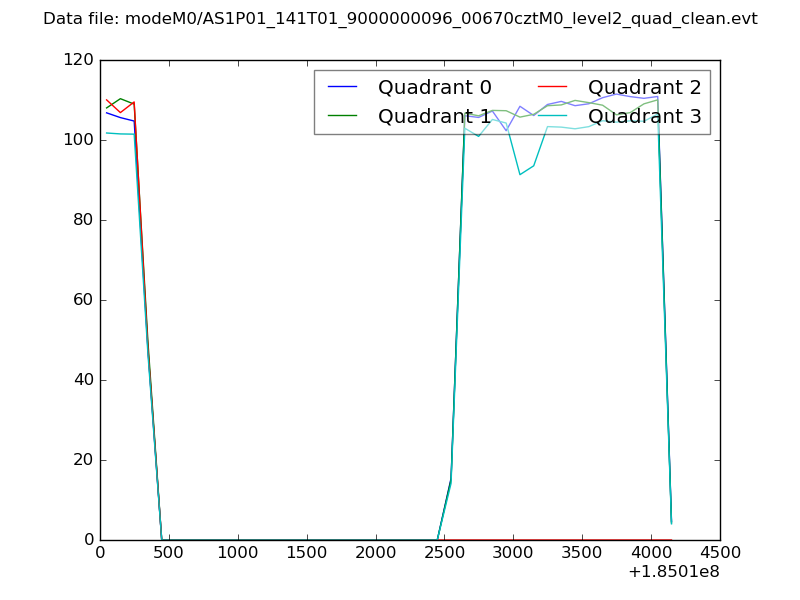 |
|
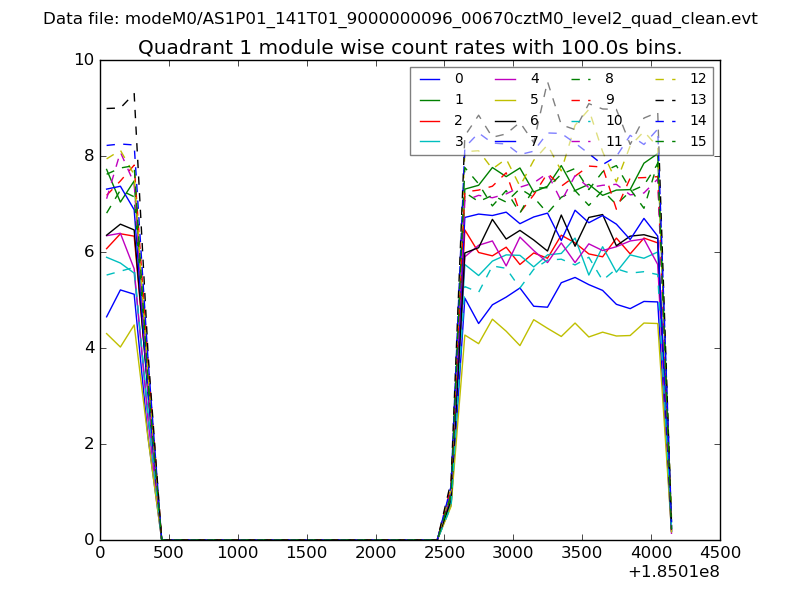
| Module-wise count rates for Quadrant A Data is divided into 100 sec bins |
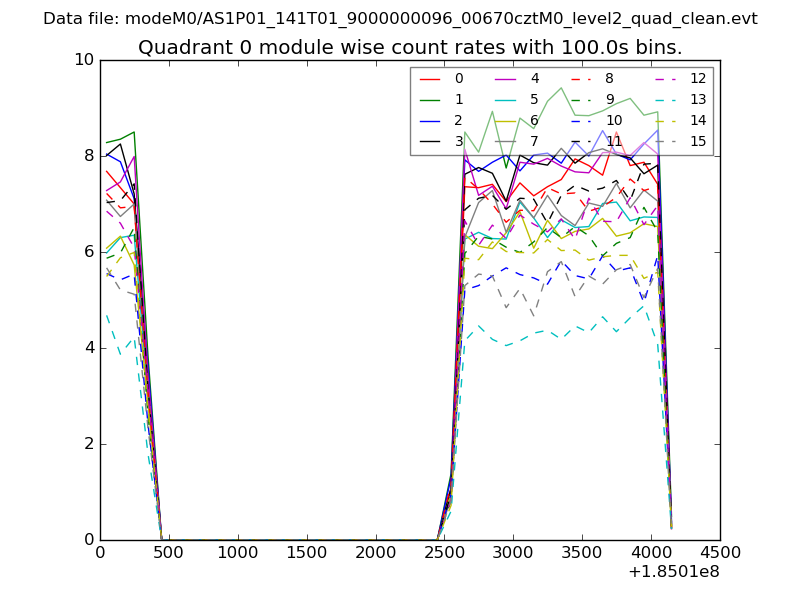 |
 |
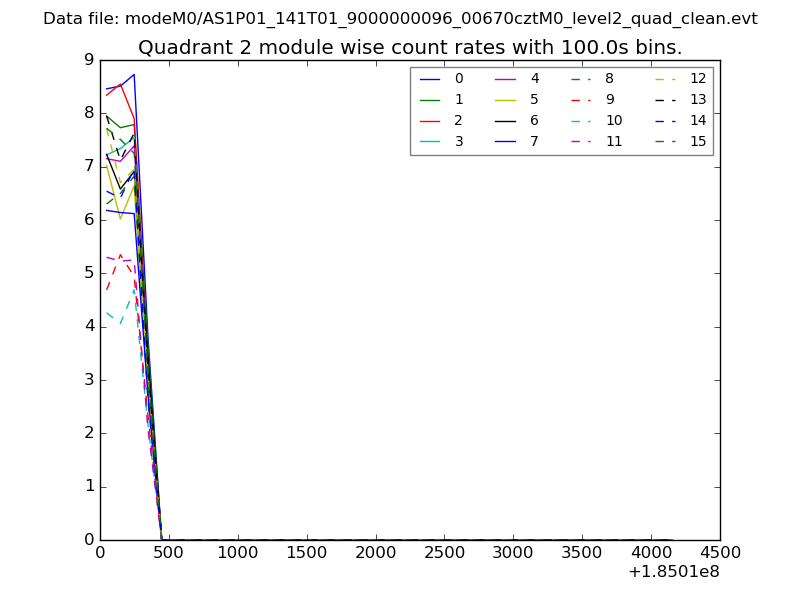
| Module-wise count rates for Quadrant B Data is divided into 100 sec bins |
 |
 |
| Module-wise count rates for Quadrant C Data is divided into 100 sec bins |
 |
 |
| Module-wise count rates for Quadrant D Data is divided into 100 sec bins |
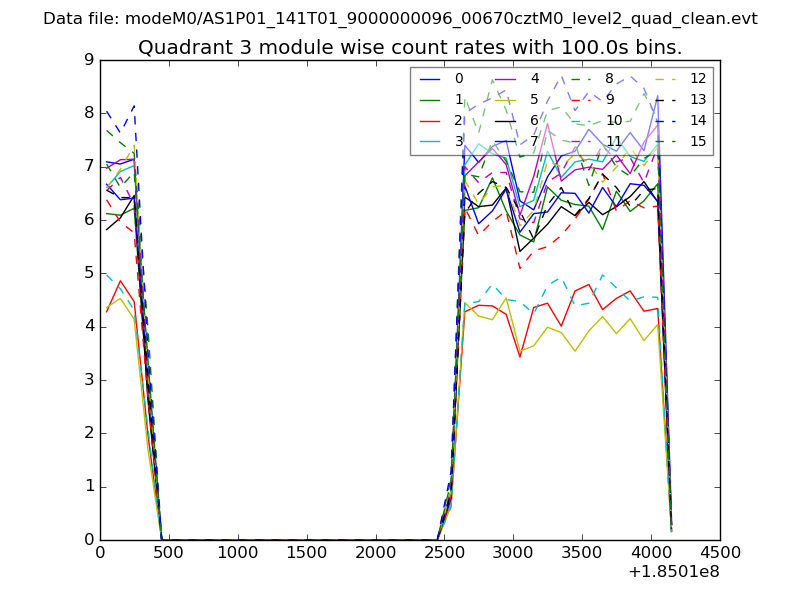 |
 |
| Parameter | Plot |
|---|---|
| CZT HV Monitor | 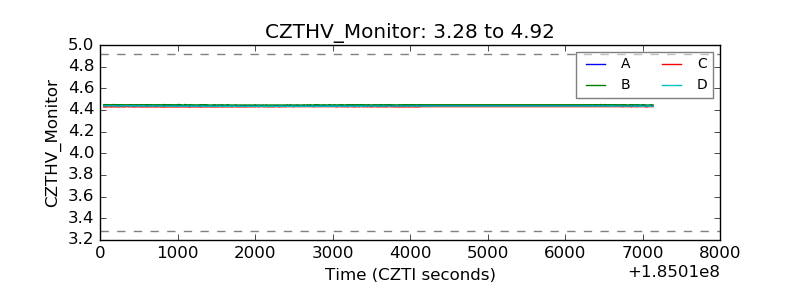 |
| D_VDD | 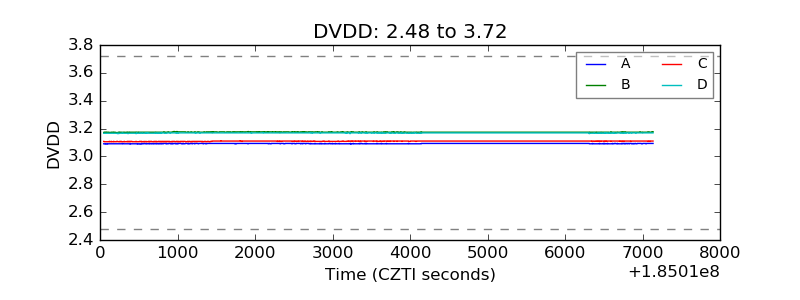 |
| Temperature 1 | 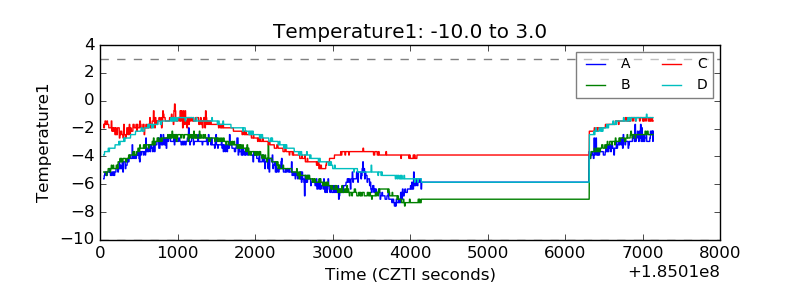 |
| Veto HV Monitor | 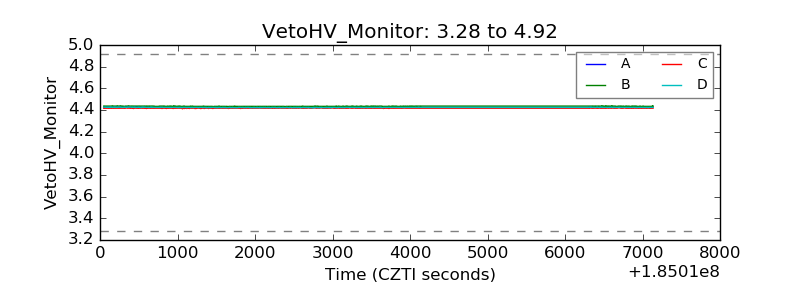 |
| Veto LLD | 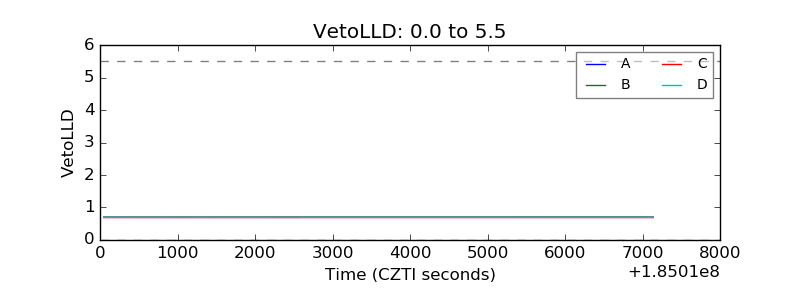 |
| Alpha Counter | 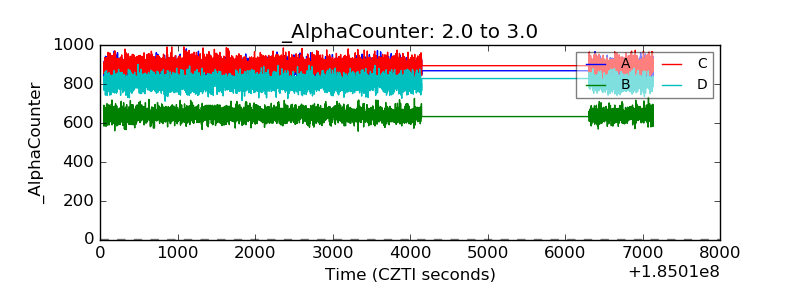 |
| _CPM_Rate | 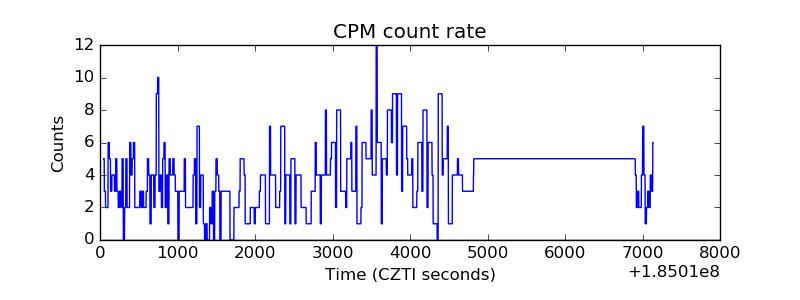 |
| CZT Counter | 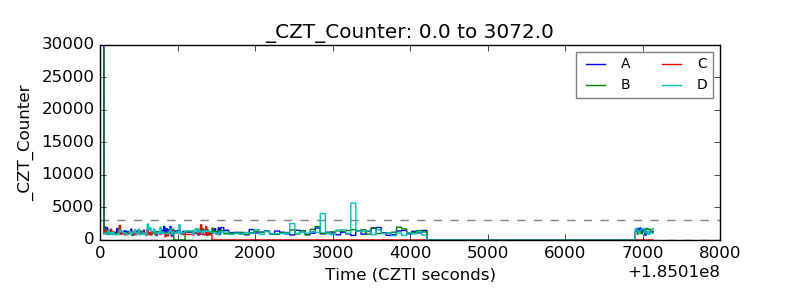 |
| +2.5 Volts monitor | 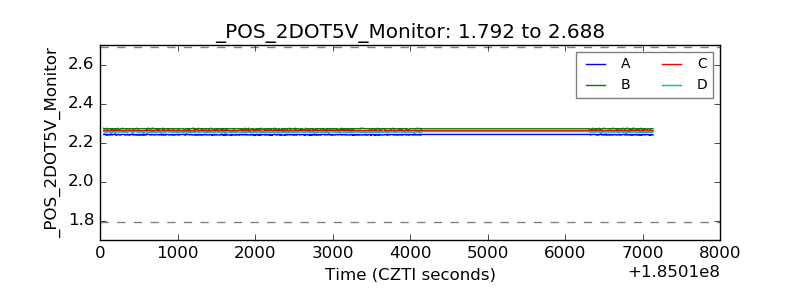 |
| +5 Volts monitor |  |
| _ROLL_ROT | 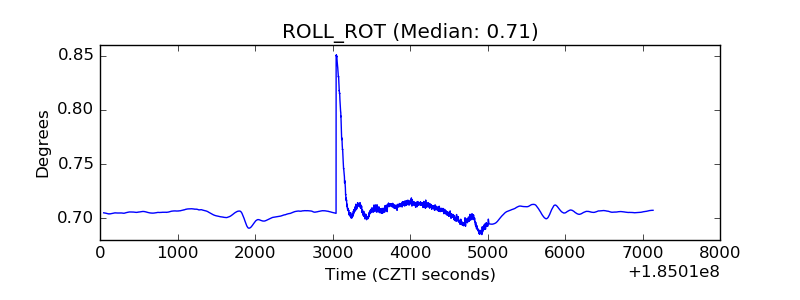 |
| _Roll_DEC | 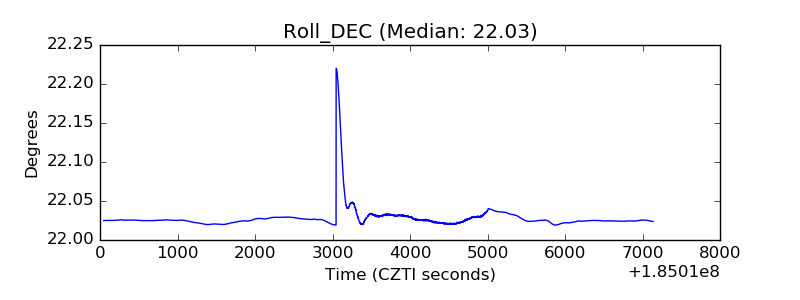 |
| _Roll_RA | 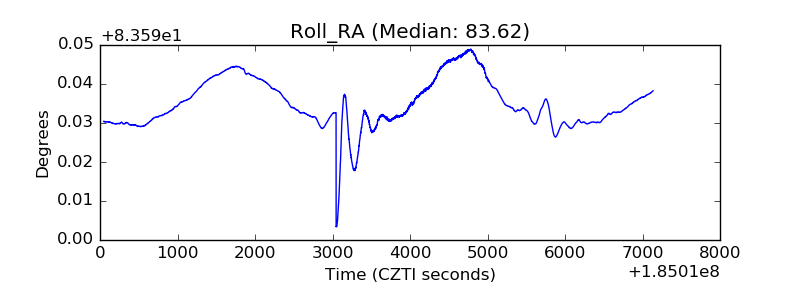 |
| Veto Counter | 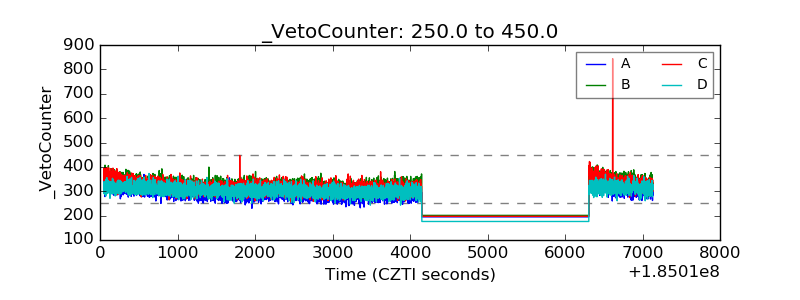 |