| Param | Original file | Final file |
|---|---|---|
| Filename | modeM0/AS1P01_141T01_9000000096_00672cztM0_level2.evt | modeM0/AS1P01_141T01_9000000096_00672cztM0_level2_quad_clean.evt |
| Size (bytes) | 1,527,033,600 | 71,118,720 |
| Size | 1.4 GB | 67.8 MB |
| Events in quadrant A | 11,434,330 | 412,322 |
| Events in quadrant B | 11,650,453 | 416,237 |
| Events in quadrant C | 10,527,139 | 414,277 |
| Events in quadrant D | 12,113,046 | 359,780 |
| Mode M0 | |||
|---|---|---|---|
| Quadrant | BADHDUFLAG | Total packets | Discarded packets |
| A | 0 | 39678 | 1 |
| B | 0 | 40302 | 1 |
| C | 0 | 37011 | 1 |
| D | 0 | 41840 | 1 |
| Mode SS | |||
|---|---|---|---|
| Quadrant | BADHDUFLAG | Total packets | Discarded packets |
| A | 0 | 160 | 0 |
| B | 0 | 160 | 0 |
| C | 0 | 160 | 0 |
| D | 0 | 160 | 0 |
| Quadrant | Total seconds | Saturated seconds | Saturation percentage |
|---|---|---|---|
| A | 7994 | 532 | 6.654991% |
| B | 7994 | 535 | 6.692519% |
| C | 7994 | 495 | 6.192144% |
| D | 7695 | 898 | 11.669916% |
Noise dominated data is calculated using 1-second bins in cleaned event files. If a bin has >2000 counts, and if more than 50% of those come from <1% of pixels, then it is considered to be noise-dominated and hence unusable.
| Quadrant | # 1 sec bins | Bins with >0 counts | Bins with >2000 counts | High rate bins dominated by noise | Noise dominated (total time) | Noise dominated (detector-on time) | Marked lightcurve |
|---|---|---|---|---|---|---|---|
| A | 8014 | 7995 | 1004 | 1004 | 12.53% | 12.56% | 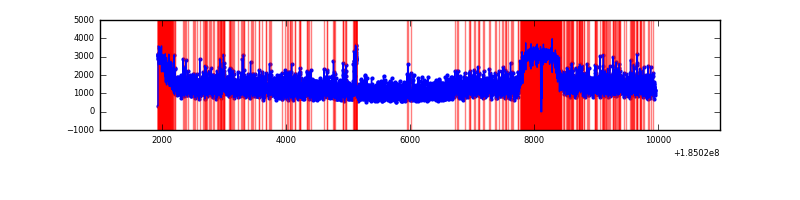 |
| B | 8014 | 7995 | 1113 | 1113 | 13.89% | 13.92% | 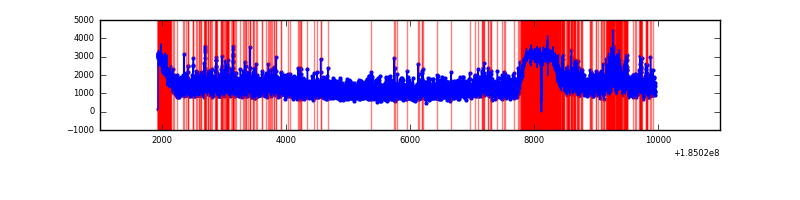 |
| C | 8014 | 7995 | 787 | 787 | 9.82% | 9.84% | 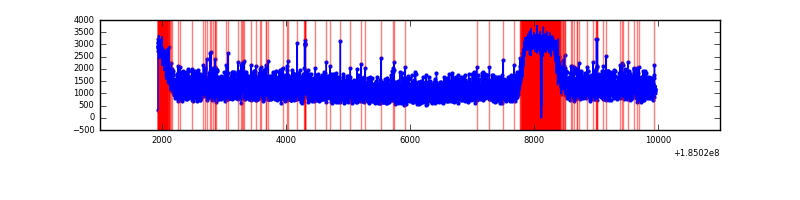 |
| D | 8013 | 7697 | 1669 | 1669 | 20.83% | 21.68% | 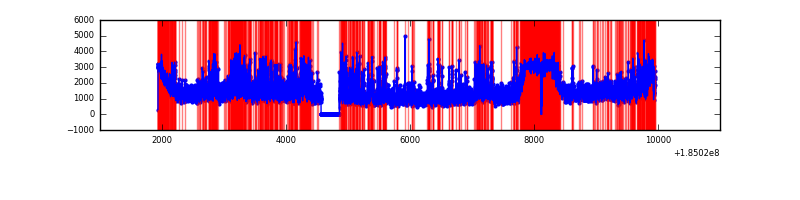 |
Top three noisy pixels from each quadrant. If the there are fewer than three noisy pixels in the level2.evt file, extra rows are filled as -1
| Pixel properties | Quadrant properties | ||||||
|---|---|---|---|---|---|---|---|
| Quadrant | DetID | PixID | Counts | Sigma | Mean | Median | Sigma |
| A | 12 | 236 | 80633 | 120.22 | 2887 | 2858 | 646.9 |
| A | 0 | 69 | 77819 | 115.87 | 2887 | 2858 | 646.9 |
| A | 13 | 160 | 36749 | 52.39 | 2887 | 2858 | 646.9 |
| B | 7 | 221 | 514951 | 745.18 | 2856 | 2875 | 687.2 |
| B | 4 | 250 | 117840 | 167.3 | 2856 | 2875 | 687.2 |
| B | 0 | 220 | 95530 | 134.83 | 2856 | 2875 | 687.2 |
| C | 9 | 52 | 82951 | 105.62 | 2650 | 2748 | 759.4 |
| C | 2 | 192 | 24913 | 29.19 | 2650 | 2748 | 759.4 |
| C | 15 | 241 | 19733 | 22.37 | 2650 | 2748 | 759.4 |
| D | 1 | 4 | 1487749 | 1862.23 | 2478 | 2582 | 797.5 |
| D | 12 | 237 | 284058 | 352.94 | 2478 | 2582 | 797.5 |
| D | 12 | 33 | 223922 | 277.54 | 2478 | 2582 | 797.5 |
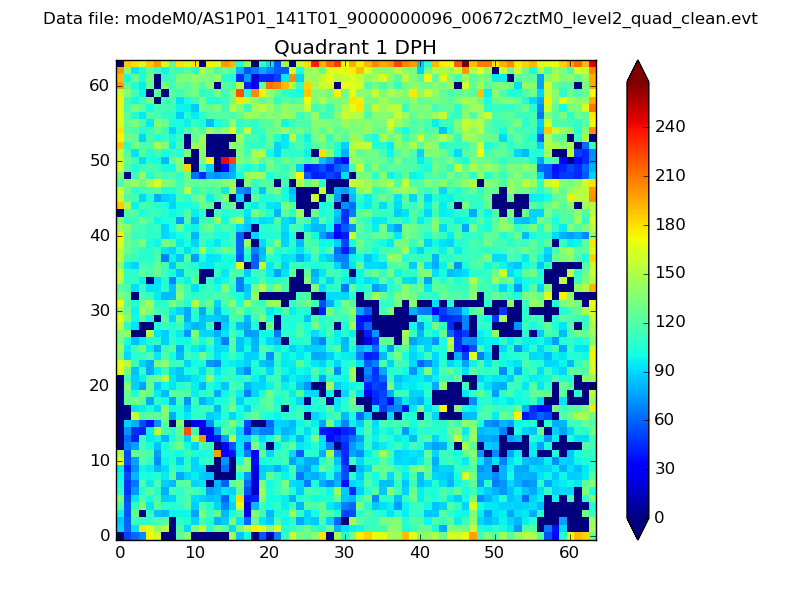
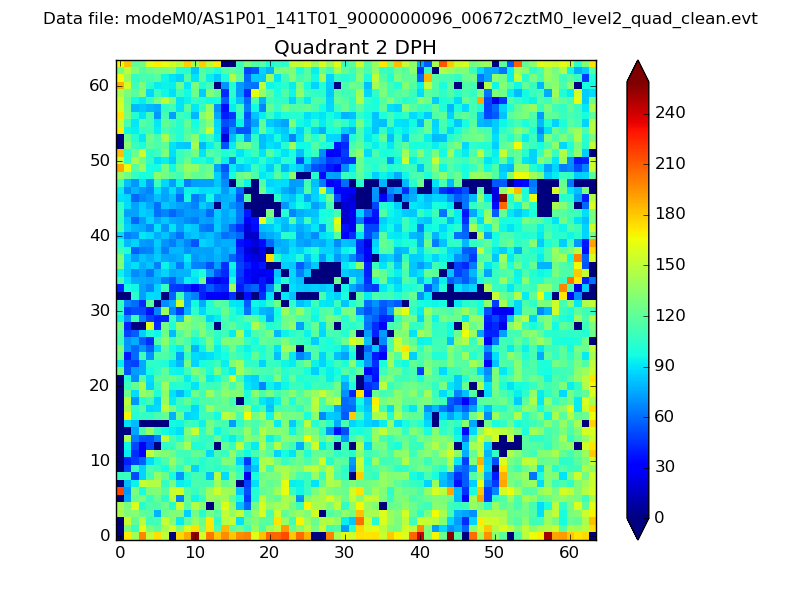
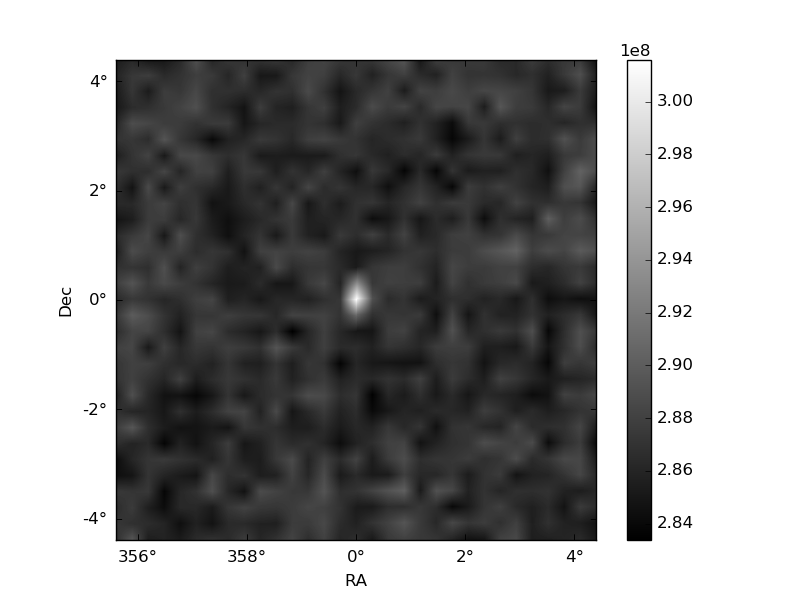
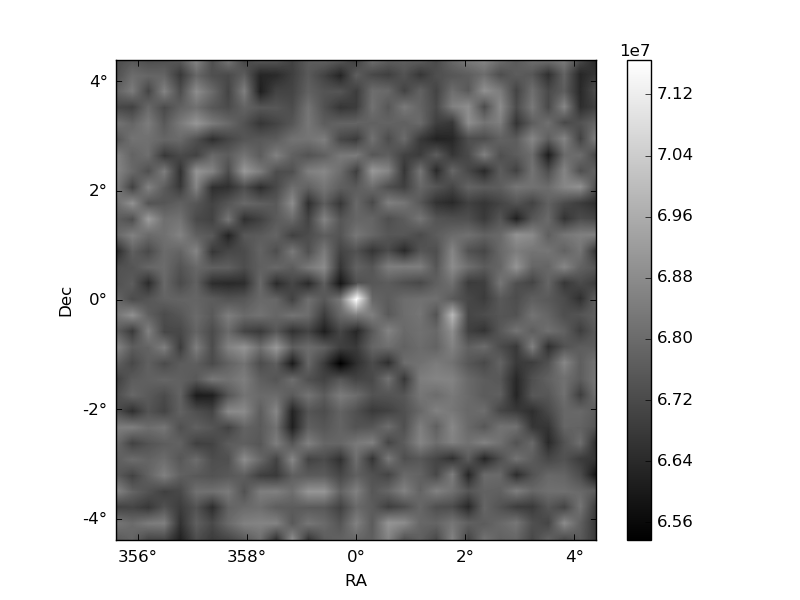
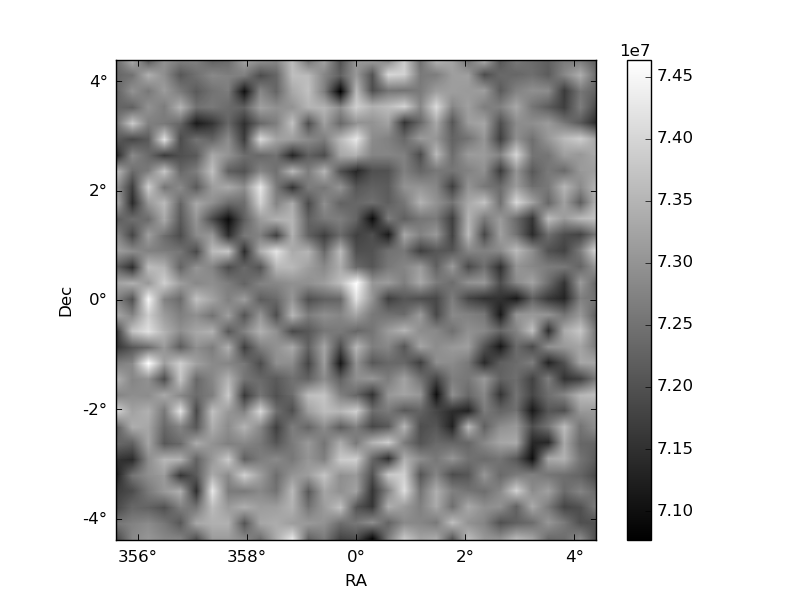
Histogram calculated using DETX and DETY for each event in the final _common_clean file
| Quadrant A |  |
 |
Quadrant B |
|---|---|---|---|
| Quadrant D | 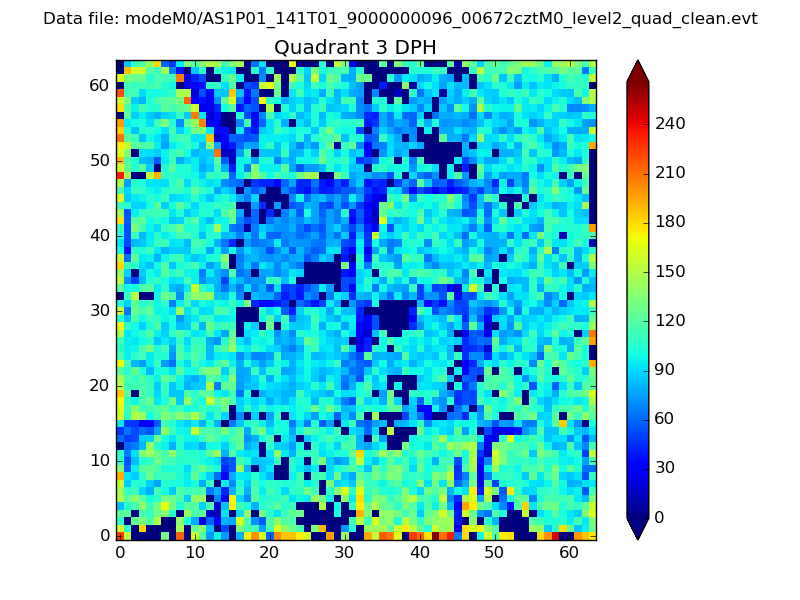 |
 |
Quadrant C |
| Plot type | Count rate plots | Images |
|---|---|---|
| Comparison with Poisson distribution Blue bars denote a histogram of data divided into 1 sec bins. Red curve is a Poisson curve with rate = median count rate of data. |
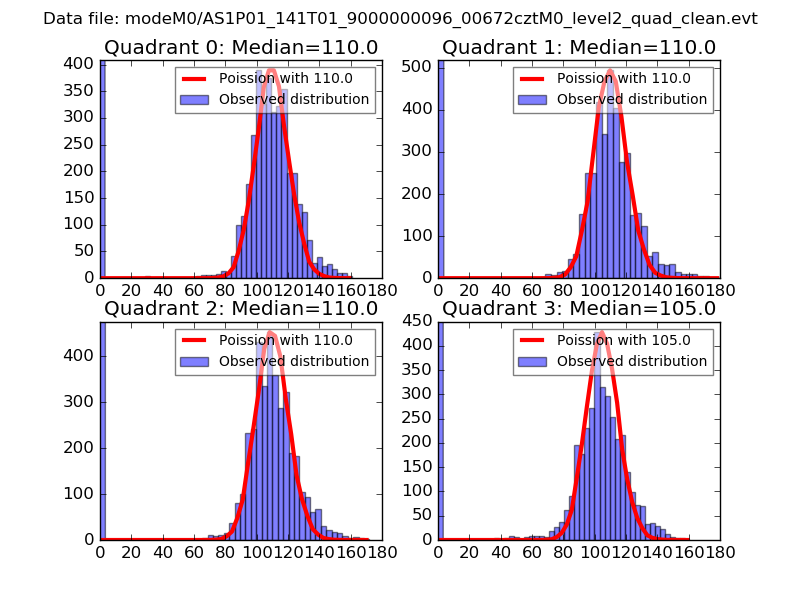 |
 |
| Quadrant-wise count rates Data is divided into 100 sec bins |
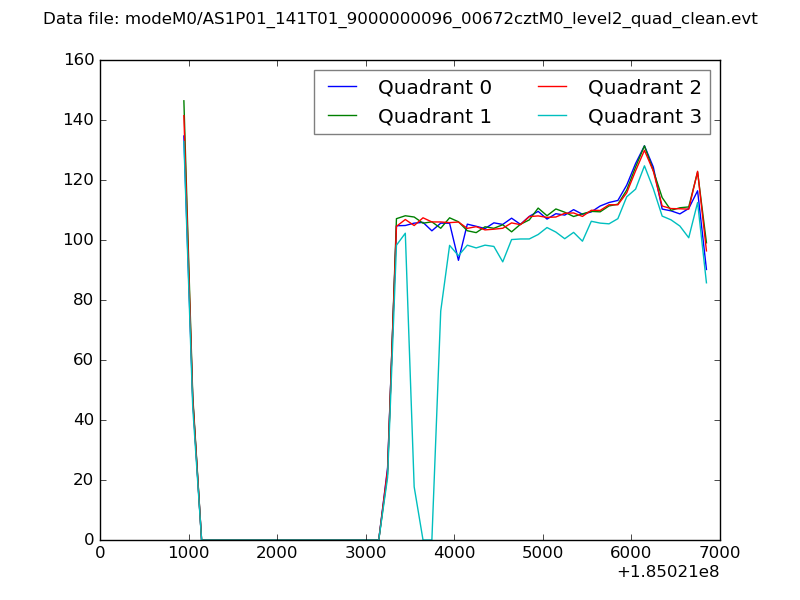 |
|
| Module-wise count rates for Quadrant A Data is divided into 100 sec bins |
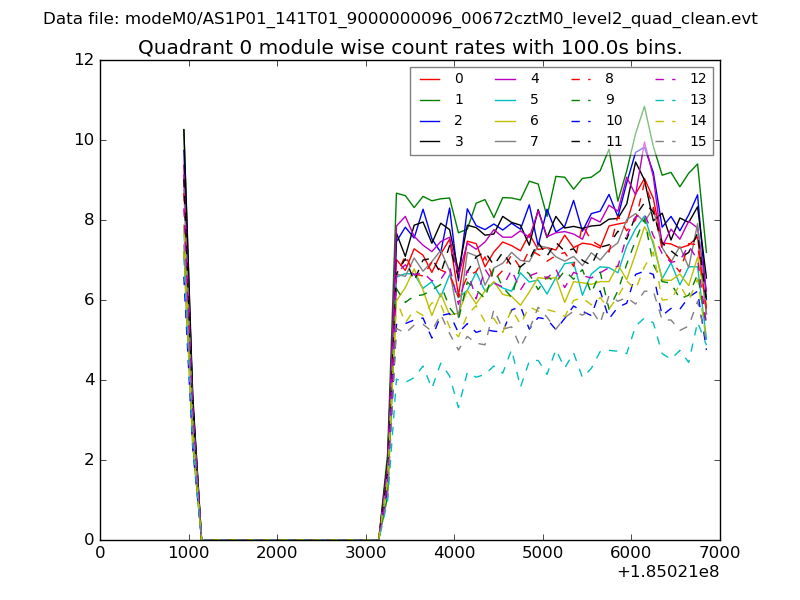 |
 |
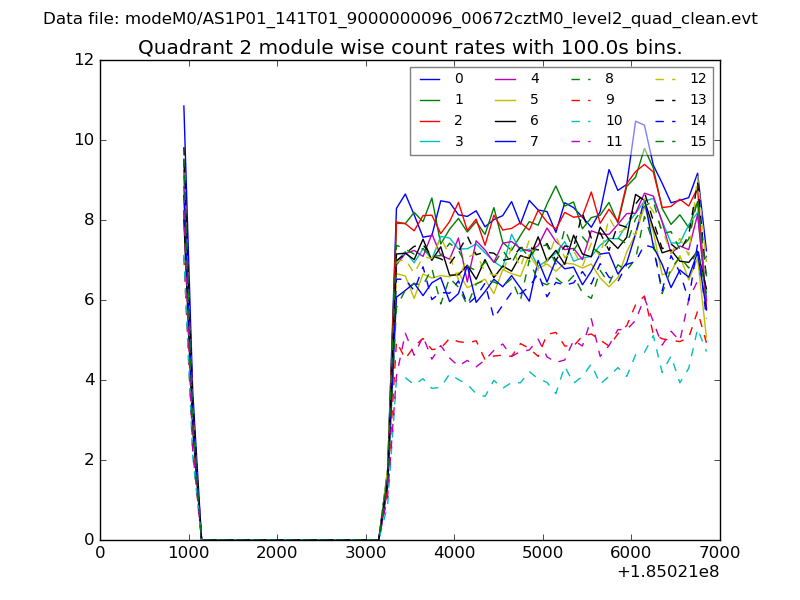
| Module-wise count rates for Quadrant B Data is divided into 100 sec bins |
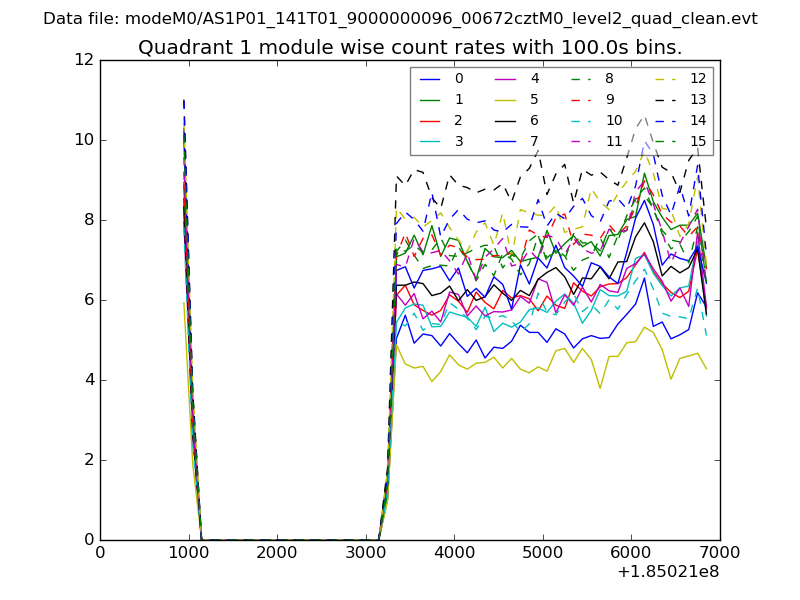 |
 |
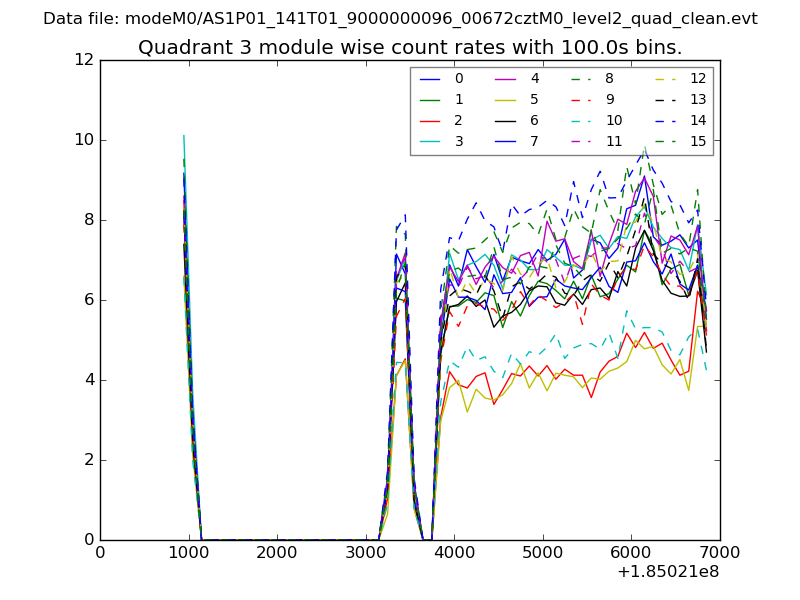
| Module-wise count rates for Quadrant C Data is divided into 100 sec bins |
 |
 |
| Module-wise count rates for Quadrant D Data is divided into 100 sec bins |
 |
 |
| Parameter | Plot |
|---|---|
| CZT HV Monitor | 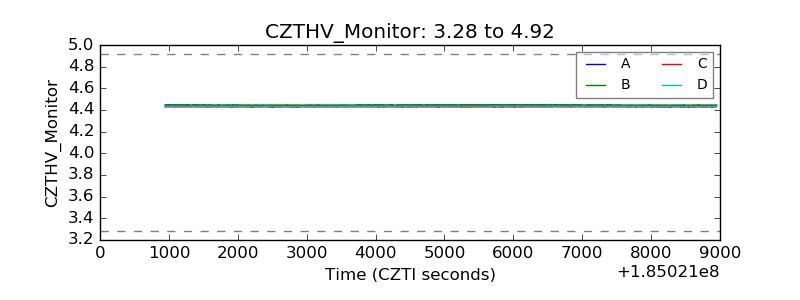 |
| D_VDD | 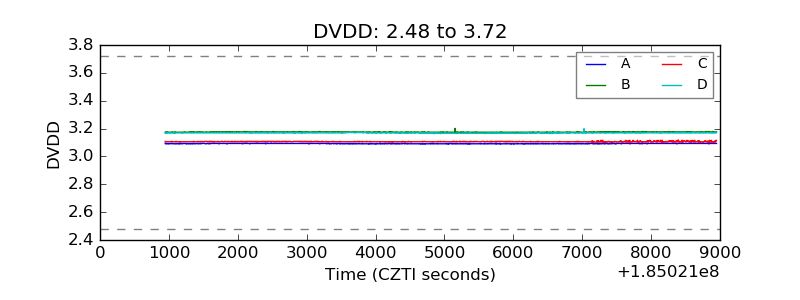 |
| Temperature 1 | 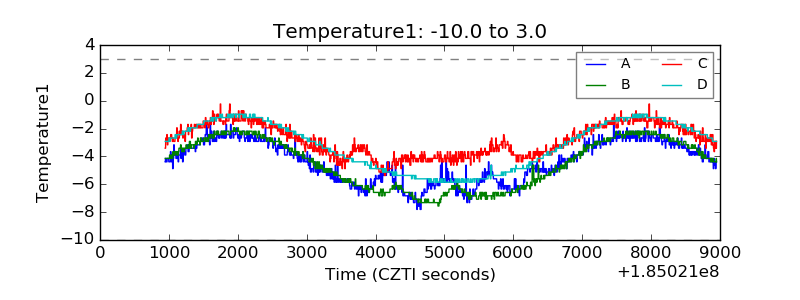 |
| Veto HV Monitor | 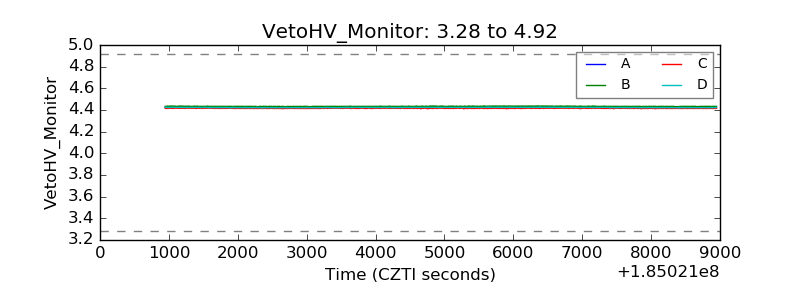 |
| Veto LLD | 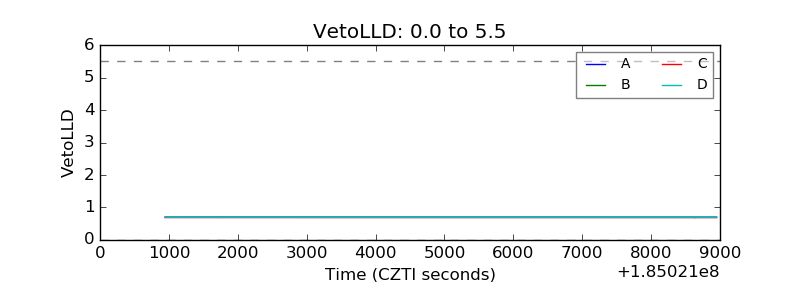 |
| Alpha Counter | 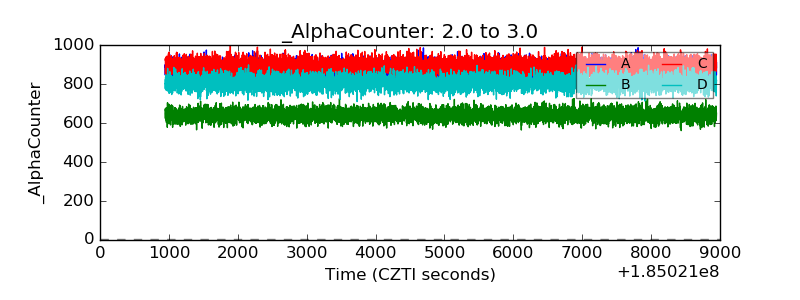 |
| _CPM_Rate | 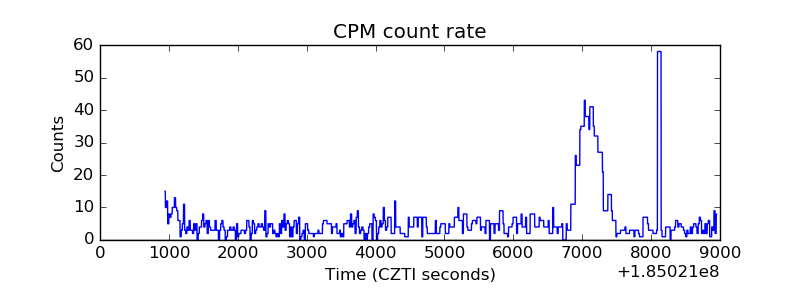 |
| CZT Counter | 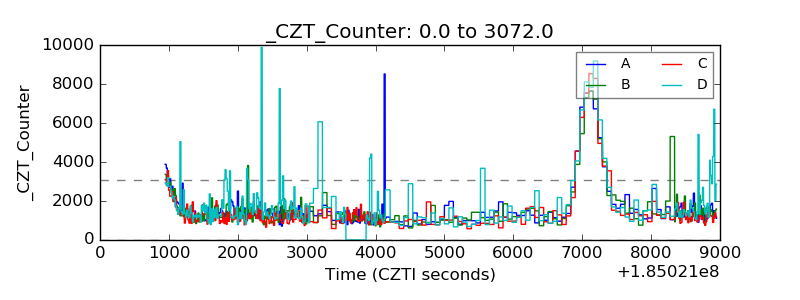 |
| +2.5 Volts monitor |  |
| +5 Volts monitor | 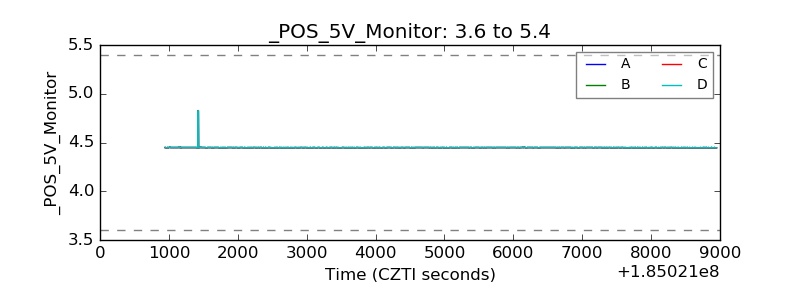 |
| _ROLL_ROT | 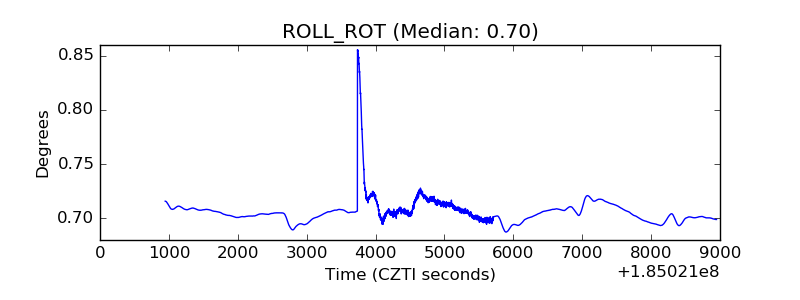 |
| _Roll_DEC | 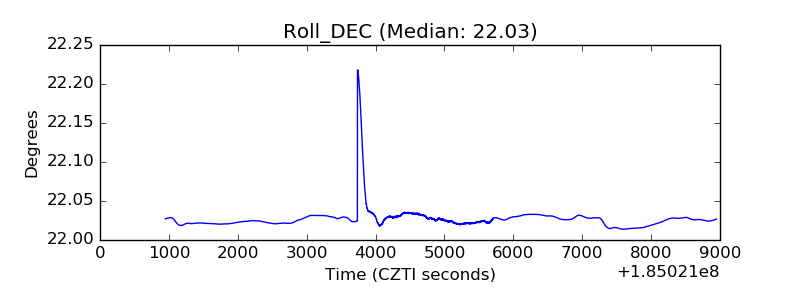 |
| _Roll_RA | 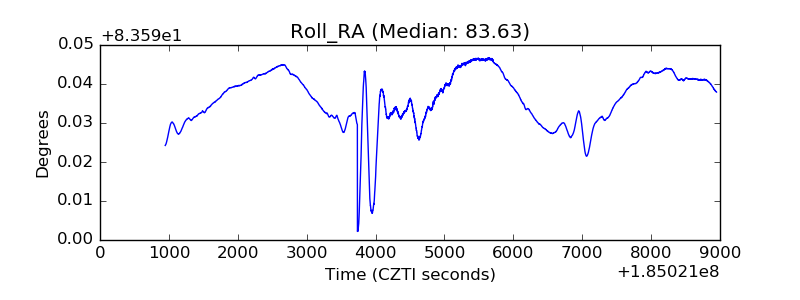 |
| Veto Counter | 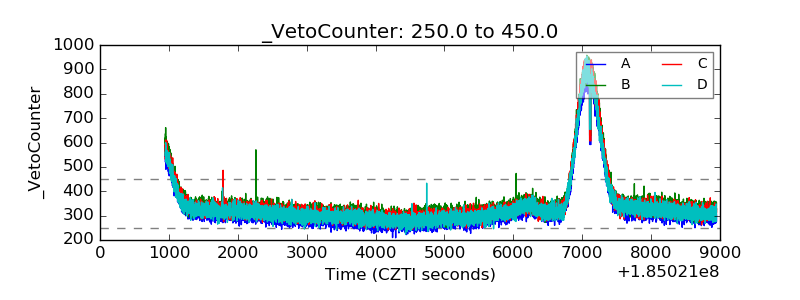 |