| Param | Original file | Final file |
|---|---|---|
| Filename | modeM0/AS1P01_141T01_9000000096_00673cztM0_level2.evt | modeM0/AS1P01_141T01_9000000096_00673cztM0_level2_quad_clean.evt |
| Size (bytes) | 1,111,680,000 | 68,506,560 |
| Size | 1.0 GB | 65.3 MB |
| Events in quadrant A | 8,308,890 | 410,356 |
| Events in quadrant B | 8,854,408 | 407,774 |
| Events in quadrant C | 7,549,422 | 411,951 |
| Events in quadrant D | 8,525,878 | 392,235 |
| Mode M9 | |||
|---|---|---|---|
| Quadrant | BADHDUFLAG | Total packets | Discarded packets |
| A | 0 | 6 | 0 |
| B | 0 | 6 | 0 |
| C | 0 | 6 | 0 |
| D | 0 | 6 | 0 |
| Mode M0 | |||
|---|---|---|---|
| Quadrant | BADHDUFLAG | Total packets | Discarded packets |
| A | 0 | 29315 | 3 |
| B | 0 | 30927 | 1 |
| C | 0 | 27051 | 1 |
| D | 0 | 30126 | 2 |
| Mode SS | |||
|---|---|---|---|
| Quadrant | BADHDUFLAG | Total packets | Discarded packets |
| A | 0 | 134 | 0 |
| B | 0 | 134 | 0 |
| C | 0 | 134 | 0 |
| D | 0 | 134 | 0 |
| Quadrant | Total seconds | Saturated seconds | Saturation percentage |
|---|---|---|---|
| A | 6526 | 20 | 0.306466% |
| B | 6526 | 103 | 1.578302% |
| C | 6526 | 7 | 0.107263% |
| D | 6318 | 449 | 7.106679% |
Noise dominated data is calculated using 1-second bins in cleaned event files. If a bin has >2000 counts, and if more than 50% of those come from <1% of pixels, then it is considered to be noise-dominated and hence unusable.
| Quadrant | # 1 sec bins | Bins with >0 counts | Bins with >2000 counts | High rate bins dominated by noise | Noise dominated (total time) | Noise dominated (detector-on time) | Marked lightcurve |
|---|---|---|---|---|---|---|---|
| A | 7171 | 6527 | 342 | 342 | 4.77% | 5.24% | 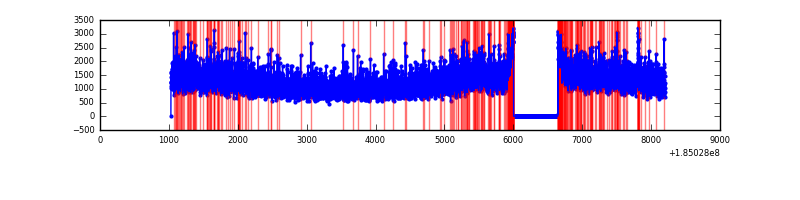 |
| B | 7171 | 6527 | 535 | 535 | 7.46% | 8.20% | 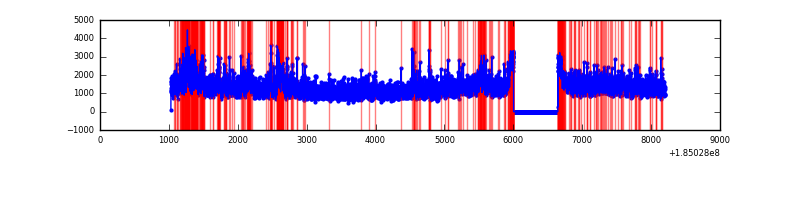 |
| C | 7171 | 6527 | 139 | 139 | 1.94% | 2.13% | 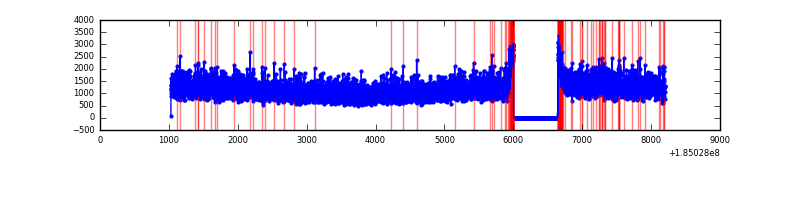 |
| D | 7171 | 6320 | 891 | 891 | 12.43% | 14.10% | 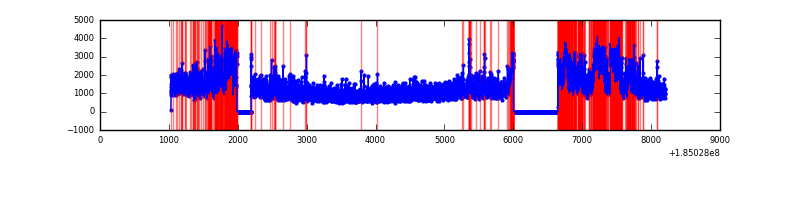 |
Top three noisy pixels from each quadrant. If the there are fewer than three noisy pixels in the level2.evt file, extra rows are filled as -1
| Pixel properties | Quadrant properties | ||||||
|---|---|---|---|---|---|---|---|
| Quadrant | DetID | PixID | Counts | Sigma | Mean | Median | Sigma |
| A | 14 | 79 | 57301 | 118.0 | 2104 | 2084 | 467.9 |
| A | 13 | 160 | 29714 | 59.05 | 2104 | 2084 | 467.9 |
| A | 0 | 69 | 26492 | 52.16 | 2104 | 2084 | 467.9 |
| B | 7 | 221 | 796732 | 1603.94 | 2085 | 2098 | 495.4 |
| B | 0 | 220 | 53608 | 103.97 | 2085 | 2098 | 495.4 |
| B | 5 | 176 | 23215 | 42.62 | 2085 | 2098 | 495.4 |
| C | 15 | 241 | 20687 | 34.86 | 1910 | 1981 | 536.6 |
| C | 9 | 52 | 19440 | 32.54 | 1910 | 1981 | 536.6 |
| C | 2 | 192 | 11600 | 17.93 | 1910 | 1981 | 536.6 |
| D | 12 | 237 | 1001467 | 1814.49 | 1748 | 1820 | 550.9 |
| D | 12 | 33 | 268650 | 484.33 | 1748 | 1820 | 550.9 |
| D | 1 | 4 | 209656 | 377.25 | 1748 | 1820 | 550.9 |
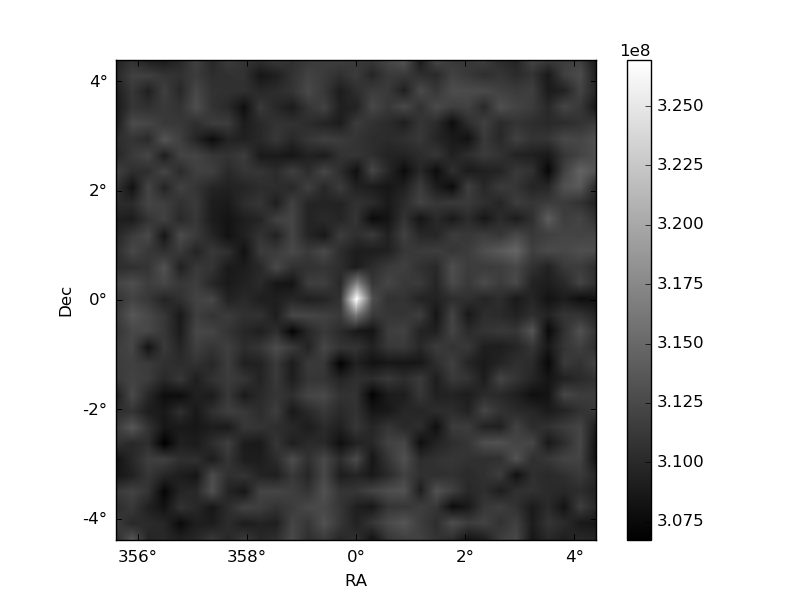
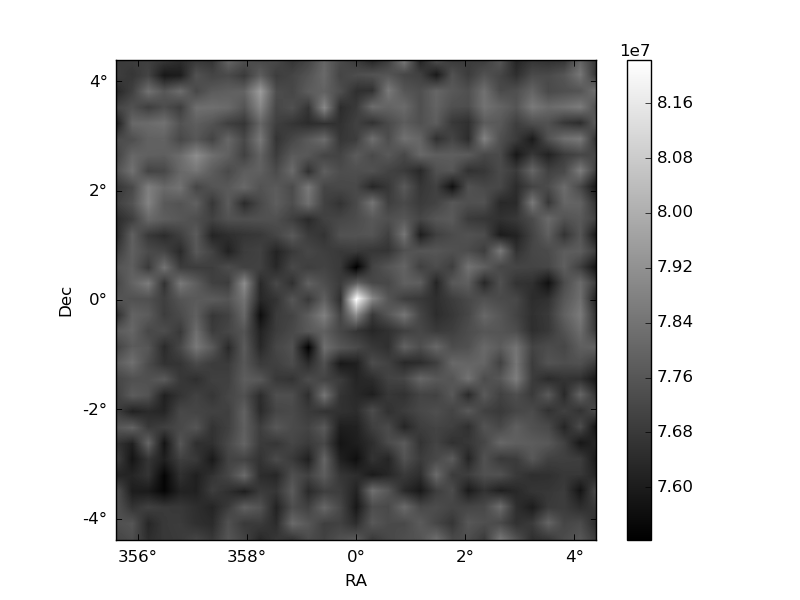
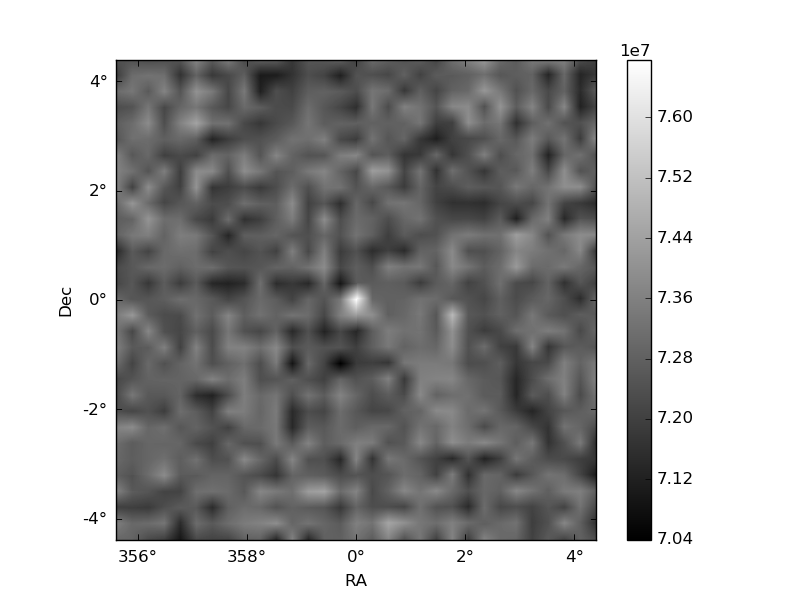
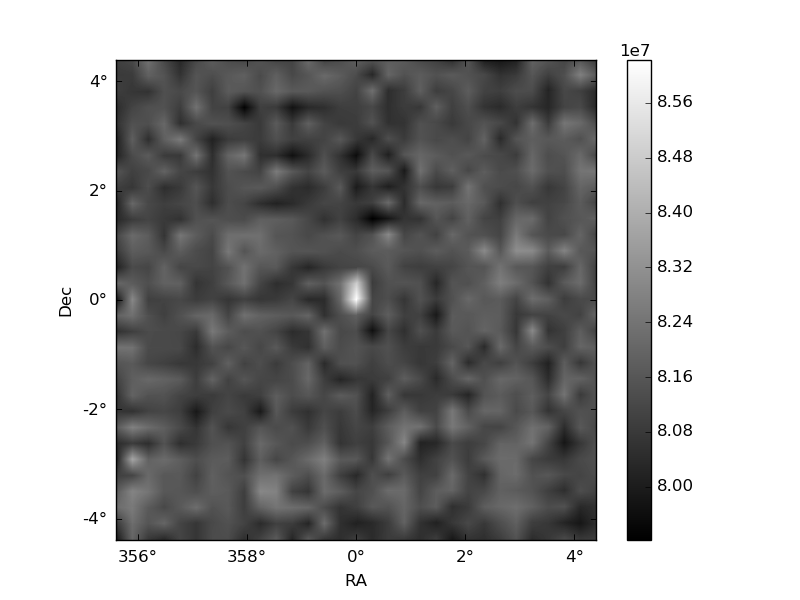
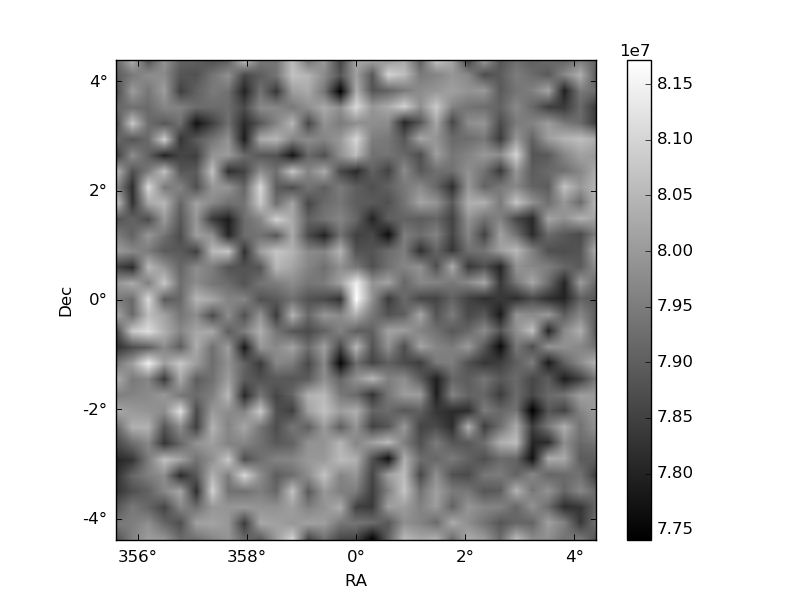
Histogram calculated using DETX and DETY for each event in the final _common_clean file
| Quadrant A | 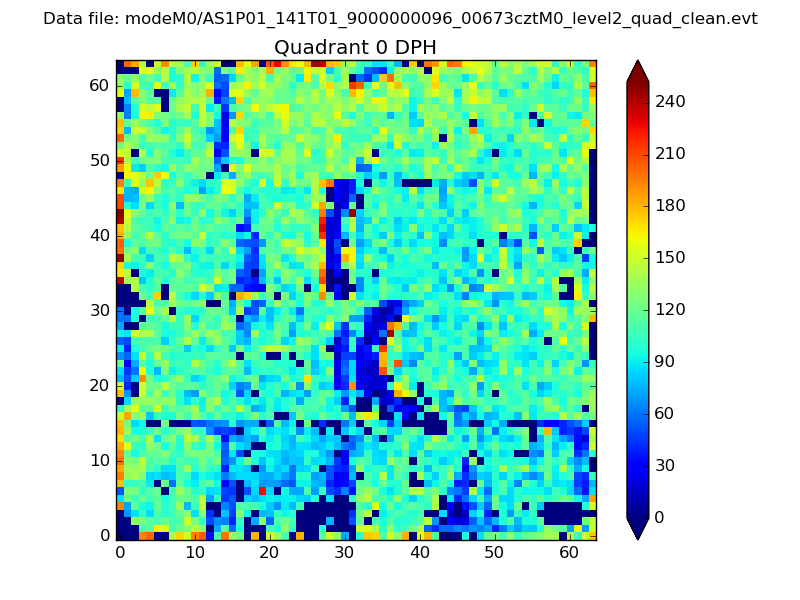 |
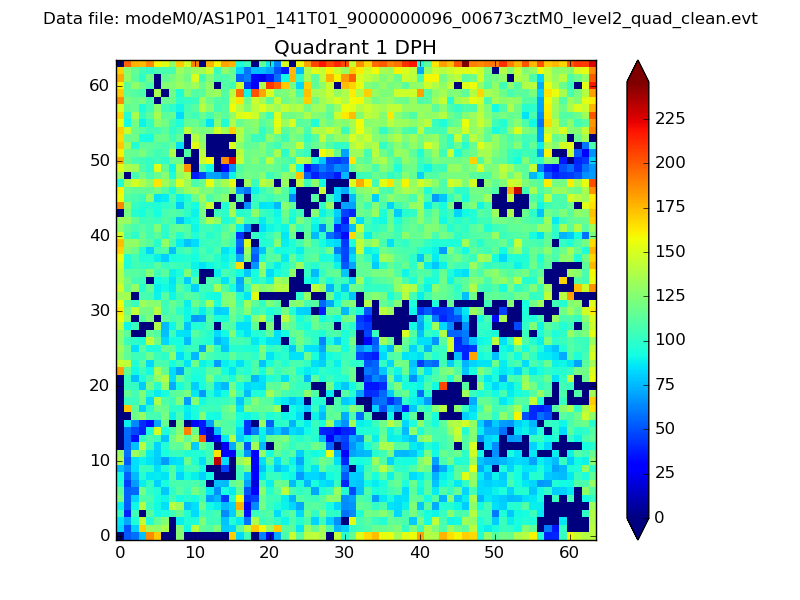 |
Quadrant B |
|---|---|---|---|
| Quadrant D | 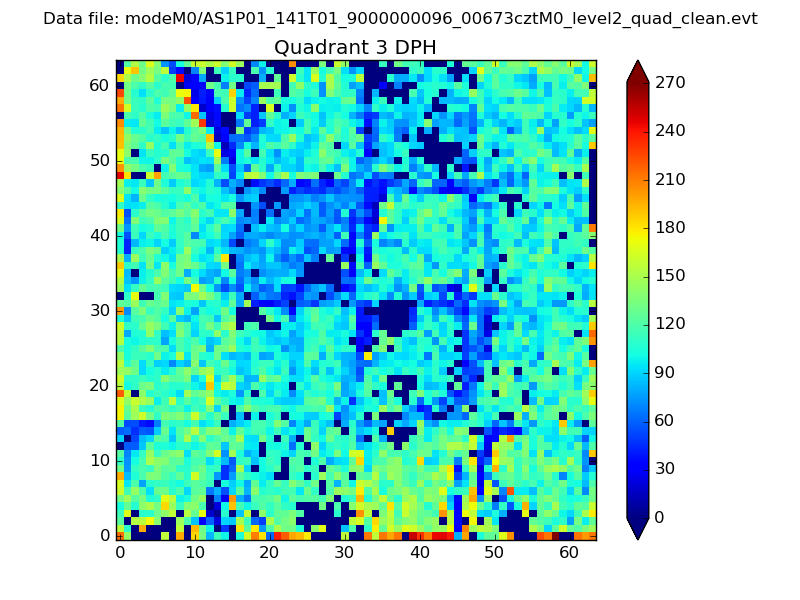 |
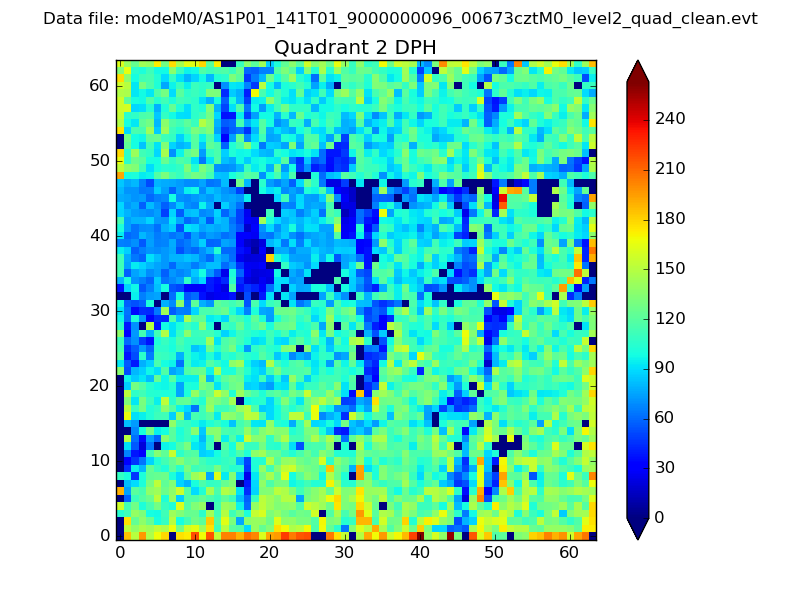 |
Quadrant C |
| Plot type | Count rate plots | Images |
|---|---|---|
| Comparison with Poisson distribution Blue bars denote a histogram of data divided into 1 sec bins. Red curve is a Poisson curve with rate = median count rate of data. |
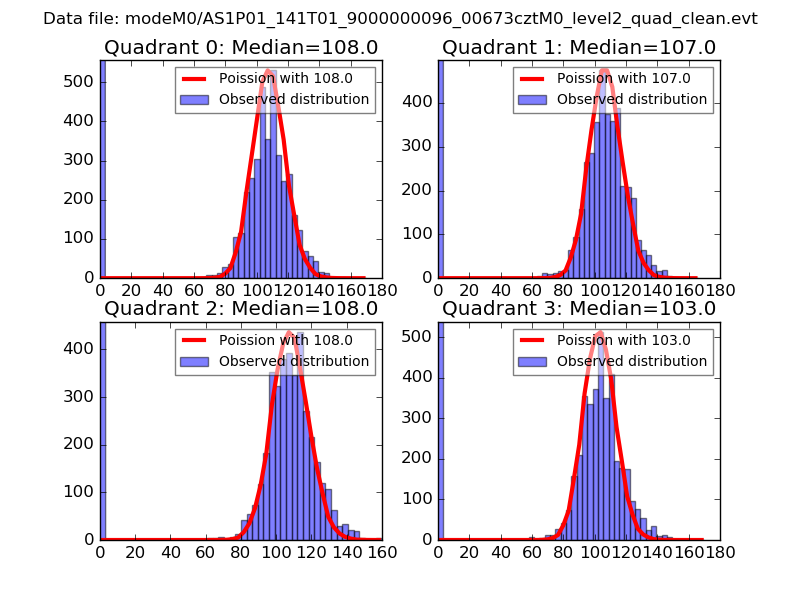 |
 |
| Quadrant-wise count rates Data is divided into 100 sec bins |
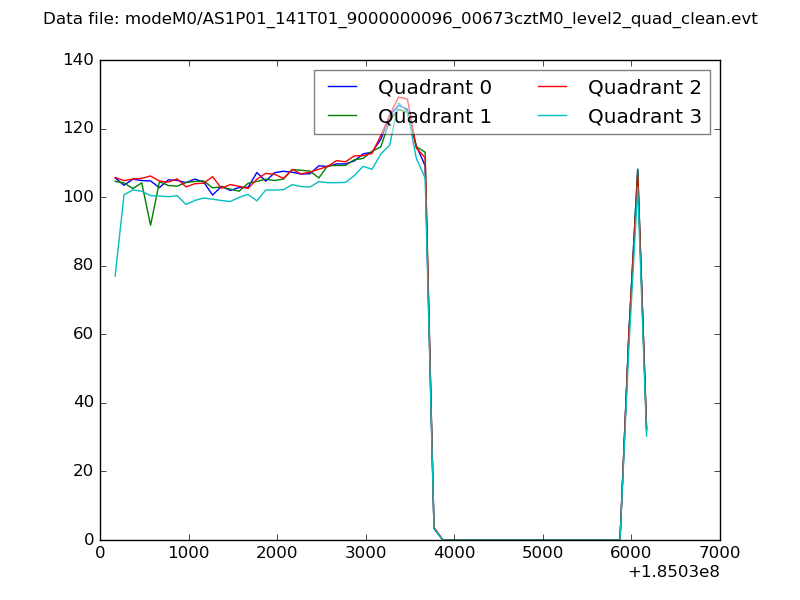 |
|
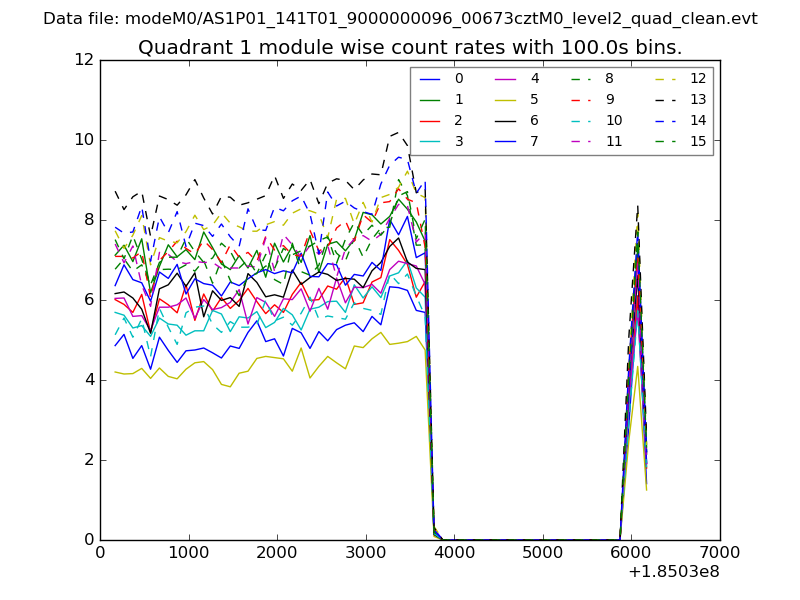
| Module-wise count rates for Quadrant A Data is divided into 100 sec bins |
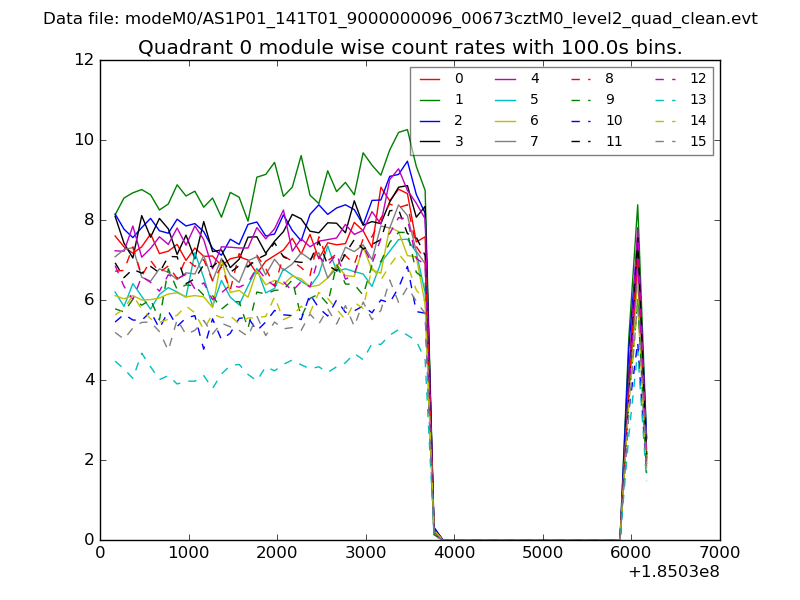 |
 |
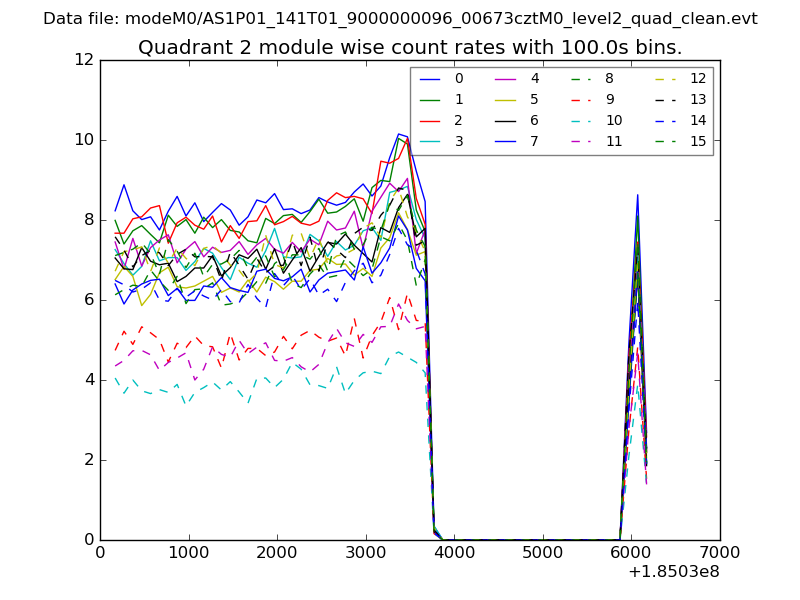
| Module-wise count rates for Quadrant B Data is divided into 100 sec bins |
 |
 |
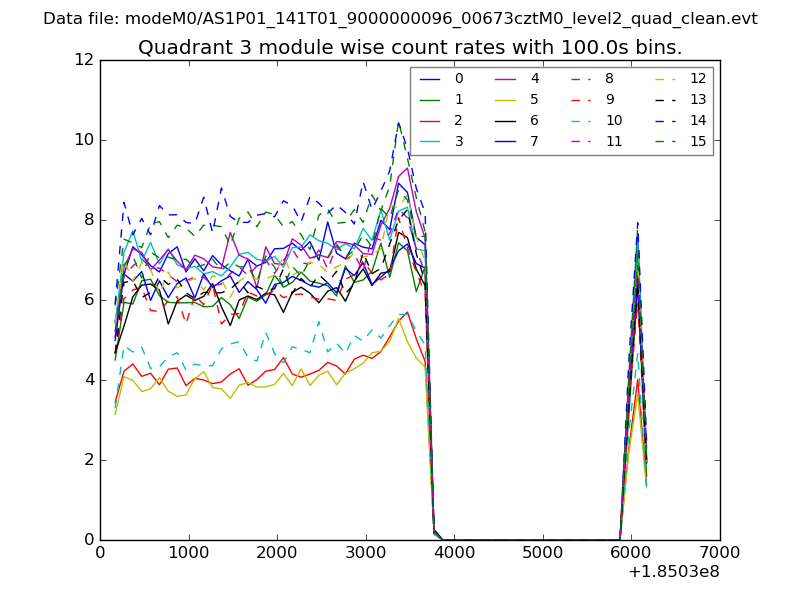
| Module-wise count rates for Quadrant C Data is divided into 100 sec bins |
 |
 |
| Module-wise count rates for Quadrant D Data is divided into 100 sec bins |
 |
 |
| Parameter | Plot |
|---|---|
| CZT HV Monitor | 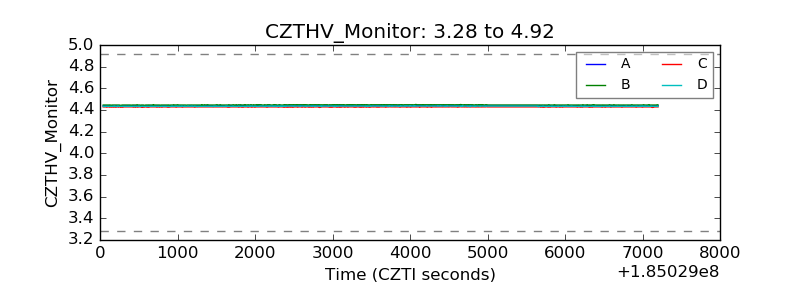 |
| D_VDD | 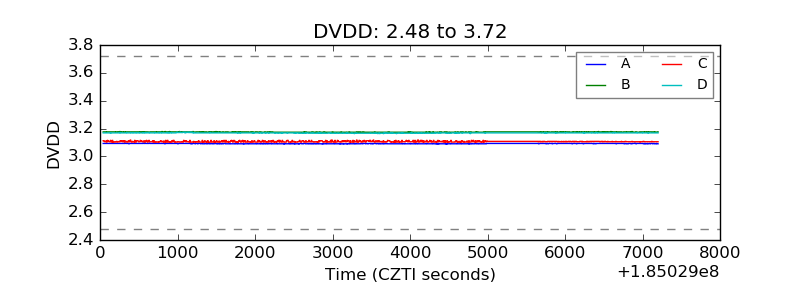 |
| Temperature 1 | 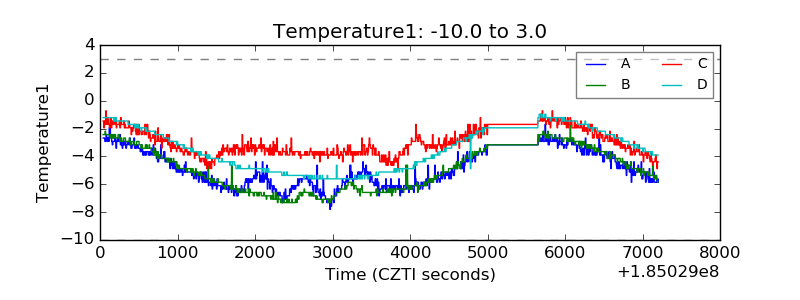 |
| Veto HV Monitor | 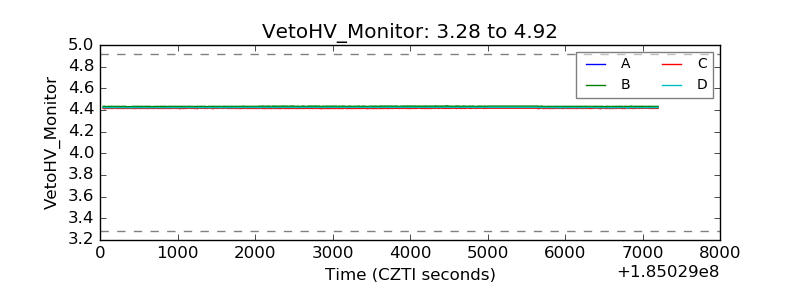 |
| Veto LLD | 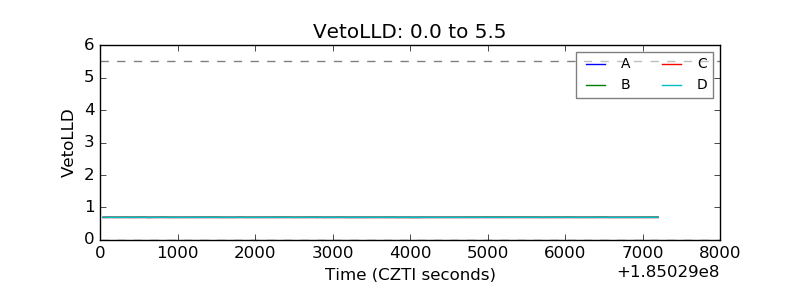 |
| Alpha Counter | 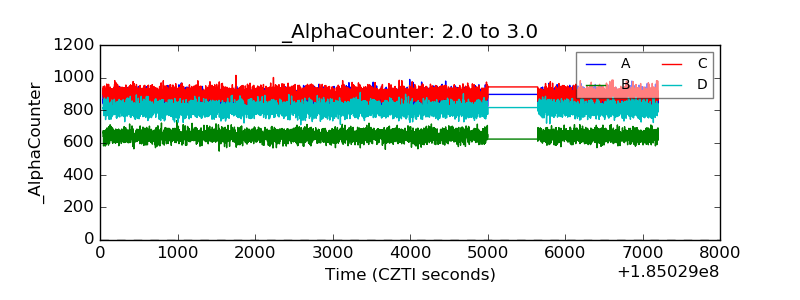 |
| _CPM_Rate | 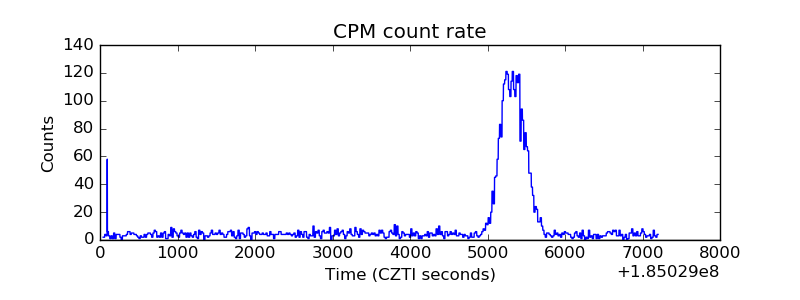 |
| CZT Counter | 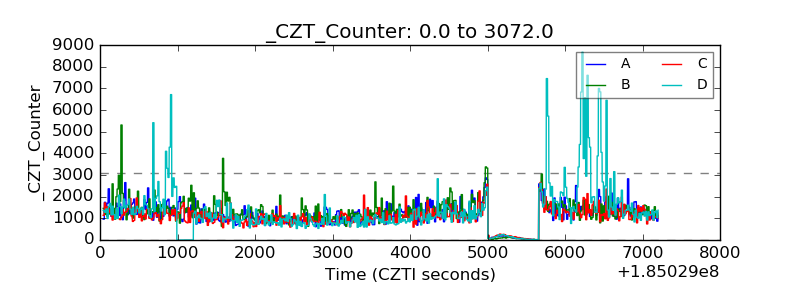 |
| +2.5 Volts monitor |  |
| +5 Volts monitor |  |
| _ROLL_ROT | 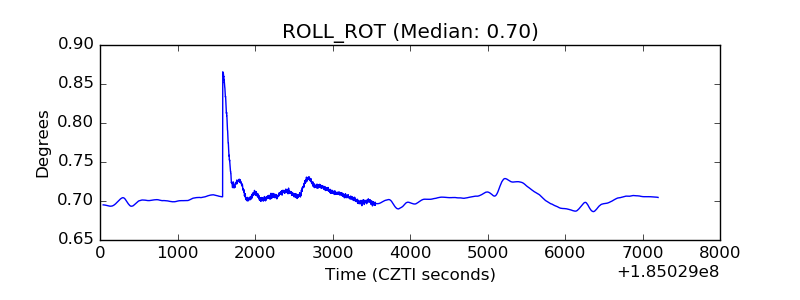 |
| _Roll_DEC | 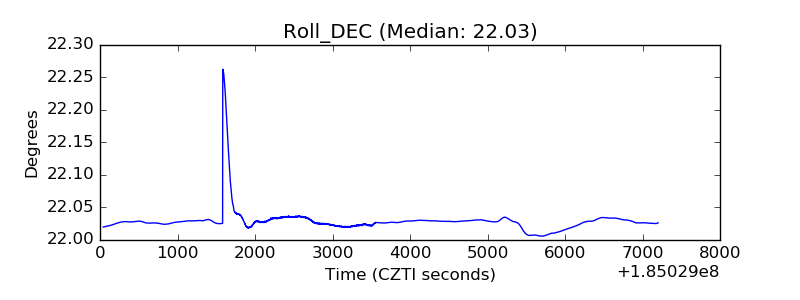 |
| _Roll_RA | 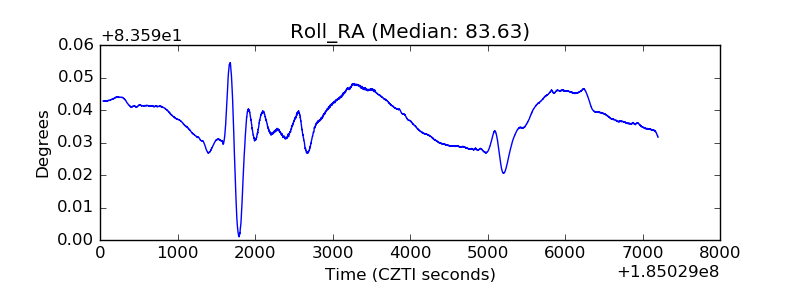 |
| Veto Counter | 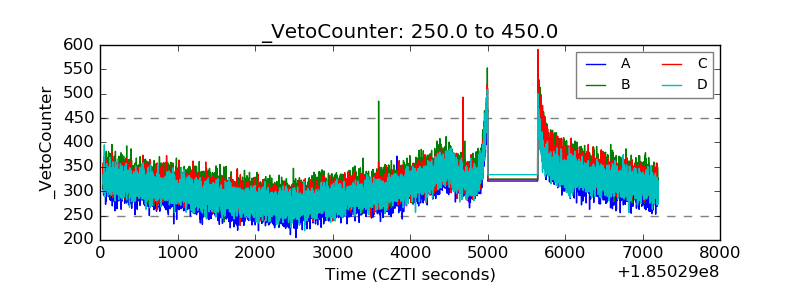 |