| Param | Original file | Final file |
|---|---|---|
| Filename | modeM0/AS1P01_141T01_9000000096_00674cztM0_level2.evt | modeM0/AS1P01_141T01_9000000096_00674cztM0_level2_quad_clean.evt |
| Size (bytes) | 2,020,792,320 | 138,147,840 |
| Size | 1.9 GB | 131.7 MB |
| Events in quadrant A | 14,896,954 | 849,520 |
| Events in quadrant B | 14,985,565 | 860,216 |
| Events in quadrant C | 13,849,078 | 861,868 |
| Events in quadrant D | 16,677,972 | 783,597 |
| Mode M9 | |||
|---|---|---|---|
| Quadrant | BADHDUFLAG | Total packets | Discarded packets |
| A | 0 | 27 | 10 |
| B | 0 | 27 | 10 |
| C | 0 | 27 | 10 |
| D | 0 | 27 | 10 |
| Mode M0 | |||
|---|---|---|---|
| Quadrant | BADHDUFLAG | Total packets | Discarded packets |
| A | 0 | 80675 | 27700 |
| B | 0 | 80925 | 27741 |
| C | 0 | 76091 | 26250 |
| D | 0 | 88853 | 30443 |
| Mode SS | |||
|---|---|---|---|
| Quadrant | BADHDUFLAG | Total packets | Discarded packets |
| A | 0 | 376 | 130 |
| B | 0 | 376 | 130 |
| C | 0 | 376 | 130 |
| D | 0 | 376 | 130 |
| Quadrant | Total seconds | Saturated seconds | Saturation percentage |
|---|---|---|---|
| A | 11978 | 63 | 0.525964% |
| B | 12029 | 43 | 0.357469% |
| C | 12071 | 17 | 0.140833% |
| D | 11856 | 824 | 6.950067% |
Noise dominated data is calculated using 1-second bins in cleaned event files. If a bin has >2000 counts, and if more than 50% of those come from <1% of pixels, then it is considered to be noise-dominated and hence unusable.
| Quadrant | # 1 sec bins | Bins with >0 counts | Bins with >2000 counts | High rate bins dominated by noise | Noise dominated (total time) | Noise dominated (detector-on time) | Marked lightcurve |
|---|---|---|---|---|---|---|---|
| A | 13943 | 11983 | 616 | 616 | 4.42% | 5.14% | 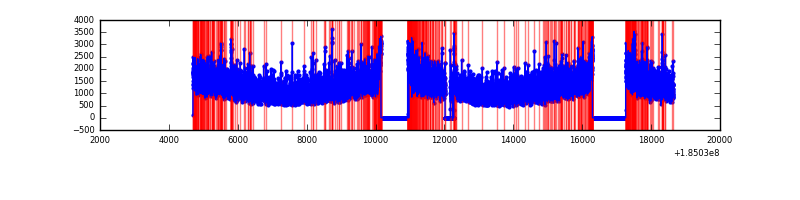 |
| B | 13943 | 12033 | 446 | 446 | 3.20% | 3.71% |  |
| C | 13943 | 12075 | 266 | 266 | 1.91% | 2.20% | 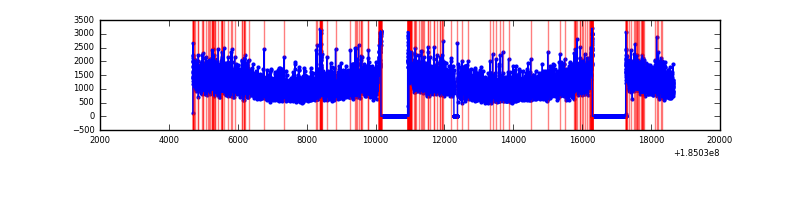 |
| D | 13943 | 11862 | 1872 | 1872 | 13.43% | 15.78% | 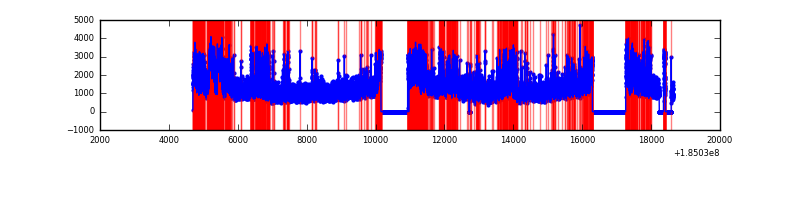 |
Top three noisy pixels from each quadrant. If the there are fewer than three noisy pixels in the level2.evt file, extra rows are filled as -1
| Pixel properties | Quadrant properties | ||||||
|---|---|---|---|---|---|---|---|
| Quadrant | DetID | PixID | Counts | Sigma | Mean | Median | Sigma |
| A | 15 | 17 | 87065 | 98.24 | 3793 | 3760 | 847.9 |
| A | 13 | 17 | 46054 | 49.88 | 3793 | 3760 | 847.9 |
| A | 14 | 79 | 41022 | 43.94 | 3793 | 3760 | 847.9 |
| B | 0 | 220 | 232471 | 251.9 | 3826 | 3853 | 907.6 |
| B | 5 | 191 | 63015 | 65.19 | 3826 | 3853 | 907.6 |
| B | 0 | 230 | 39769 | 39.57 | 3826 | 3853 | 907.6 |
| C | 2 | 192 | 52333 | 49.72 | 3500 | 3636 | 979.4 |
| C | 9 | 52 | 48390 | 45.69 | 3500 | 3636 | 979.4 |
| C | 15 | 241 | 24675 | 21.48 | 3500 | 3636 | 979.4 |
| D | 12 | 237 | 3133672 | 3079.71 | 3244 | 3377 | 1016.4 |
| D | 1 | 4 | 601972 | 588.92 | 3244 | 3377 | 1016.4 |
| D | 13 | 221 | 209659 | 202.95 | 3244 | 3377 | 1016.4 |
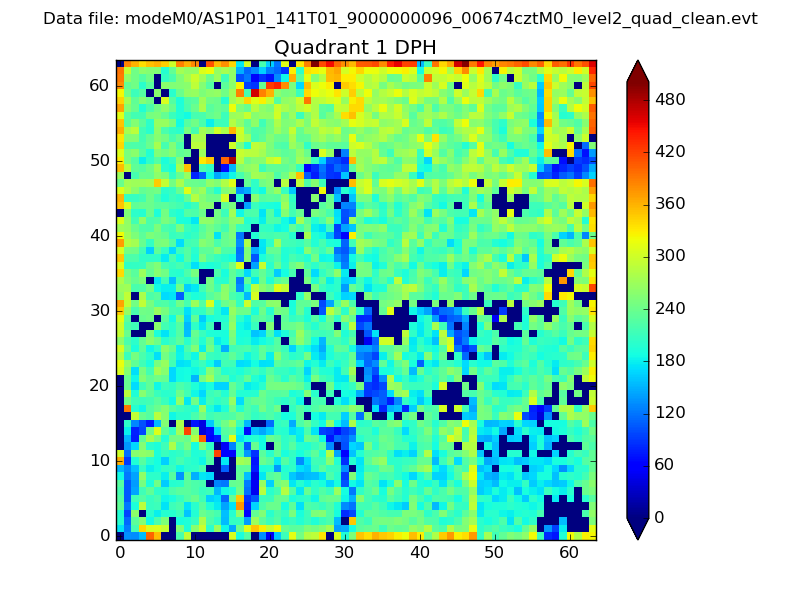
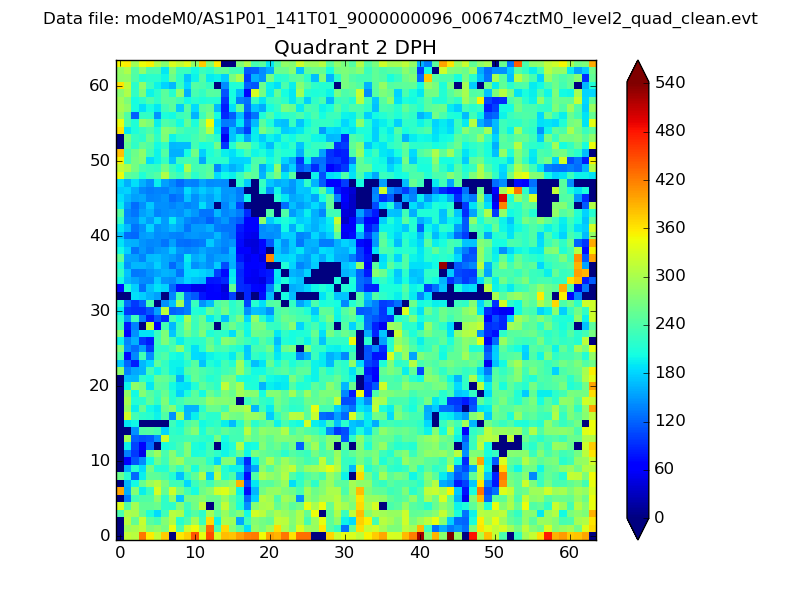
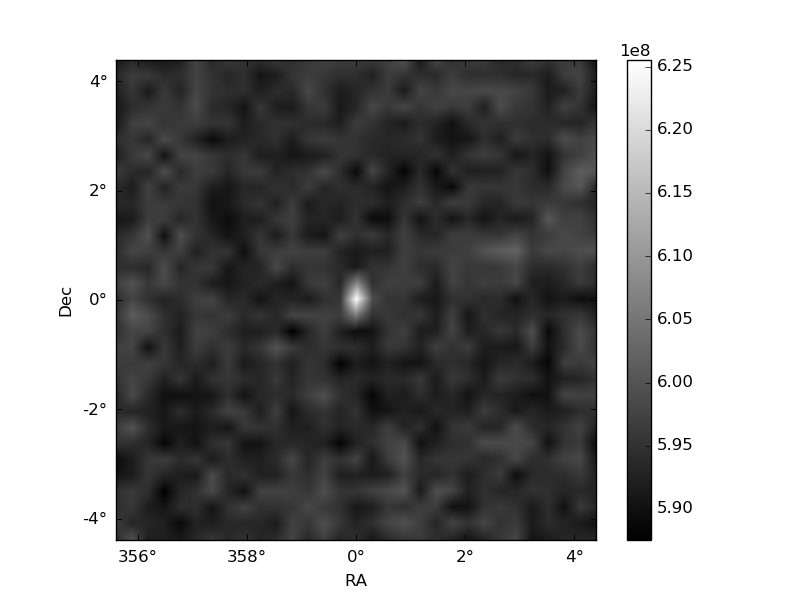
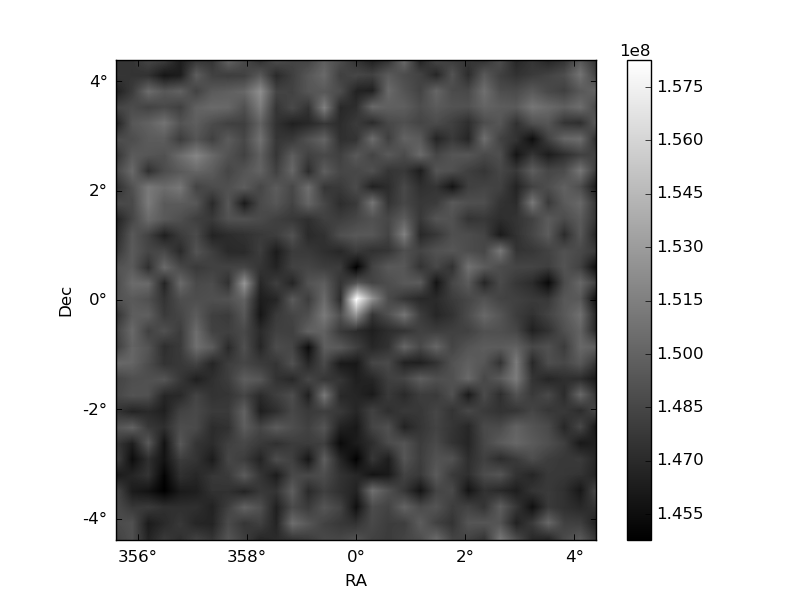
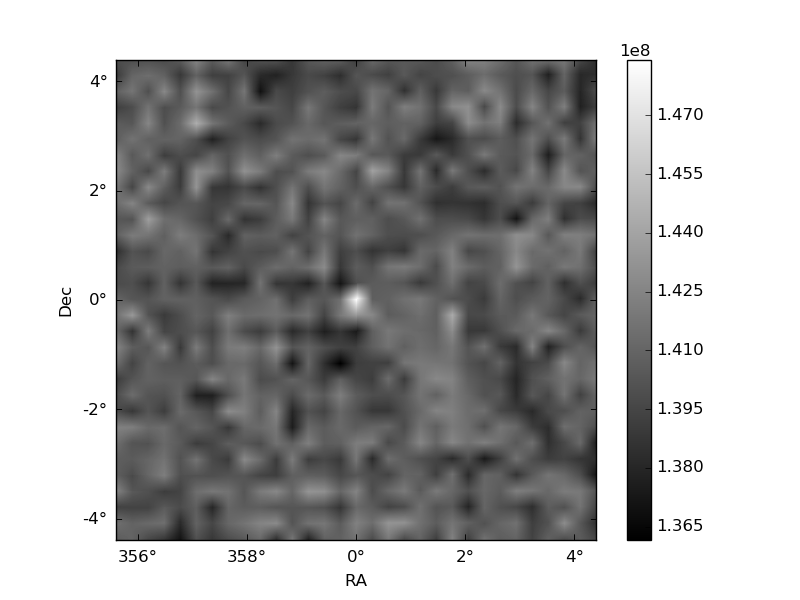
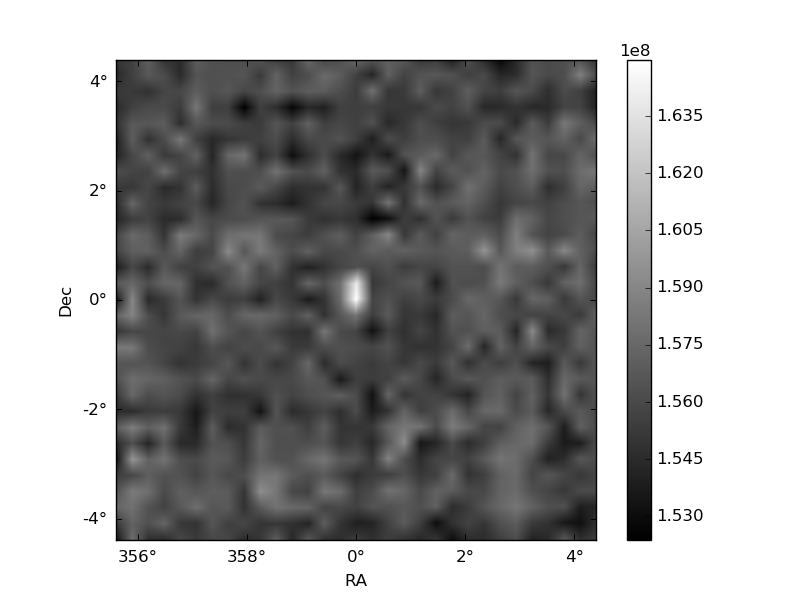
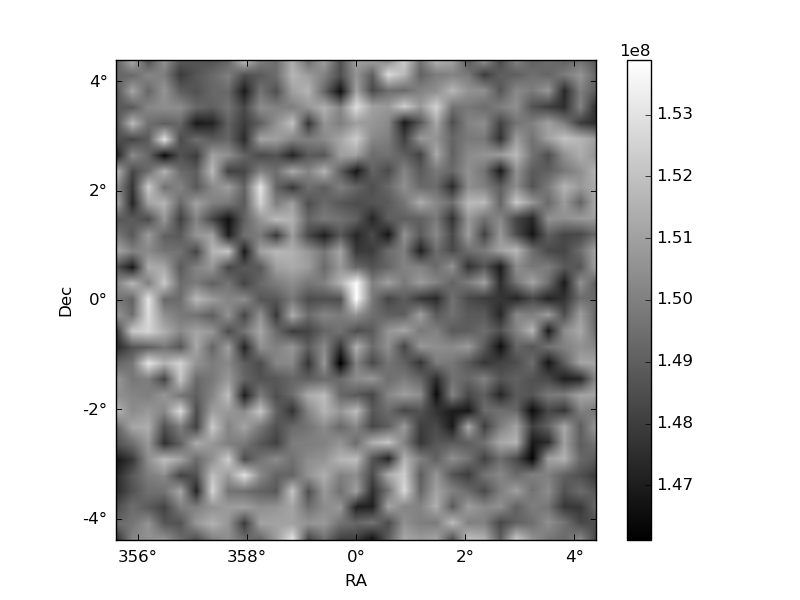
Histogram calculated using DETX and DETY for each event in the final _common_clean file
| Quadrant A | 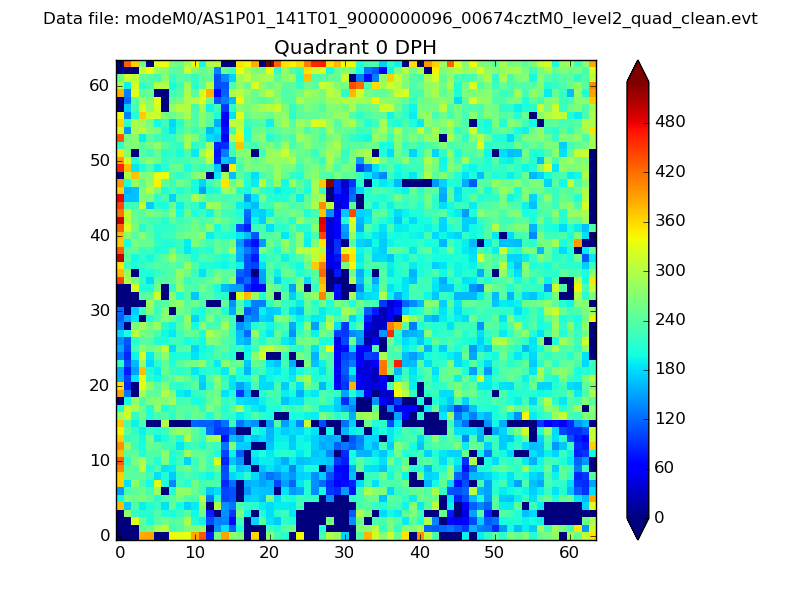 |
 |
Quadrant B |
|---|---|---|---|
| Quadrant D | 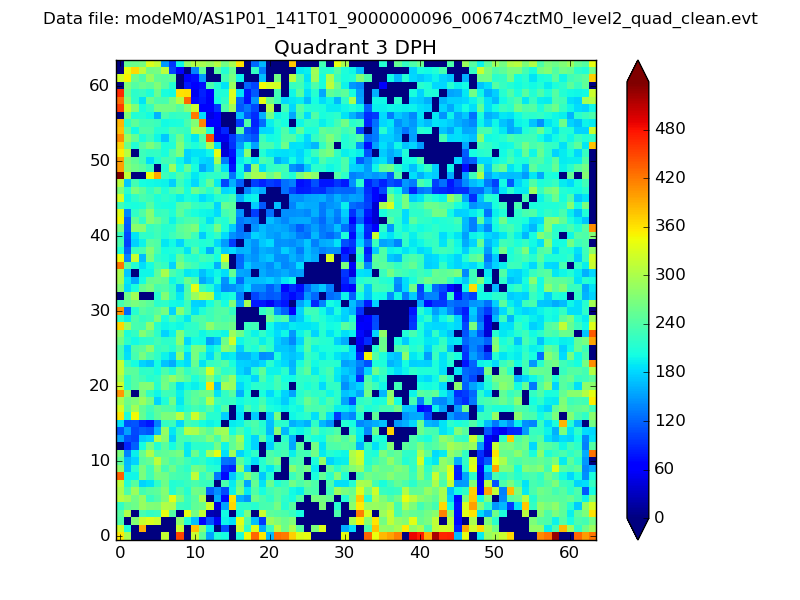 |
 |
Quadrant C |
| Plot type | Count rate plots | Images |
|---|---|---|
| Comparison with Poisson distribution Blue bars denote a histogram of data divided into 1 sec bins. Red curve is a Poisson curve with rate = median count rate of data. |
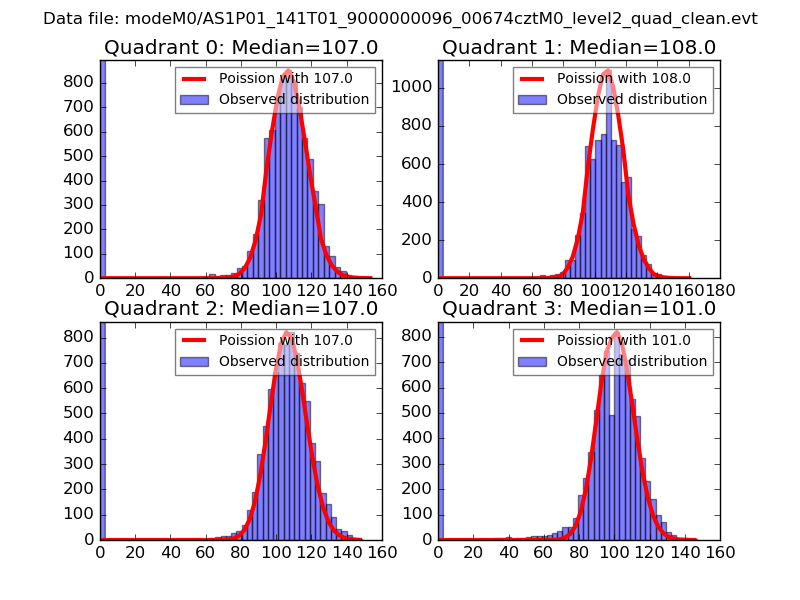 |
 |
| Quadrant-wise count rates Data is divided into 100 sec bins |
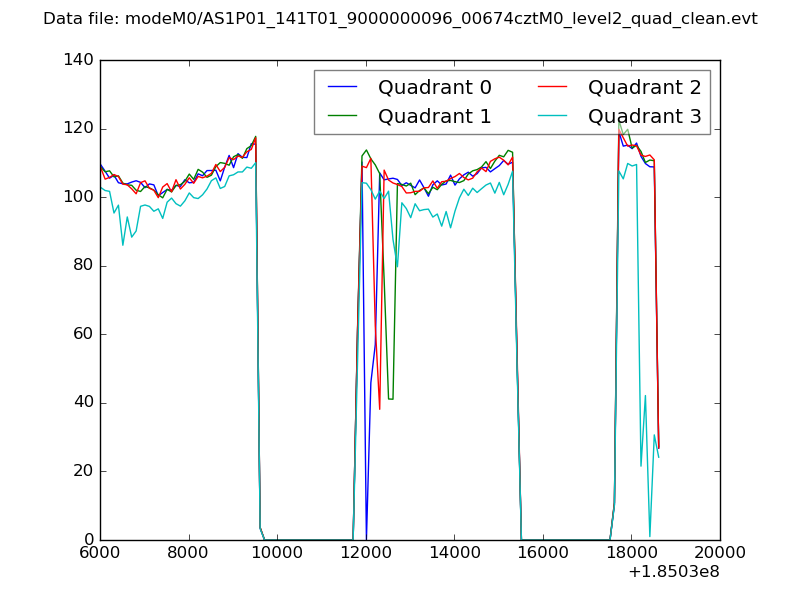 |
|
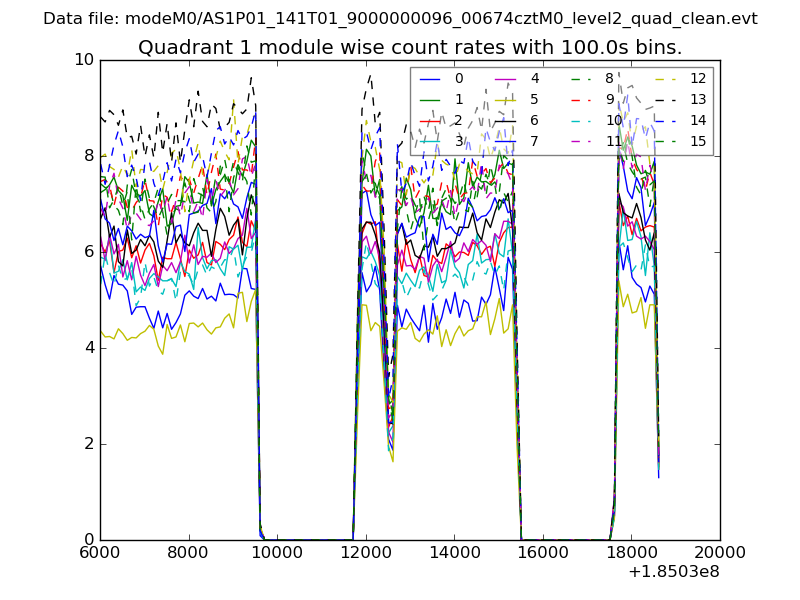
| Module-wise count rates for Quadrant A Data is divided into 100 sec bins |
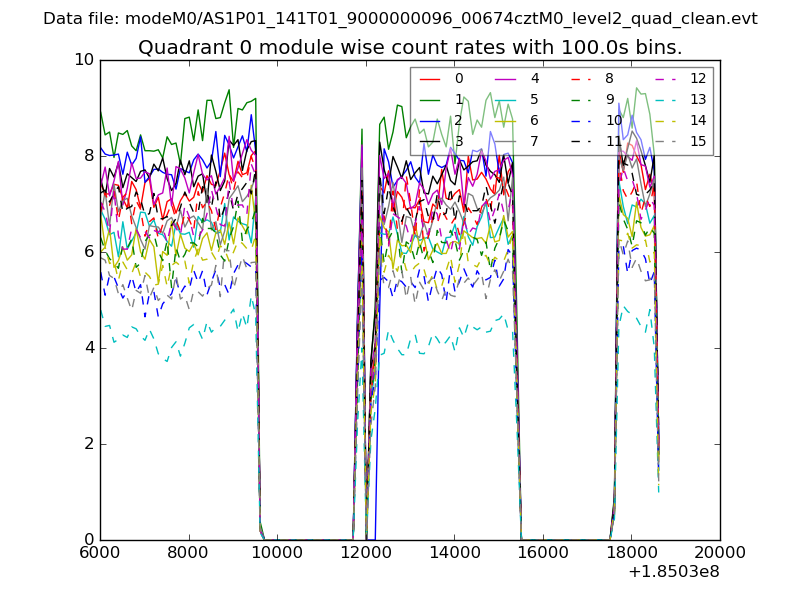 |
 |
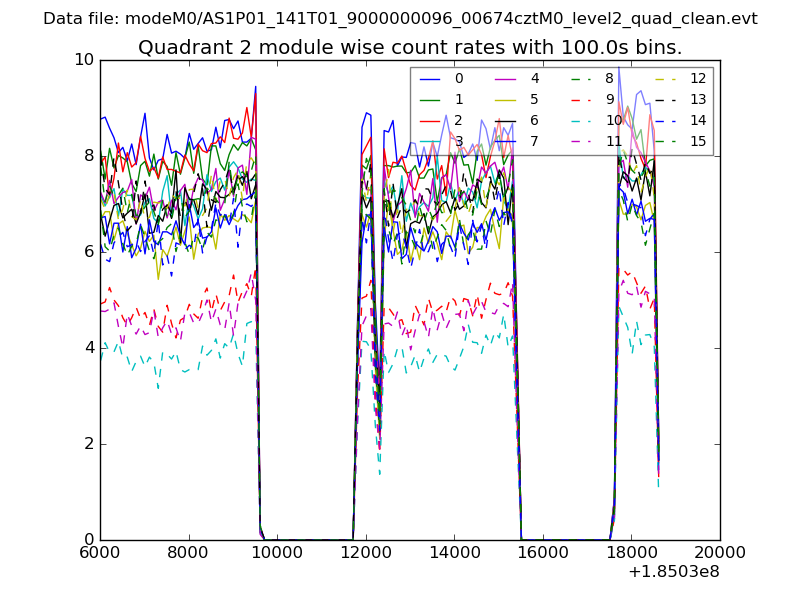
| Module-wise count rates for Quadrant B Data is divided into 100 sec bins |
 |
 |
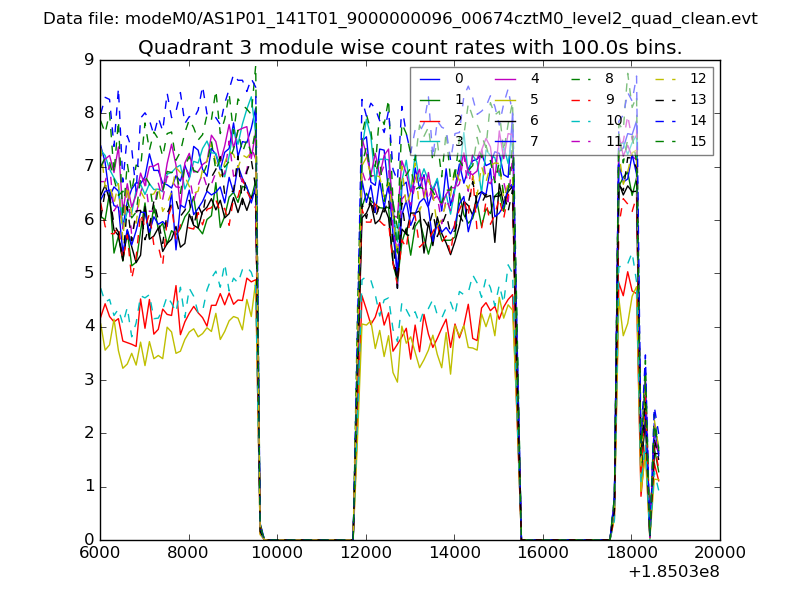
| Module-wise count rates for Quadrant C Data is divided into 100 sec bins |
 |
 |
| Module-wise count rates for Quadrant D Data is divided into 100 sec bins |
 |
 |
| Parameter | Plot |
|---|---|
| CZT HV Monitor | 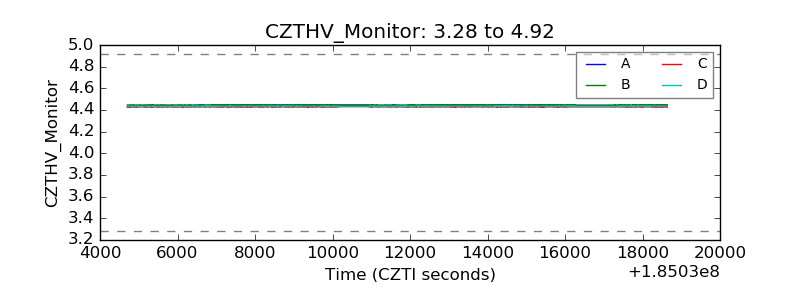 |
| D_VDD |  |
| Temperature 1 | 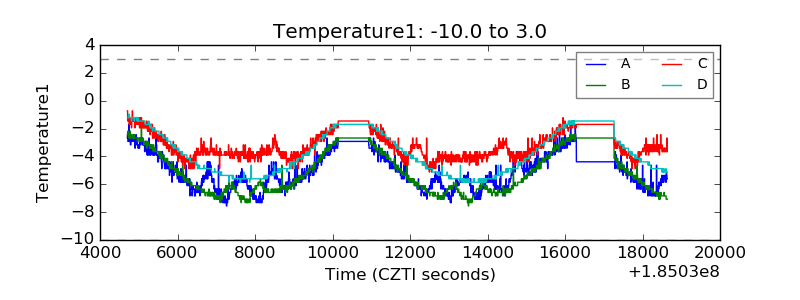 |
| Veto HV Monitor | 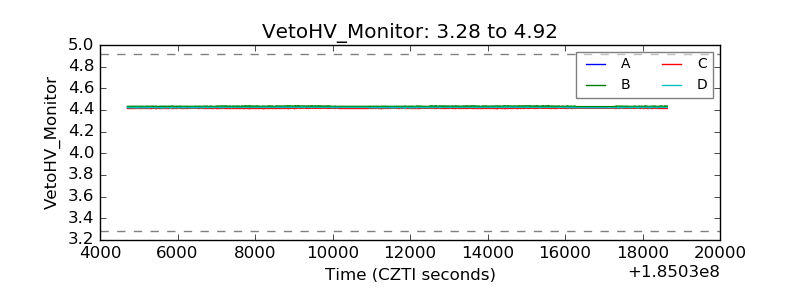 |
| Veto LLD | 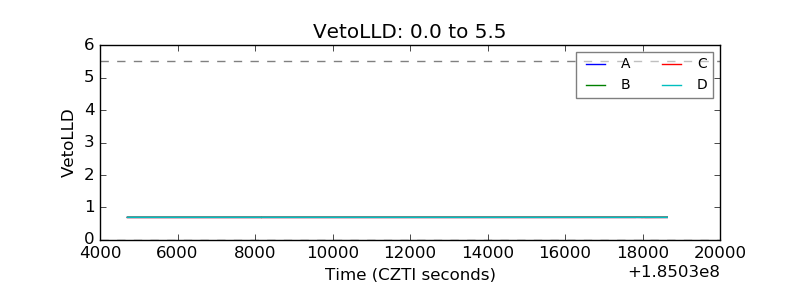 |
| Alpha Counter | 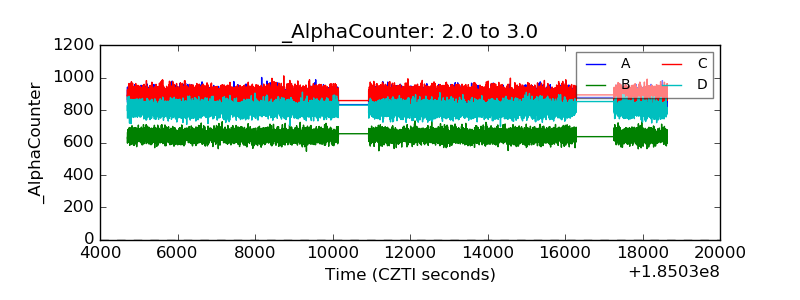 |
| _CPM_Rate | 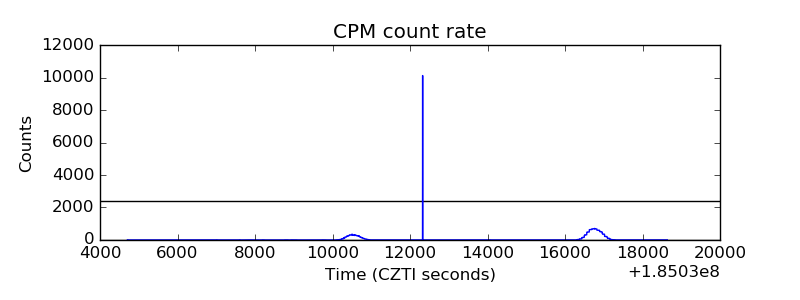 |
| CZT Counter | 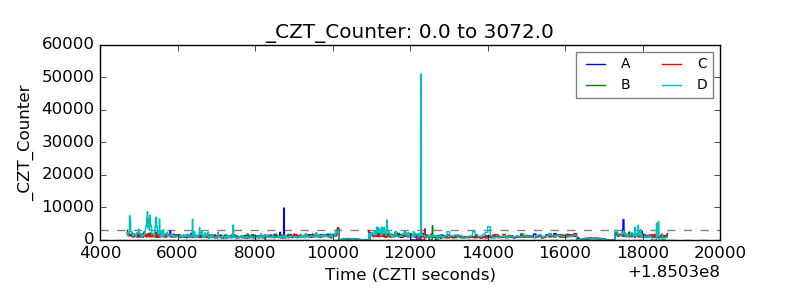 |
| +2.5 Volts monitor |  |
| +5 Volts monitor |  |
| _ROLL_ROT | 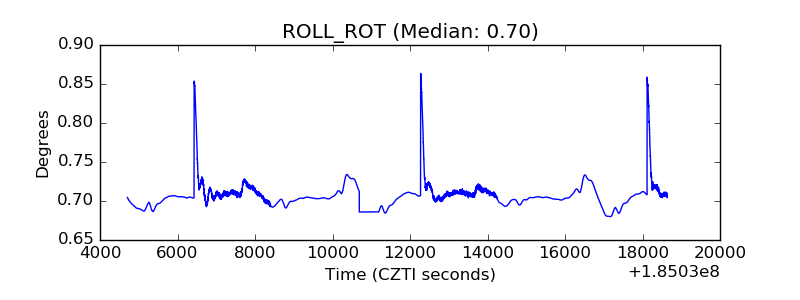 |
| _Roll_DEC | 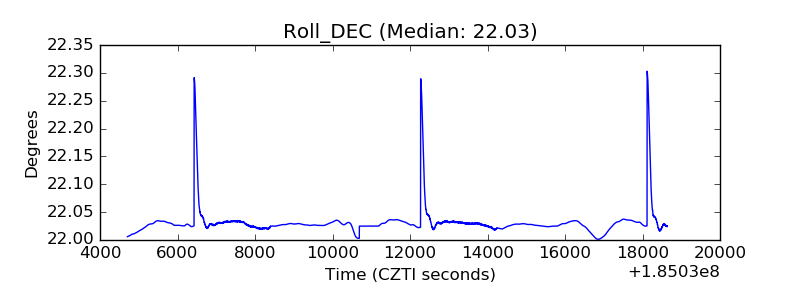 |
| _Roll_RA | 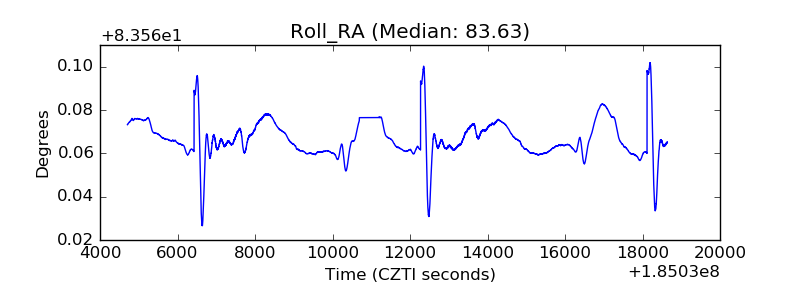 |
| Veto Counter | 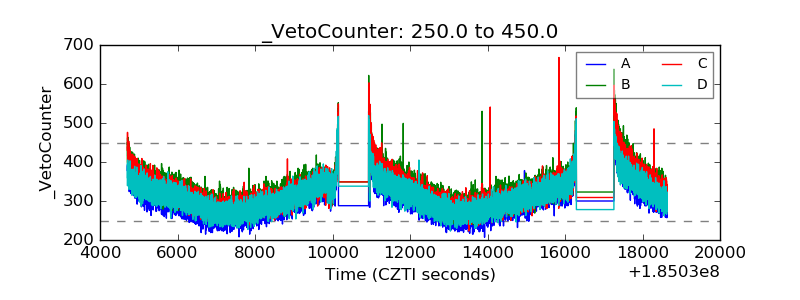 |