| Param | Original file | Final file |
|---|---|---|
| Filename | modeM0/AS1P01_141T01_9000000096_00678cztM0_level2.evt | modeM0/AS1P01_141T01_9000000096_00678cztM0_level2_quad_clean.evt |
| Size (bytes) | 918,273,600 | 80,879,040 |
| Size | 875.7 MB | 77.1 MB |
| Events in quadrant A | 7,042,378 | 512,940 |
| Events in quadrant B | 7,447,634 | 518,038 |
| Events in quadrant C | 6,652,386 | 512,758 |
| Events in quadrant D | 6,269,800 | 487,438 |
| Mode M9 | |||
|---|---|---|---|
| Quadrant | BADHDUFLAG | Total packets | Discarded packets |
| A | 0 | 12 | 0 |
| B | 0 | 12 | 0 |
| C | 0 | 12 | 0 |
| D | 0 | 12 | 0 |
| Mode M0 | |||
|---|---|---|---|
| Quadrant | BADHDUFLAG | Total packets | Discarded packets |
| A | 0 | 25202 | 1 |
| B | 0 | 26386 | 1 |
| C | 0 | 24036 | 1 |
| D | 0 | 22878 | 1 |
| Mode SS | |||
|---|---|---|---|
| Quadrant | BADHDUFLAG | Total packets | Discarded packets |
| A | 0 | 122 | 0 |
| B | 0 | 122 | 0 |
| C | 0 | 122 | 0 |
| D | 0 | 122 | 0 |
| Quadrant | Total seconds | Saturated seconds | Saturation percentage |
|---|---|---|---|
| A | 5983 | 6 | 0.100284% |
| B | 5983 | 57 | 0.952699% |
| C | 5983 | 6 | 0.100284% |
| D | 5983 | 45 | 0.752131% |
Noise dominated data is calculated using 1-second bins in cleaned event files. If a bin has >2000 counts, and if more than 50% of those come from <1% of pixels, then it is considered to be noise-dominated and hence unusable.
| Quadrant | # 1 sec bins | Bins with >0 counts | Bins with >2000 counts | High rate bins dominated by noise | Noise dominated (total time) | Noise dominated (detector-on time) | Marked lightcurve |
|---|---|---|---|---|---|---|---|
| A | 7148 | 5984 | 182 | 182 | 2.55% | 3.04% | 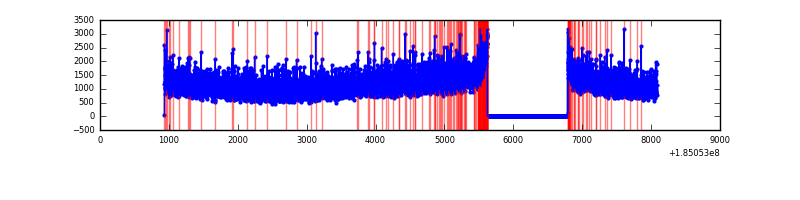 |
| B | 7148 | 5984 | 312 | 312 | 4.36% | 5.21% | 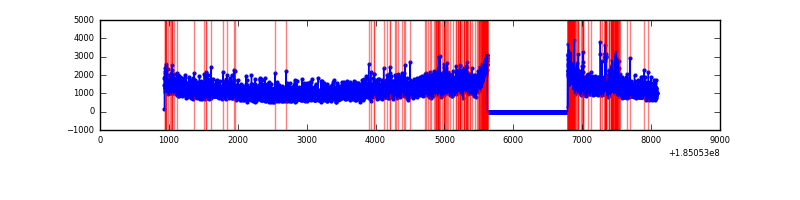 |
| C | 7148 | 5984 | 120 | 120 | 1.68% | 2.01% |  |
| D | 7148 | 5984 | 174 | 174 | 2.43% | 2.91% | 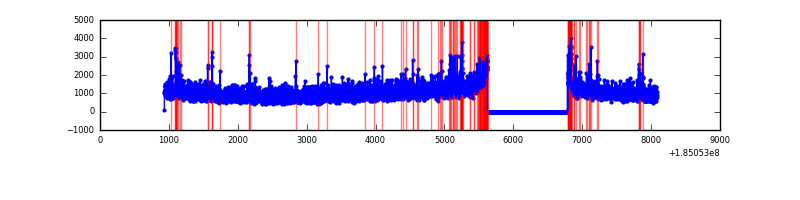 |
Top three noisy pixels from each quadrant. If the there are fewer than three noisy pixels in the level2.evt file, extra rows are filled as -1
| Pixel properties | Quadrant properties | ||||||
|---|---|---|---|---|---|---|---|
| Quadrant | DetID | PixID | Counts | Sigma | Mean | Median | Sigma |
| A | 3 | 111 | 5518 | 9.2 | 1836 | 1819 | 402.1 |
| A | 15 | 69 | 4706 | 7.18 | 1836 | 1819 | 402.1 |
| A | 14 | 203 | 4649 | 7.04 | 1836 | 1819 | 402.1 |
| B | 8 | 4 | 166324 | 383.84 | 1847 | 1857 | 428.5 |
| B | 0 | 220 | 129753 | 298.49 | 1847 | 1857 | 428.5 |
| B | 7 | 221 | 113352 | 260.21 | 1847 | 1857 | 428.5 |
| C | 15 | 241 | 43970 | 90.4 | 1685 | 1748 | 467.1 |
| C | 9 | 52 | 10464 | 18.66 | 1685 | 1748 | 467.1 |
| C | 5 | 254 | 6009 | 9.12 | 1685 | 1748 | 467.1 |
| D | 1 | 4 | 216853 | 438.12 | 1601 | 1654 | 491.2 |
| D | 12 | 233 | 29148 | 55.97 | 1601 | 1654 | 491.2 |
| D | 2 | 53 | 26050 | 49.67 | 1601 | 1654 | 491.2 |
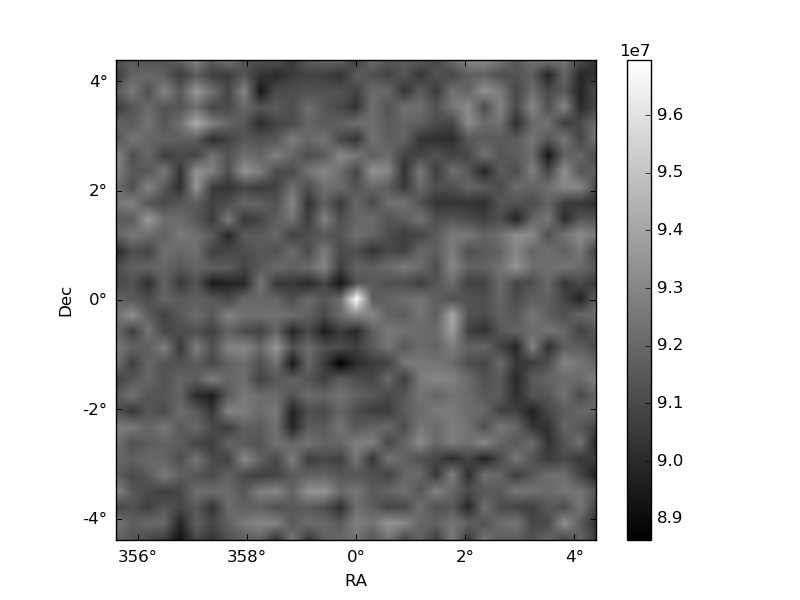
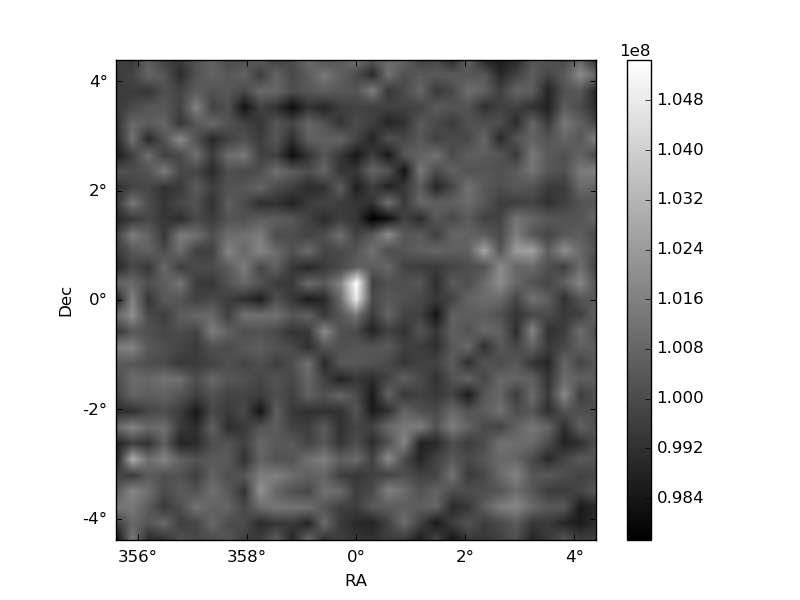
Histogram calculated using DETX and DETY for each event in the final _common_clean file
| Quadrant A | 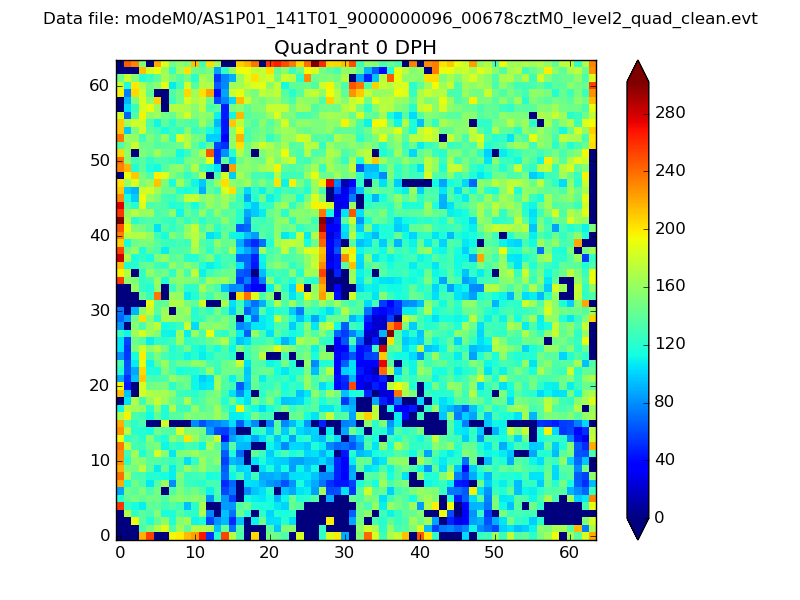 |
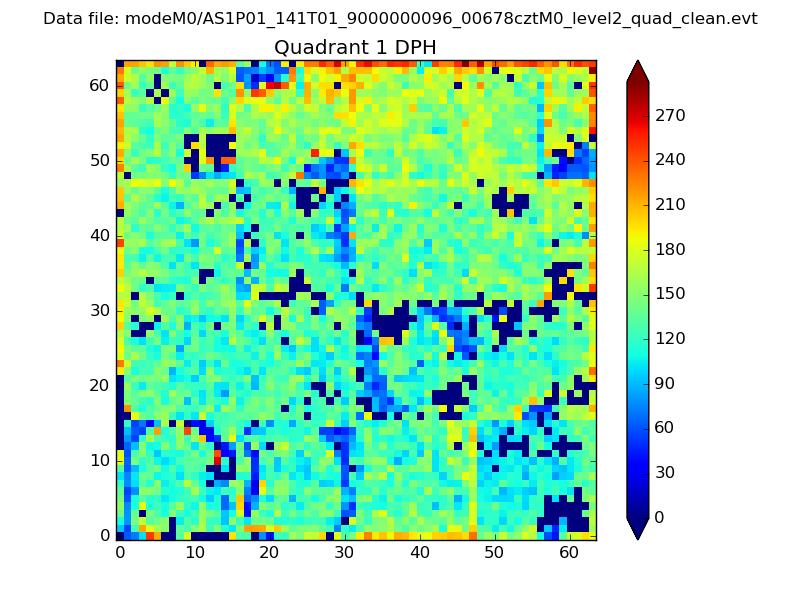 |
Quadrant B |
|---|---|---|---|
| Quadrant D | 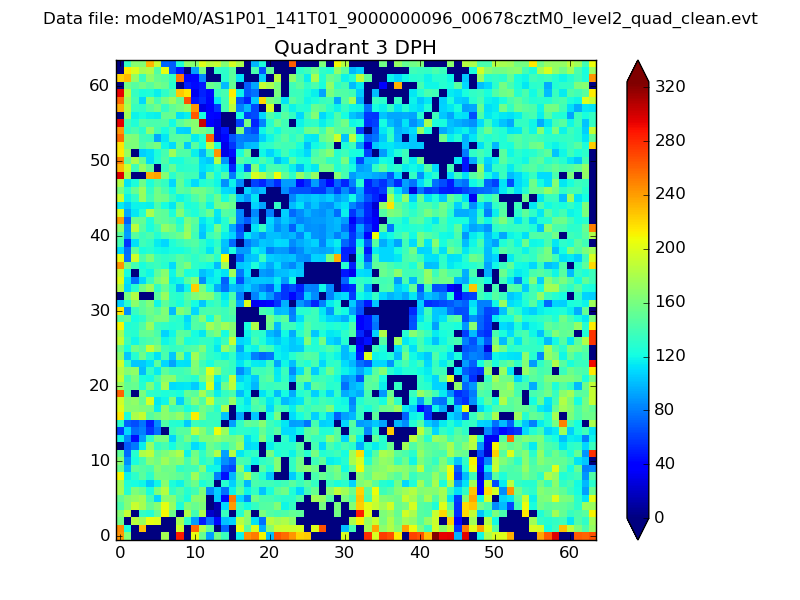 |
 |
Quadrant C |
| Plot type | Count rate plots | Images |
|---|---|---|
| Comparison with Poisson distribution Blue bars denote a histogram of data divided into 1 sec bins. Red curve is a Poisson curve with rate = median count rate of data. |
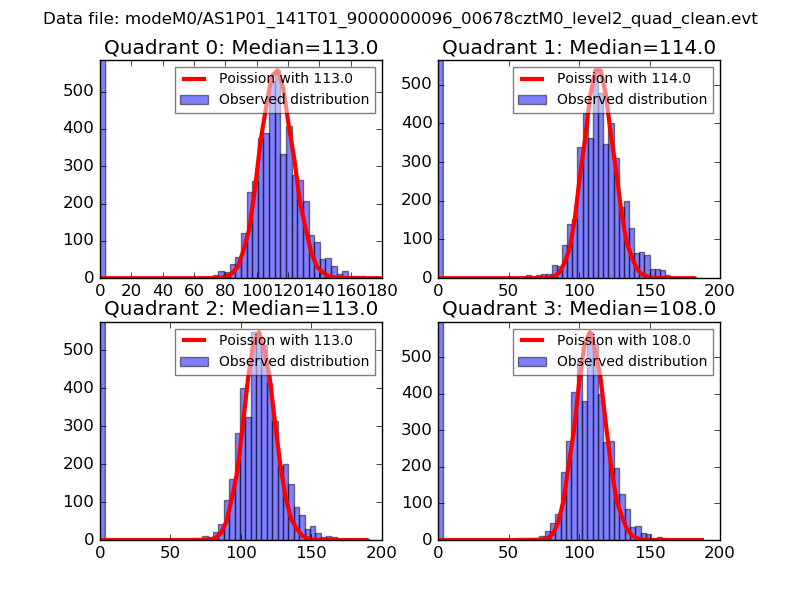 |
 |
| Quadrant-wise count rates Data is divided into 100 sec bins |
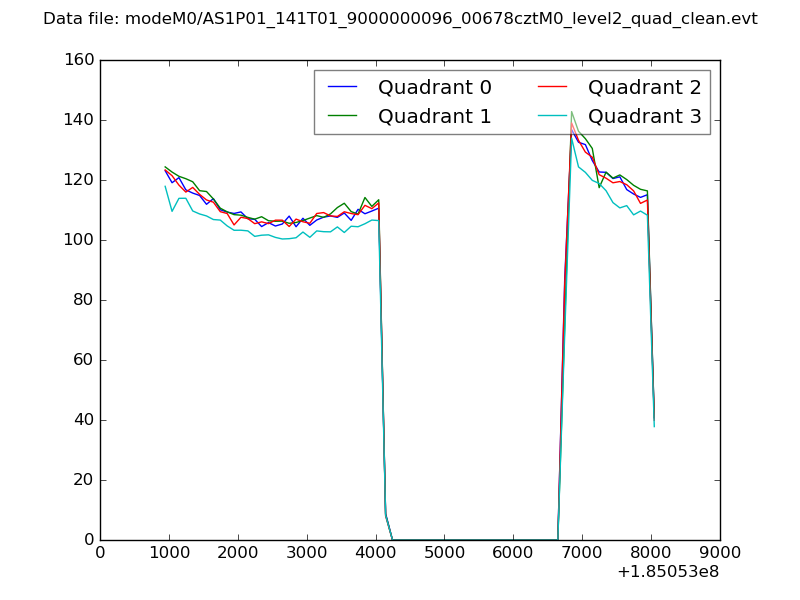 |
|
| Module-wise count rates for Quadrant A Data is divided into 100 sec bins |
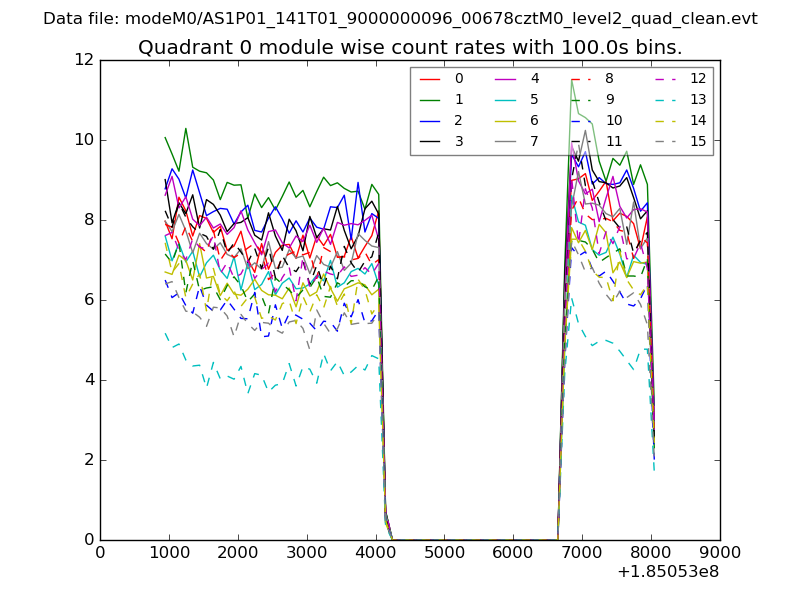 |
 |
| Module-wise count rates for Quadrant B Data is divided into 100 sec bins |
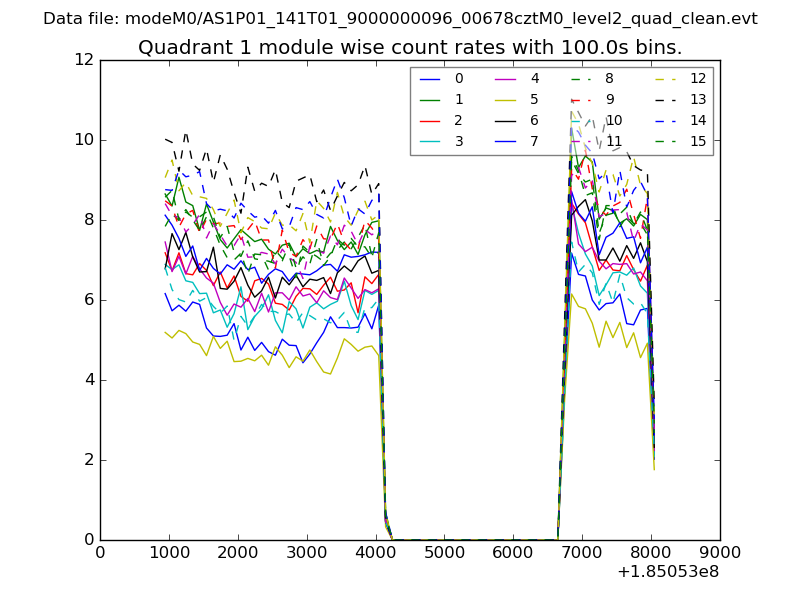 |
 |
| Module-wise count rates for Quadrant C Data is divided into 100 sec bins |
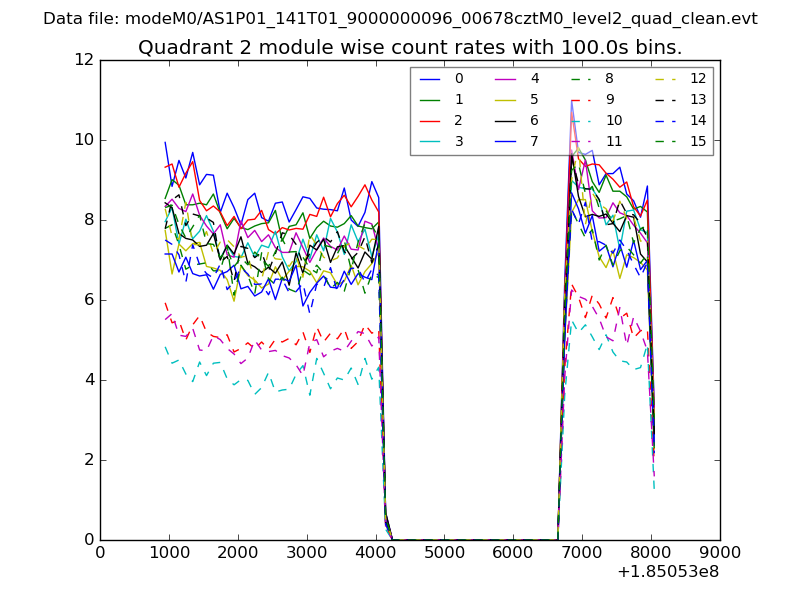 |
 |
| Module-wise count rates for Quadrant D Data is divided into 100 sec bins |
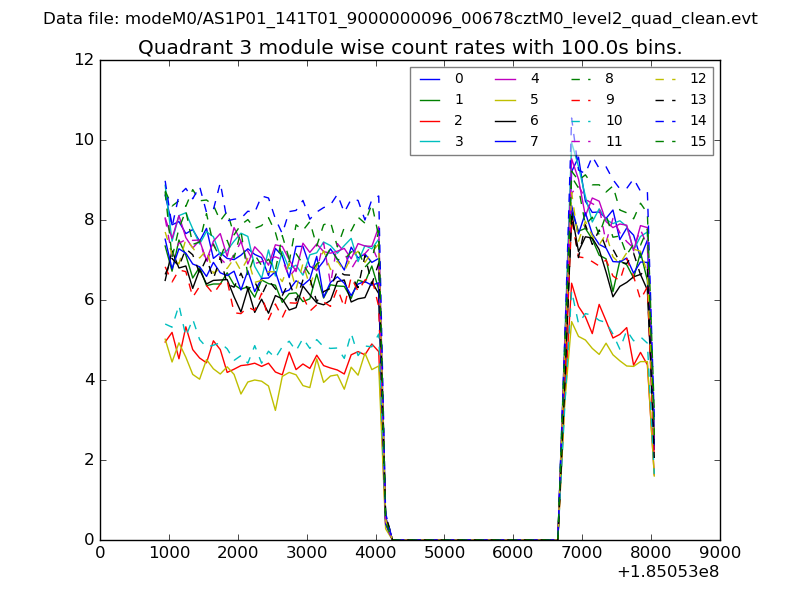 |
 |
| Parameter | Plot |
|---|---|
| CZT HV Monitor | 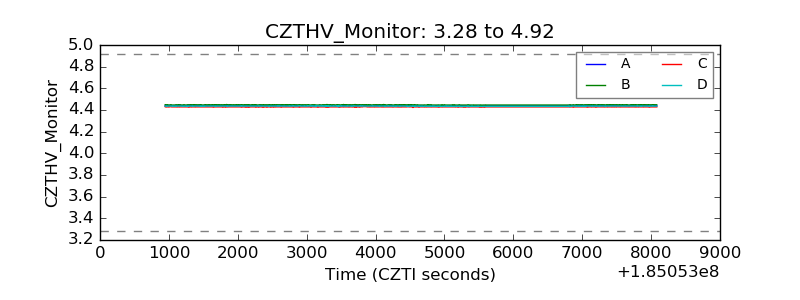 |
| D_VDD | 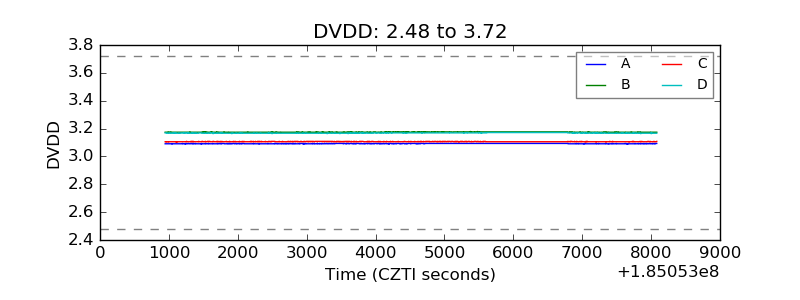 |
| Temperature 1 | 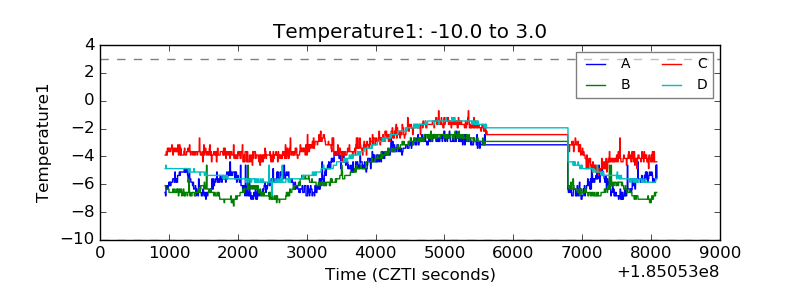 |
| Veto HV Monitor | 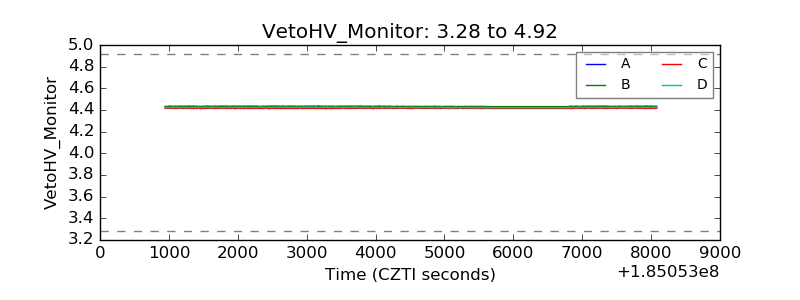 |
| Veto LLD | 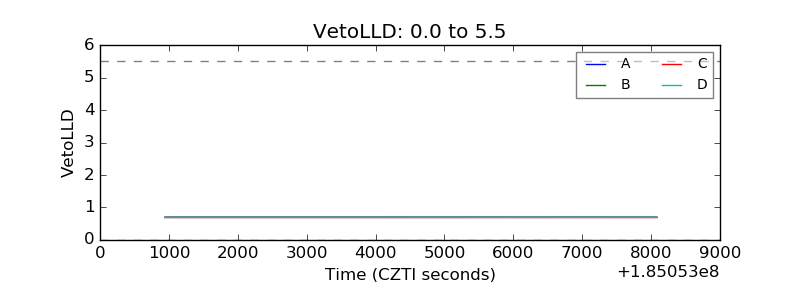 |
| Alpha Counter | 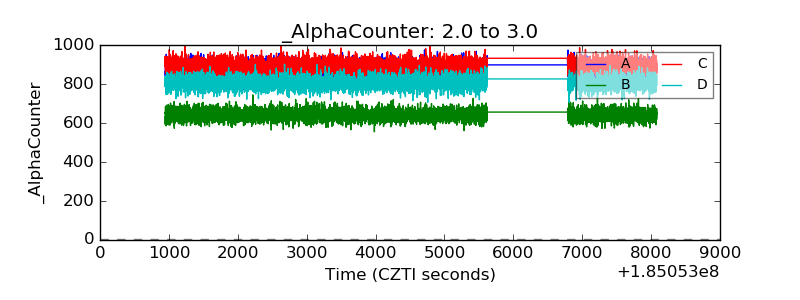 |
| _CPM_Rate | 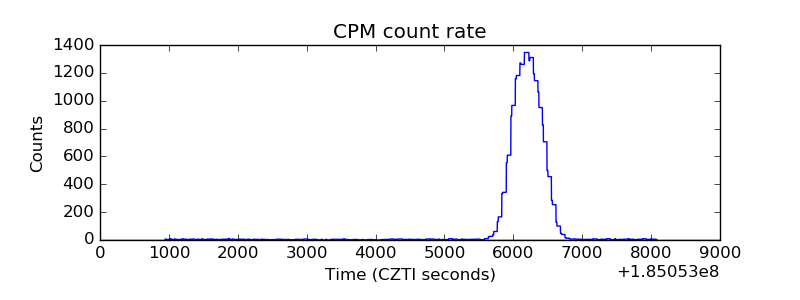 |
| CZT Counter |  |
| +2.5 Volts monitor | 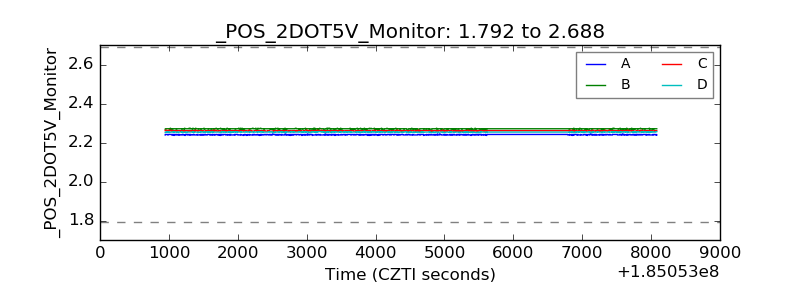 |
| +5 Volts monitor |  |
| _ROLL_ROT | 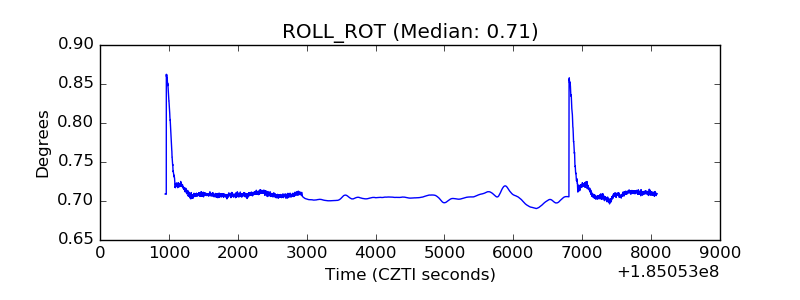 |
| _Roll_DEC | 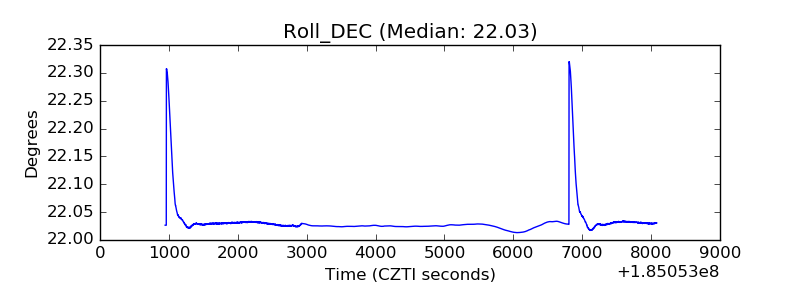 |
| _Roll_RA | 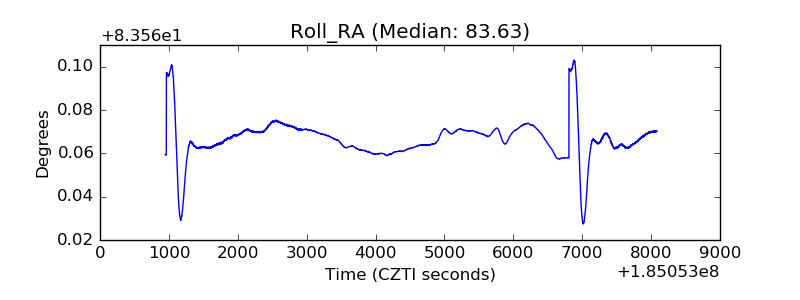 |
| Veto Counter | 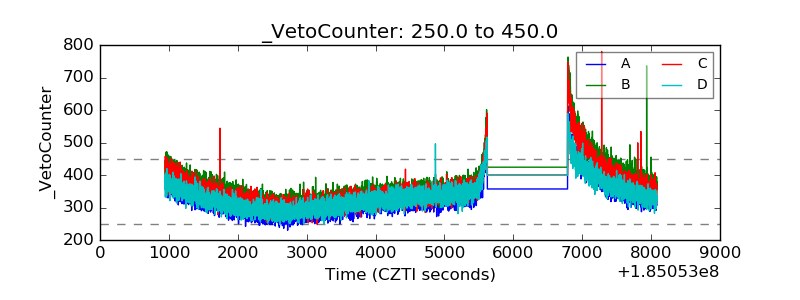 |