| Param | Original file | Final file |
|---|---|---|
| Filename | modeM0/AS1P01_141T01_9000000096_00680cztM0_level2.evt | modeM0/AS1P01_141T01_9000000096_00680cztM0_level2_quad_clean.evt |
| Size (bytes) | 978,128,640 | 75,548,160 |
| Size | 932.8 MB | 72.0 MB |
| Events in quadrant A | 7,461,195 | 469,235 |
| Events in quadrant B | 7,684,122 | 475,730 |
| Events in quadrant C | 7,523,069 | 460,454 |
| Events in quadrant D | 6,537,627 | 444,353 |
| Mode M9 | |||
|---|---|---|---|
| Quadrant | BADHDUFLAG | Total packets | Discarded packets |
| A | 0 | 24 | 12 |
| B | 0 | 24 | 12 |
| C | 0 | 24 | 12 |
| D | 0 | 24 | 12 |
| Mode M0 | |||
|---|---|---|---|
| Quadrant | BADHDUFLAG | Total packets | Discarded packets |
| A | 0 | 53298 | 26653 |
| B | 0 | 54576 | 27292 |
| C | 0 | 53746 | 26873 |
| D | 0 | 47829 | 23918 |
| Mode SS | |||
|---|---|---|---|
| Quadrant | BADHDUFLAG | Total packets | Discarded packets |
| A | 0 | 248 | 124 |
| B | 0 | 248 | 124 |
| C | 0 | 248 | 124 |
| D | 0 | 248 | 124 |
| Quadrant | Total seconds | Saturated seconds | Saturation percentage |
|---|---|---|---|
| A | 6277 | 14 | 0.223036% |
| B | 6277 | 10 | 0.159312% |
| C | 6278 | 251 | 3.998089% |
| D | 6278 | 26 | 0.414145% |
Noise dominated data is calculated using 1-second bins in cleaned event files. If a bin has >2000 counts, and if more than 50% of those come from <1% of pixels, then it is considered to be noise-dominated and hence unusable.
| Quadrant | # 1 sec bins | Bins with >0 counts | Bins with >2000 counts | High rate bins dominated by noise | Noise dominated (total time) | Noise dominated (detector-on time) | Marked lightcurve |
|---|---|---|---|---|---|---|---|
| A | 7478 | 6279 | 255 | 255 | 3.41% | 4.06% | 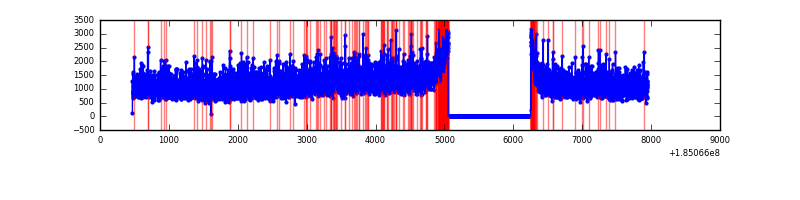 |
| B | 7478 | 6279 | 258 | 258 | 3.45% | 4.11% | 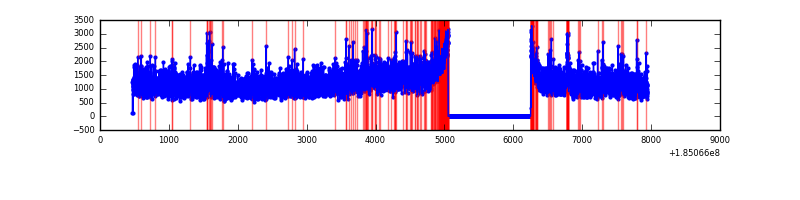 |
| C | 7478 | 6279 | 469 | 469 | 6.27% | 7.47% | 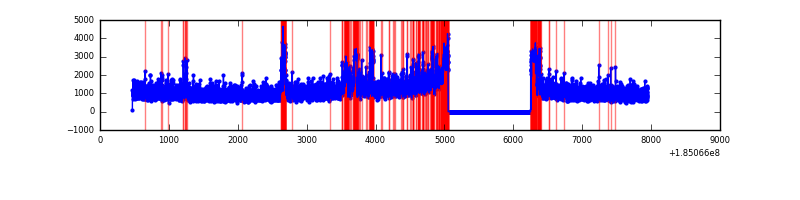 |
| D | 7479 | 6280 | 155 | 155 | 2.07% | 2.47% | 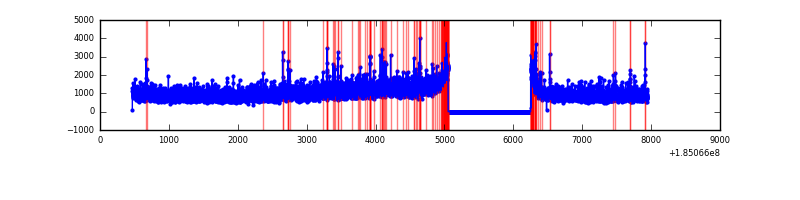 |
Top three noisy pixels from each quadrant. If the there are fewer than three noisy pixels in the level2.evt file, extra rows are filled as -1
| Pixel properties | Quadrant properties | ||||||
|---|---|---|---|---|---|---|---|
| Quadrant | DetID | PixID | Counts | Sigma | Mean | Median | Sigma |
| A | 15 | 17 | 19159 | 40.97 | 1942 | 1922 | 420.8 |
| A | 3 | 111 | 5639 | 8.83 | 1942 | 1922 | 420.8 |
| A | 14 | 203 | 4990 | 7.29 | 1942 | 1922 | 420.8 |
| B | 7 | 221 | 155109 | 338.53 | 1944 | 1954 | 452.4 |
| B | 0 | 220 | 86372 | 186.6 | 1944 | 1954 | 452.4 |
| B | 14 | 53 | 55255 | 117.82 | 1944 | 1954 | 452.4 |
| C | 9 | 52 | 830225 | 1751.87 | 1707 | 1774 | 472.9 |
| C | 15 | 241 | 17767 | 33.82 | 1707 | 1774 | 472.9 |
| C | -1 | -1 | -1 | -1.0 | 1707 | 1774 | 472.9 |
| D | 1 | 4 | 191782 | 369.88 | 1684 | 1745 | 513.8 |
| D | 12 | 22 | 47601 | 89.25 | 1684 | 1745 | 513.8 |
| D | 13 | 252 | 12896 | 21.7 | 1684 | 1745 | 513.8 |
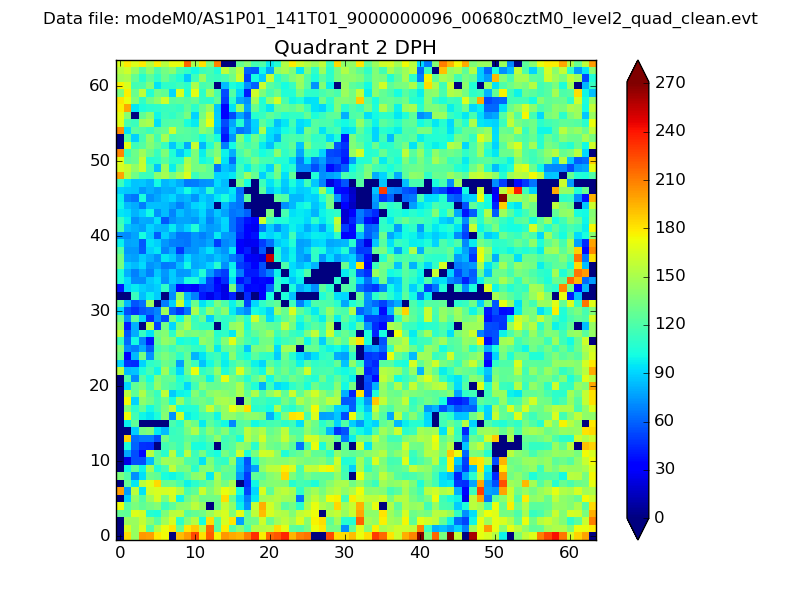
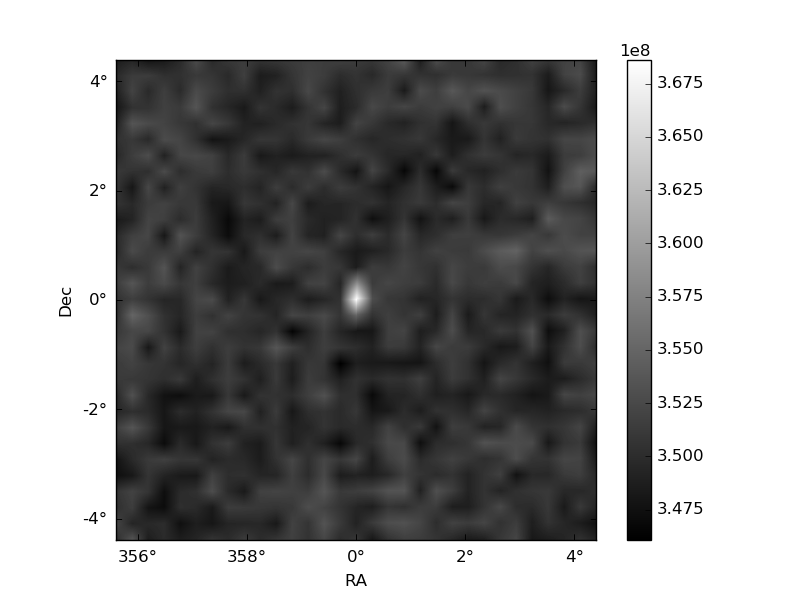
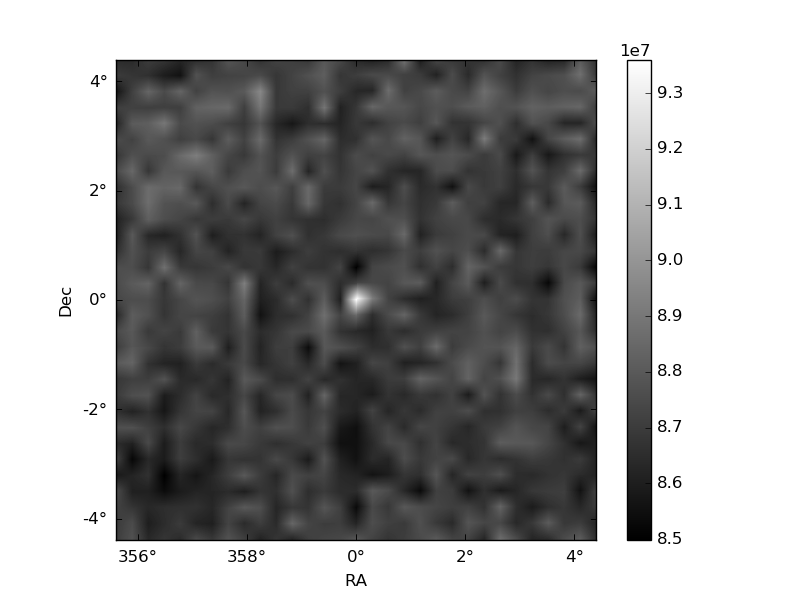
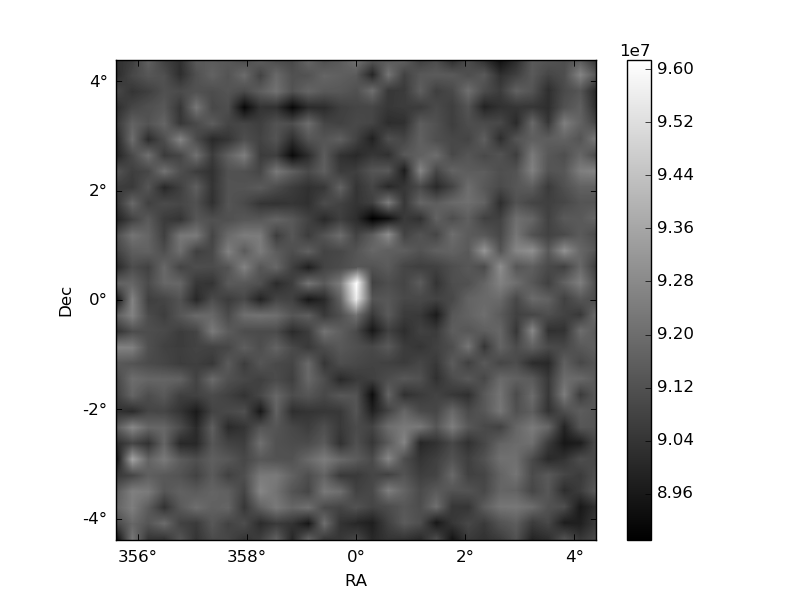
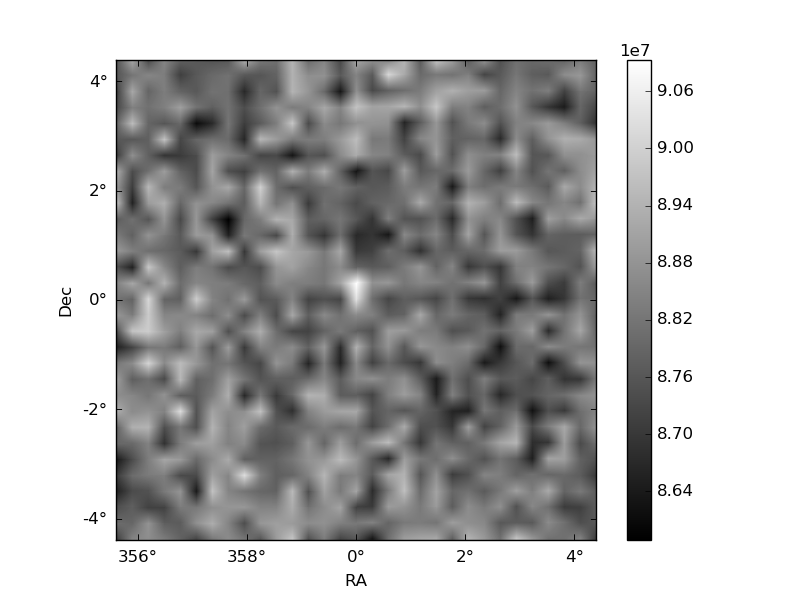
Histogram calculated using DETX and DETY for each event in the final _common_clean file
| Quadrant A | 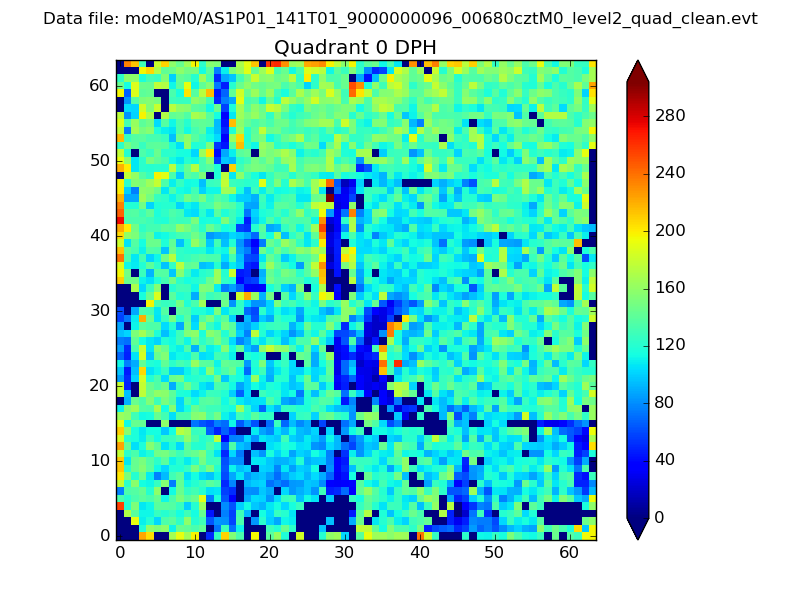 |
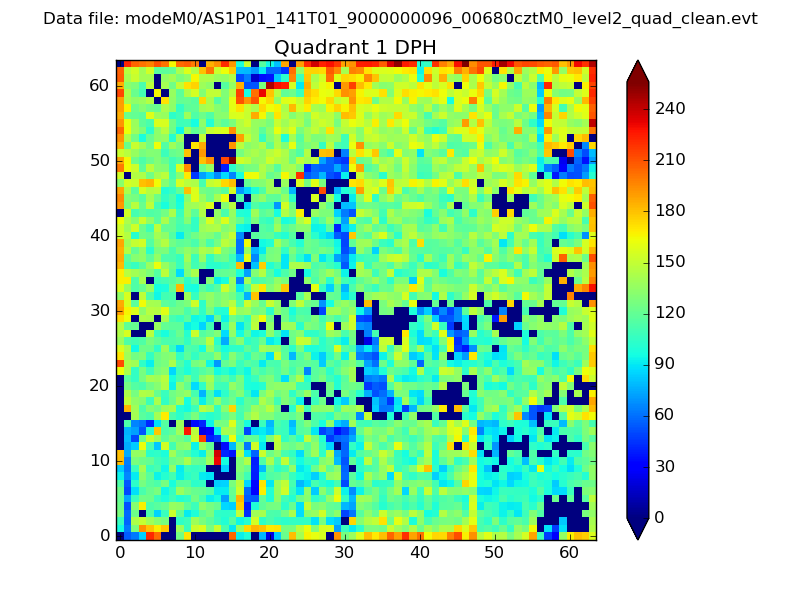 |
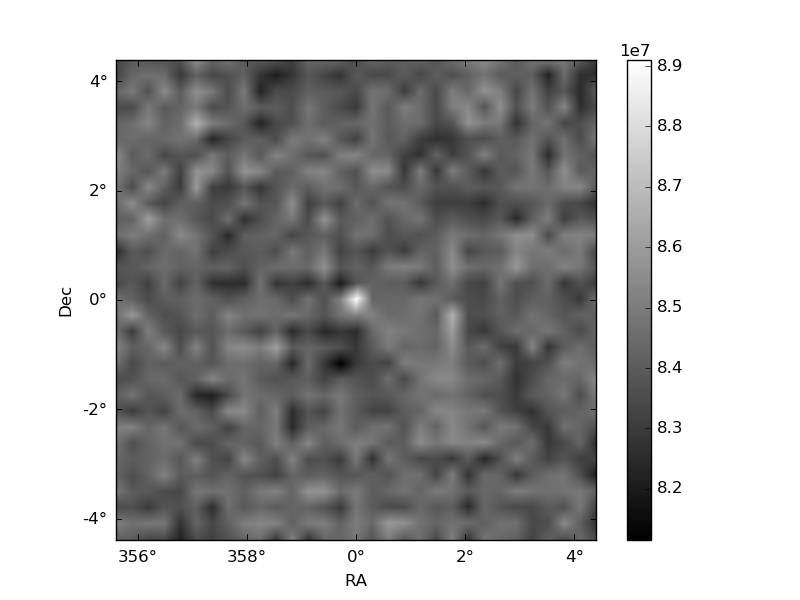
Quadrant B |
|---|---|---|---|
| Quadrant D | 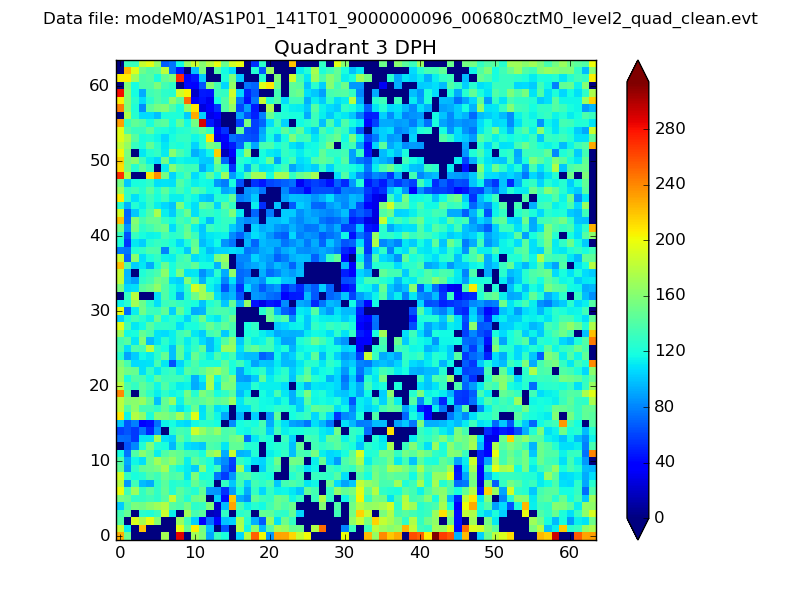 |
 |
Quadrant C |
| Plot type | Count rate plots | Images |
|---|---|---|
| Comparison with Poisson distribution Blue bars denote a histogram of data divided into 1 sec bins. Red curve is a Poisson curve with rate = median count rate of data. |
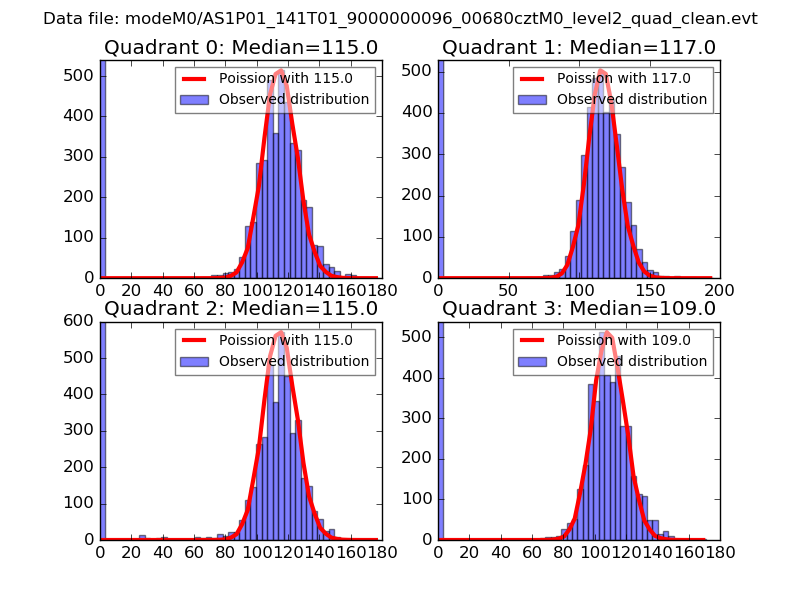 |
 |
| Quadrant-wise count rates Data is divided into 100 sec bins |
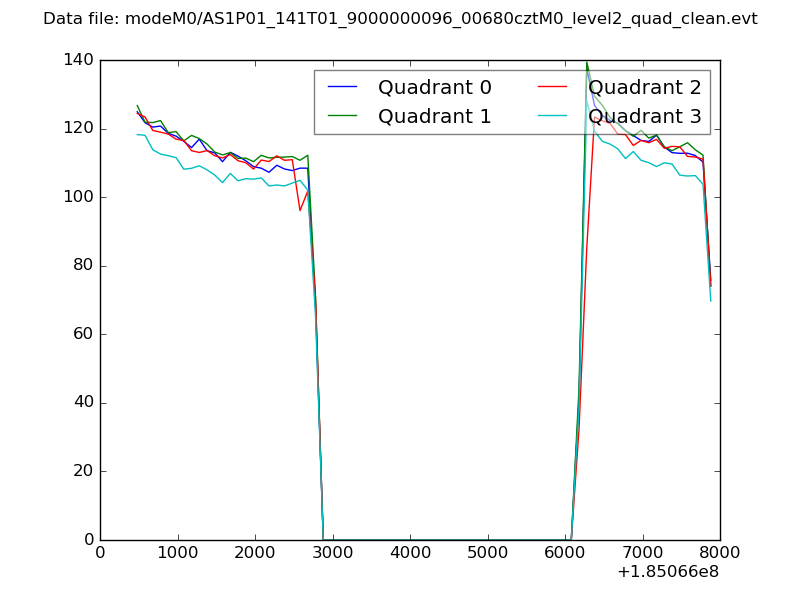 |
|
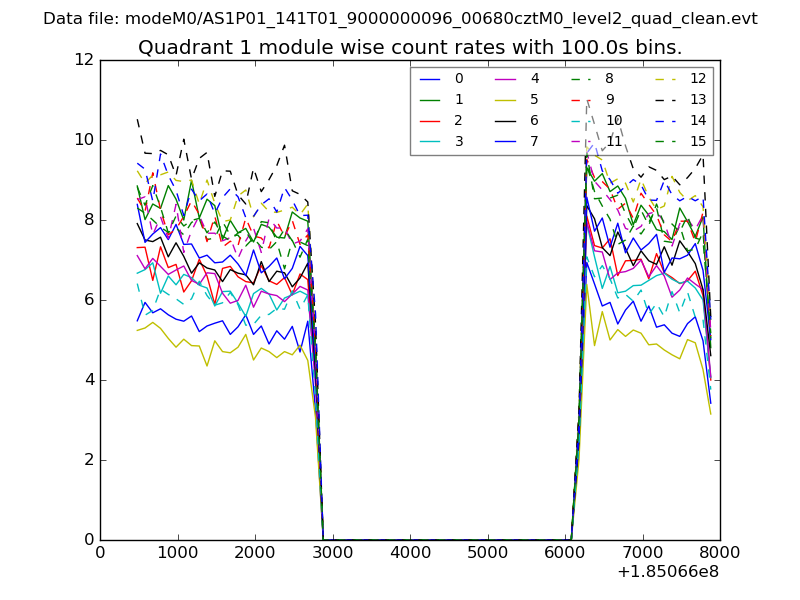
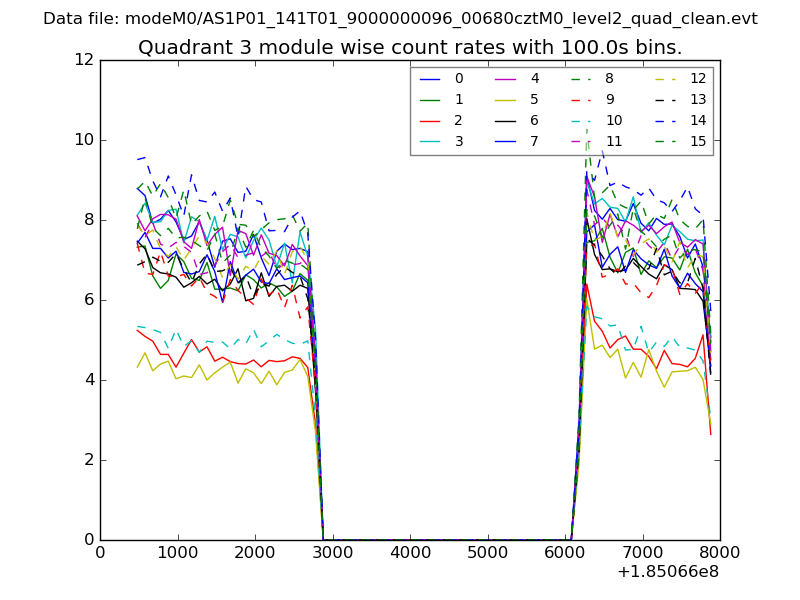
| Module-wise count rates for Quadrant A Data is divided into 100 sec bins |
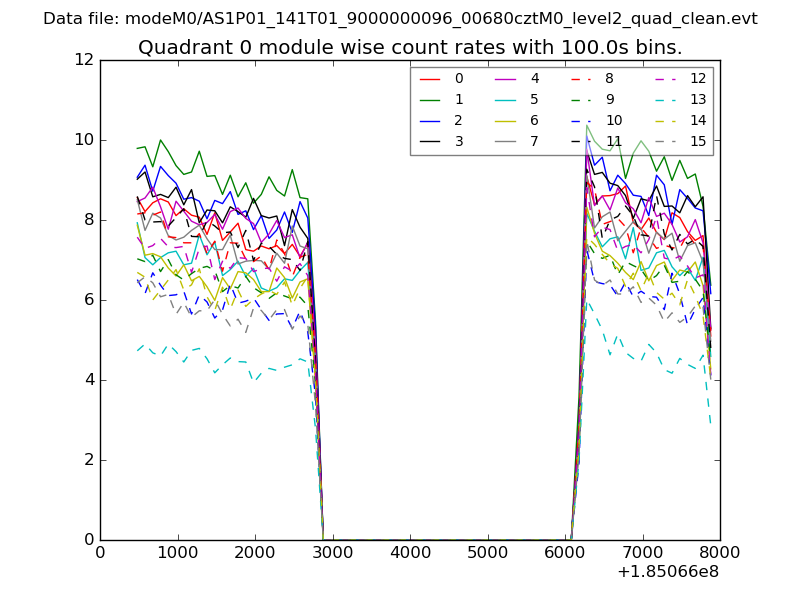 |
 |
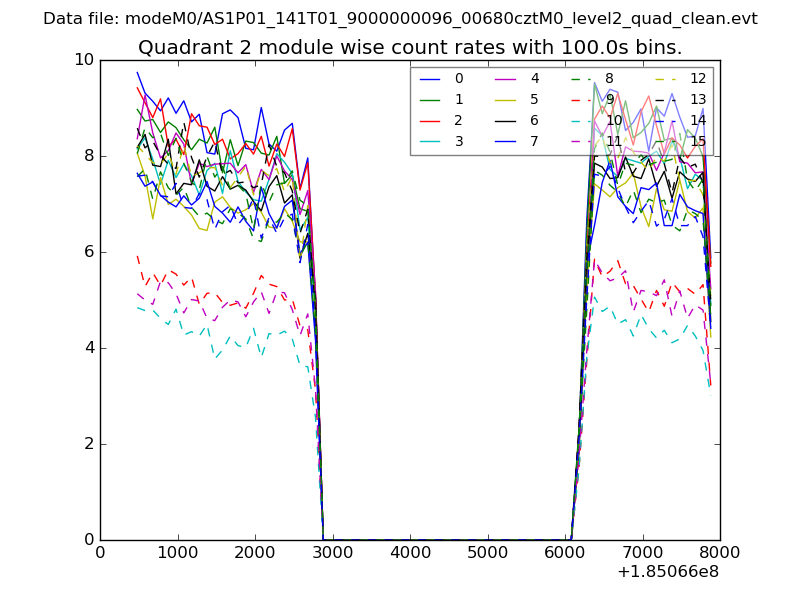
| Module-wise count rates for Quadrant B Data is divided into 100 sec bins |
 |
 |
| Module-wise count rates for Quadrant C Data is divided into 100 sec bins |
 |
 |
| Module-wise count rates for Quadrant D Data is divided into 100 sec bins |
 |
 |
| Parameter | Plot |
|---|---|
| CZT HV Monitor | 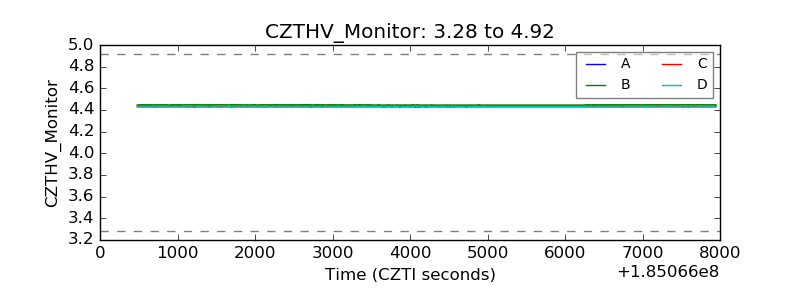 |
| D_VDD | 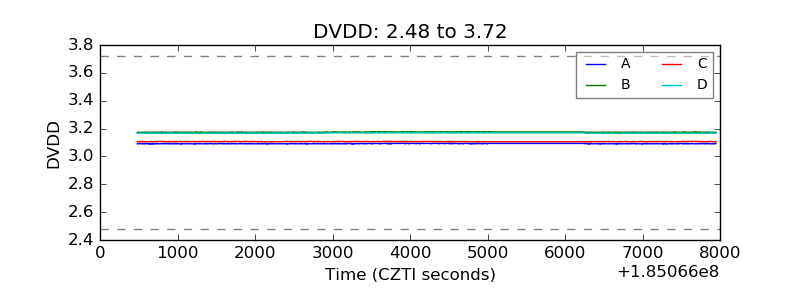 |
| Temperature 1 | 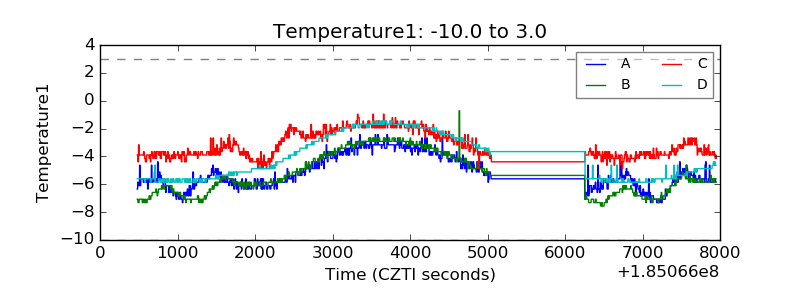 |
| Veto HV Monitor | 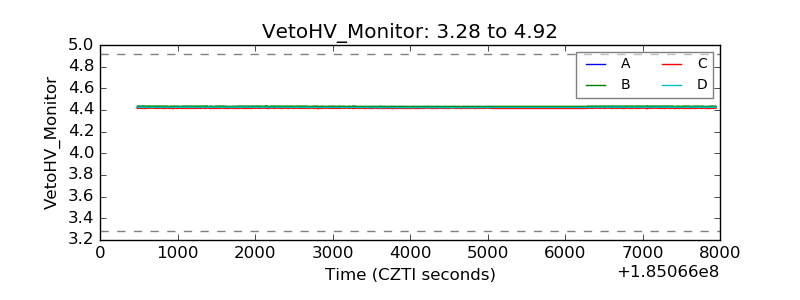 |
| Veto LLD |  |
| Alpha Counter | 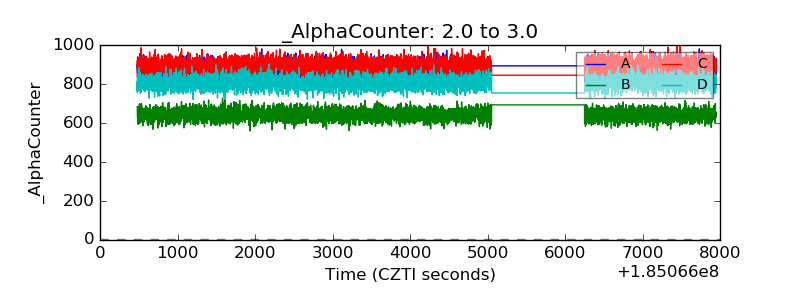 |
| _CPM_Rate | 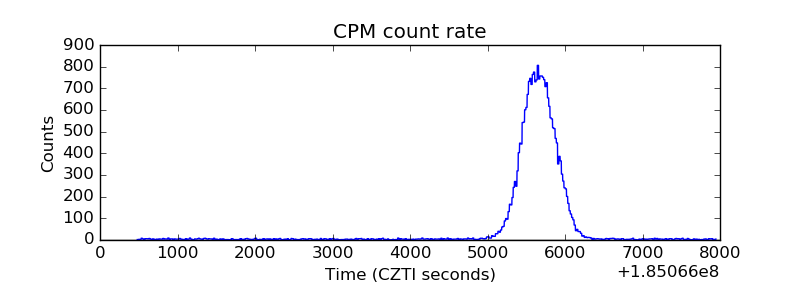 |
| CZT Counter | 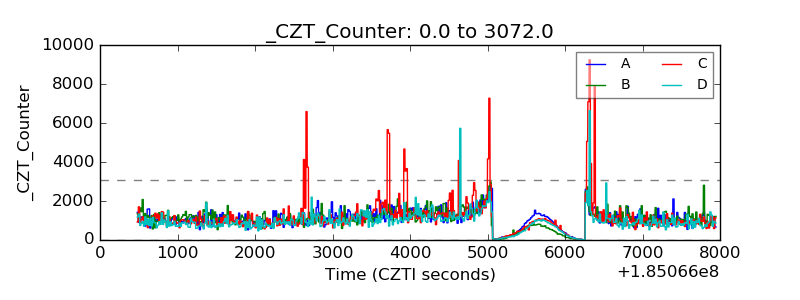 |
| +2.5 Volts monitor |  |
| +5 Volts monitor |  |
| _ROLL_ROT |  |
| _Roll_DEC | 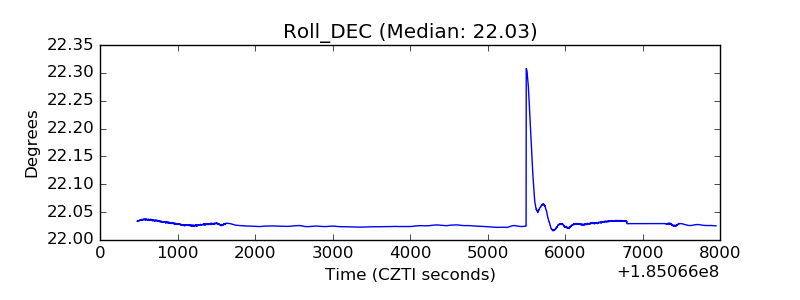 |
| _Roll_RA | 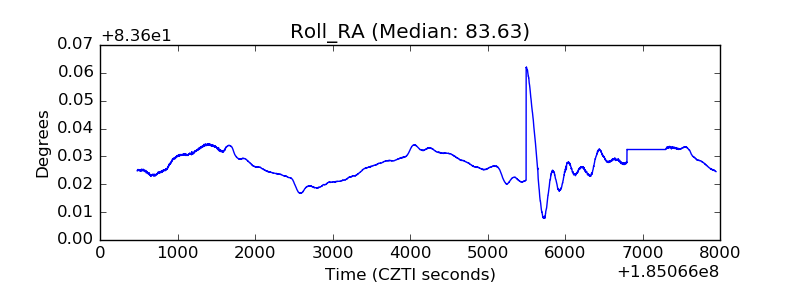 |
| Veto Counter | 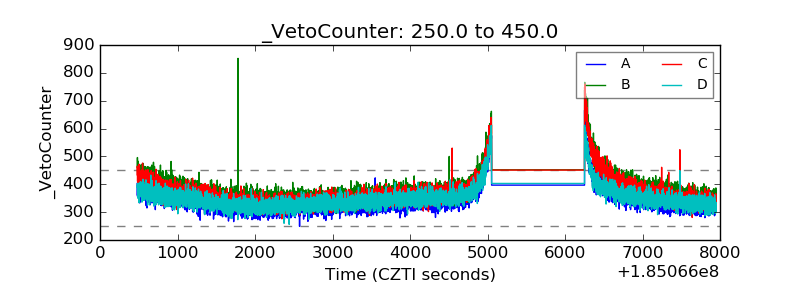 |