| Param | Original file | Final file |
|---|---|---|
| Filename | modeM0/AS1P01_141T01_9000000096_00681cztM0_level2.evt | modeM0/AS1P01_141T01_9000000096_00681cztM0_level2_quad_clean.evt |
| Size (bytes) | 894,994,560 | 66,081,600 |
| Size | 853.5 MB | 63.0 MB |
| Events in quadrant A | 7,055,681 | 401,651 |
| Events in quadrant B | 7,132,099 | 408,501 |
| Events in quadrant C | 6,402,779 | 402,843 |
| Events in quadrant D | 6,129,587 | 383,147 |
| Mode M9 | |||
|---|---|---|---|
| Quadrant | BADHDUFLAG | Total packets | Discarded packets |
| A | 0 | 22 | 11 |
| B | 0 | 22 | 11 |
| C | 0 | 22 | 11 |
| D | 0 | 22 | 11 |
| Mode M0 | |||
|---|---|---|---|
| Quadrant | BADHDUFLAG | Total packets | Discarded packets |
| A | 0 | 50132 | 25065 |
| B | 0 | 50592 | 25297 |
| C | 0 | 46337 | 23176 |
| D | 0 | 44698 | 22350 |
| Mode SS | |||
|---|---|---|---|
| Quadrant | BADHDUFLAG | Total packets | Discarded packets |
| A | 0 | 236 | 118 |
| B | 0 | 236 | 118 |
| C | 0 | 236 | 118 |
| D | 0 | 236 | 118 |
| Quadrant | Total seconds | Saturated seconds | Saturation percentage |
|---|---|---|---|
| A | 5788 | 15 | 0.259157% |
| B | 5788 | 9 | 0.155494% |
| C | 5786 | 6 | 0.103699% |
| D | 5787 | 13 | 0.224641% |
Noise dominated data is calculated using 1-second bins in cleaned event files. If a bin has >2000 counts, and if more than 50% of those come from <1% of pixels, then it is considered to be noise-dominated and hence unusable.
| Quadrant | # 1 sec bins | Bins with >0 counts | Bins with >2000 counts | High rate bins dominated by noise | Noise dominated (total time) | Noise dominated (detector-on time) | Marked lightcurve |
|---|---|---|---|---|---|---|---|
| A | 6913 | 5789 | 243 | 243 | 3.52% | 4.20% | 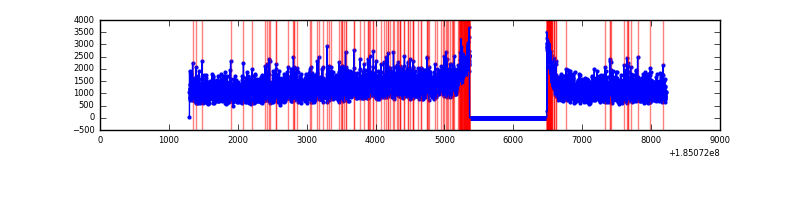 |
| B | 6913 | 5789 | 233 | 233 | 3.37% | 4.02% | 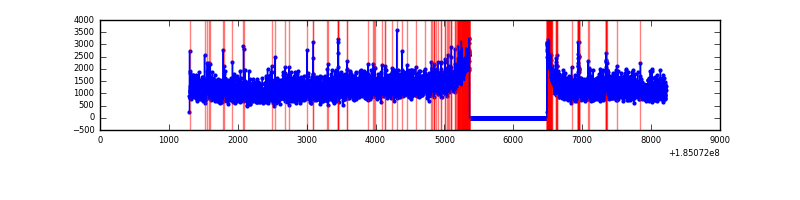 |
| C | 6912 | 5788 | 167 | 167 | 2.42% | 2.89% | 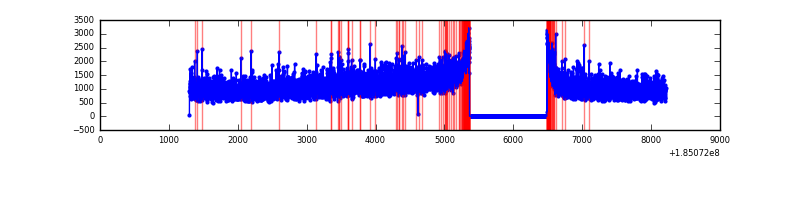 |
| D | 6912 | 5788 | 138 | 138 | 2.00% | 2.38% | 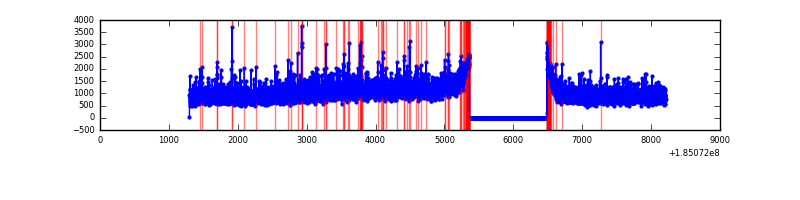 |
Top three noisy pixels from each quadrant. If the there are fewer than three noisy pixels in the level2.evt file, extra rows are filled as -1
| Pixel properties | Quadrant properties | ||||||
|---|---|---|---|---|---|---|---|
| Quadrant | DetID | PixID | Counts | Sigma | Mean | Median | Sigma |
| A | 5 | 203 | 19985 | 45.25 | 1835 | 1819 | 401.4 |
| A | 15 | 249 | 6426 | 11.48 | 1835 | 1819 | 401.4 |
| A | 3 | 111 | 5134 | 8.26 | 1835 | 1819 | 401.4 |
| B | 7 | 221 | 105367 | 243.84 | 1806 | 1818 | 424.7 |
| B | 0 | 220 | 75039 | 172.43 | 1806 | 1818 | 424.7 |
| B | 8 | 4 | 61002 | 139.37 | 1806 | 1818 | 424.7 |
| C | 15 | 241 | 10621 | 19.63 | 1634 | 1695 | 454.6 |
| C | -1 | -1 | -1 | -1.0 | 1634 | 1695 | 454.6 |
| C | -1 | -1 | -1 | -1.0 | 1634 | 1695 | 454.6 |
| D | 1 | 4 | 92514 | 184.89 | 1606 | 1664 | 491.4 |
| D | 12 | 22 | 22221 | 41.84 | 1606 | 1664 | 491.4 |
| D | 13 | 252 | 13476 | 24.04 | 1606 | 1664 | 491.4 |
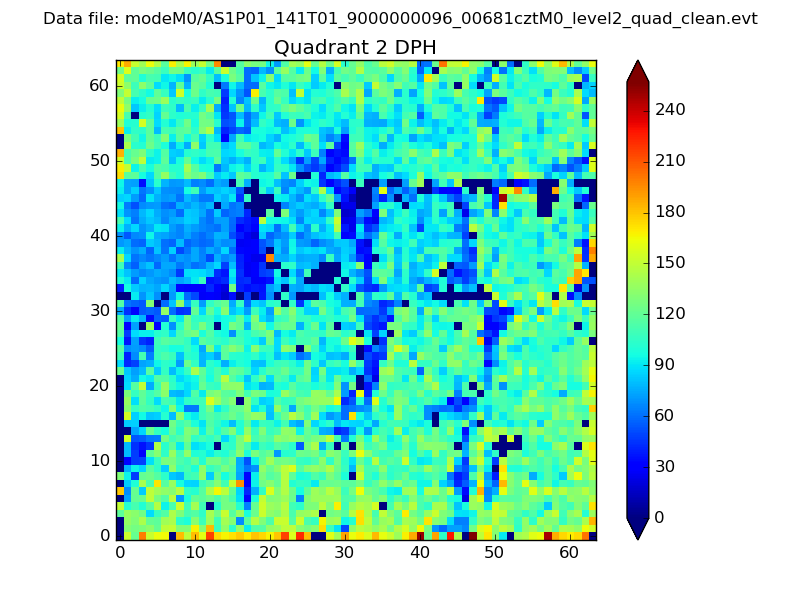
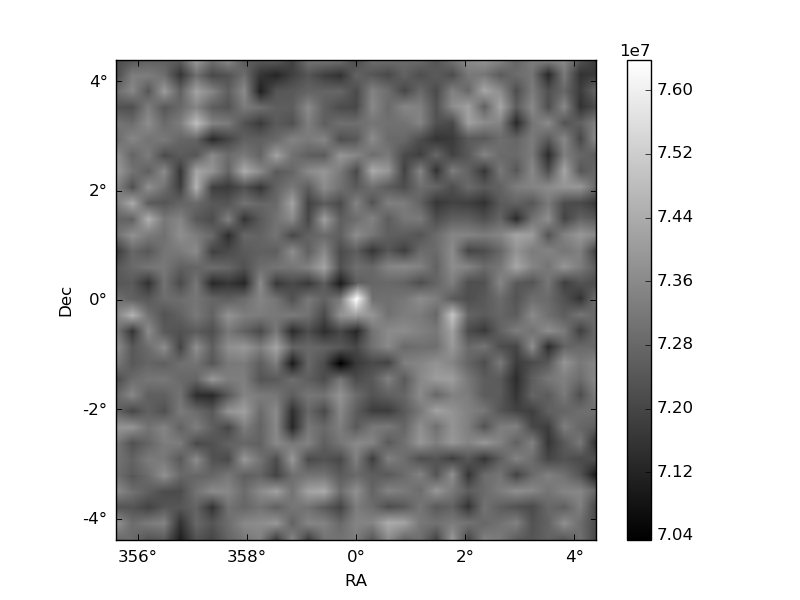
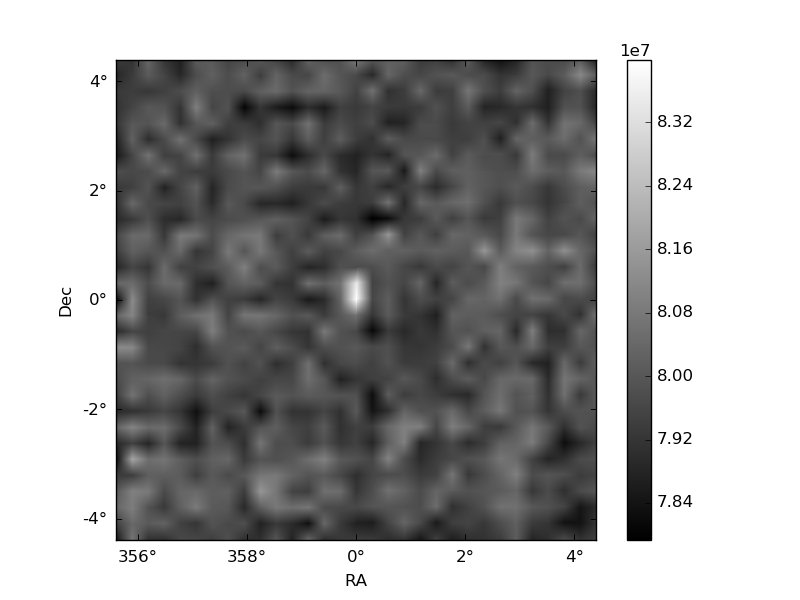
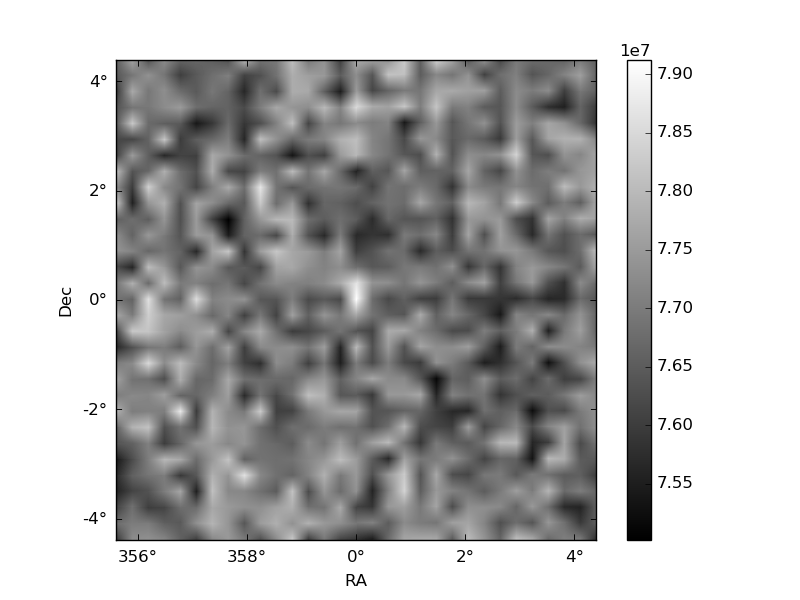
Histogram calculated using DETX and DETY for each event in the final _common_clean file
| Quadrant A | 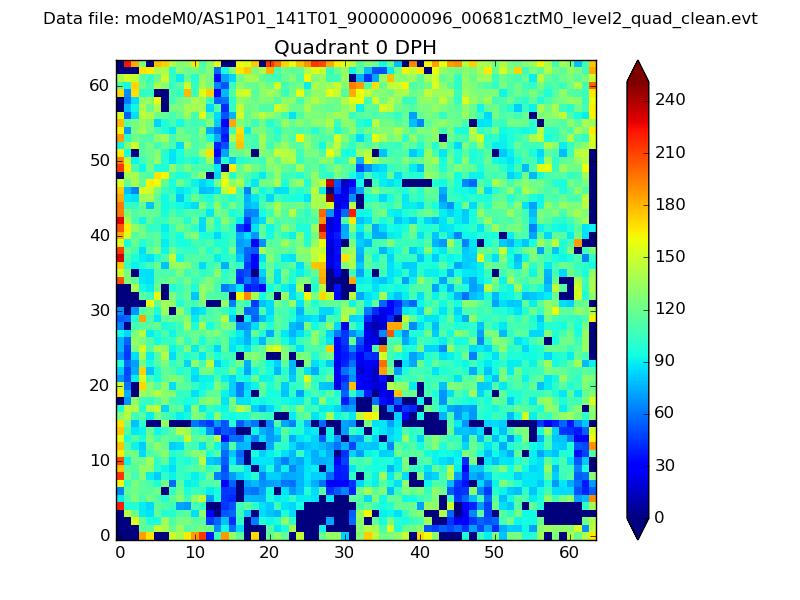 |
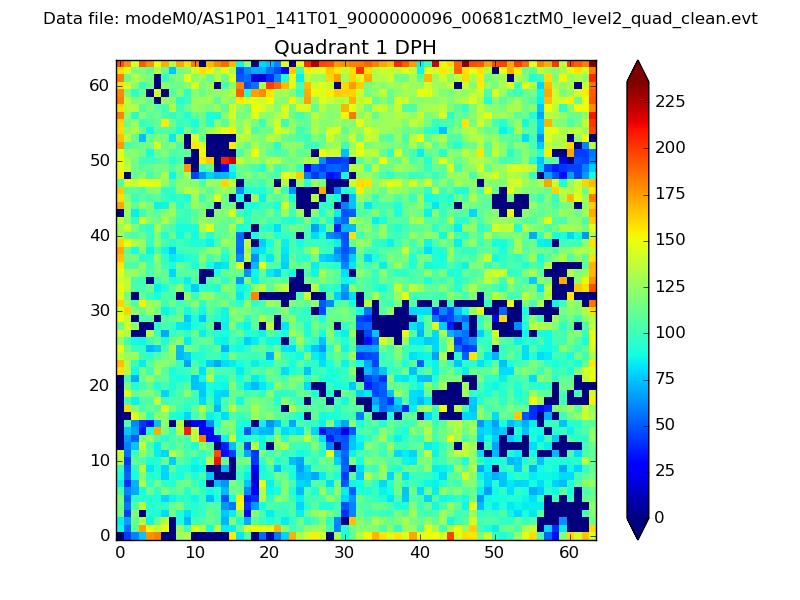 |
Quadrant B |
|---|---|---|---|
| Quadrant D | 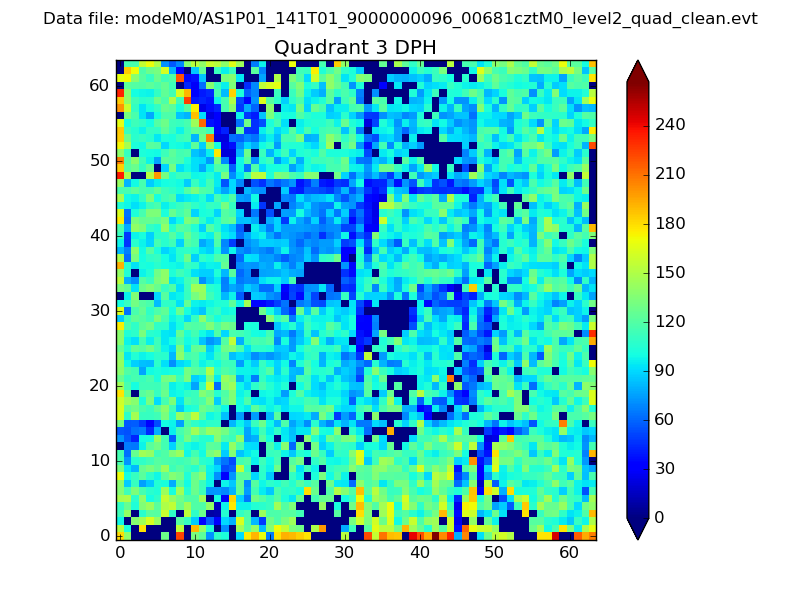 |
 |
Quadrant C |
| Plot type | Count rate plots | Images |
|---|---|---|
| Comparison with Poisson distribution Blue bars denote a histogram of data divided into 1 sec bins. Red curve is a Poisson curve with rate = median count rate of data. |
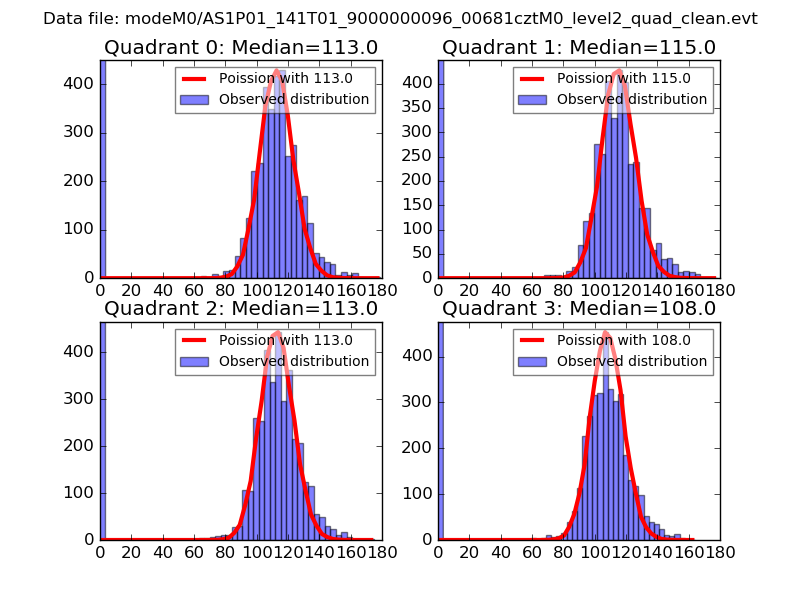 |
 |
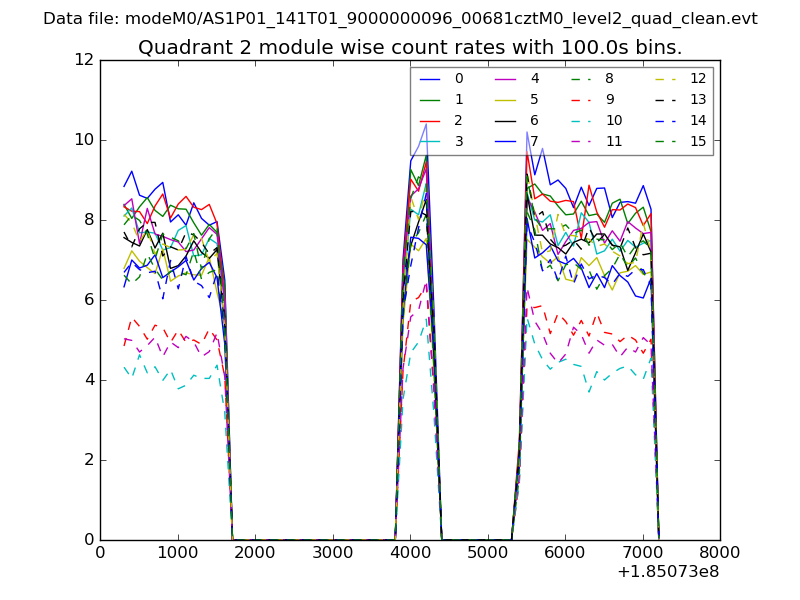
| Quadrant-wise count rates Data is divided into 100 sec bins |
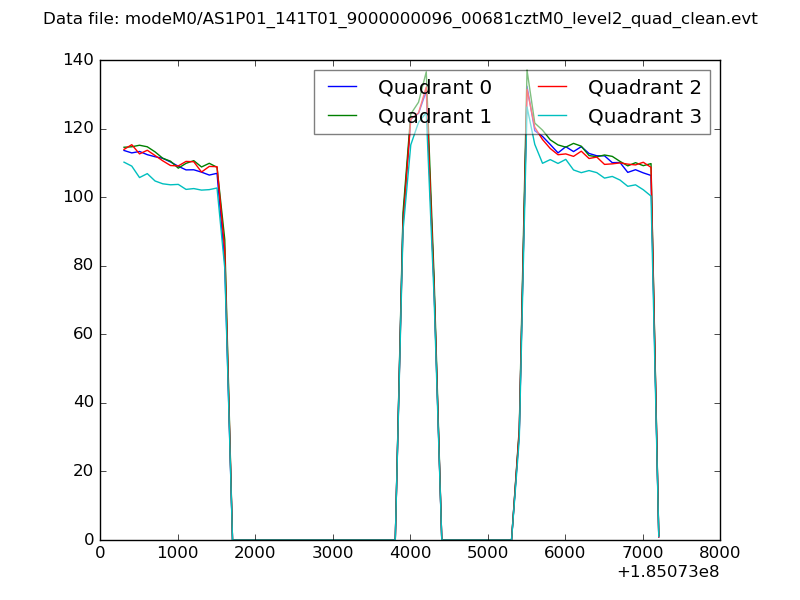 |
|
| Module-wise count rates for Quadrant A Data is divided into 100 sec bins |
 |
 |
| Module-wise count rates for Quadrant B Data is divided into 100 sec bins |
 |
 |
| Module-wise count rates for Quadrant C Data is divided into 100 sec bins |
 |
 |
| Module-wise count rates for Quadrant D Data is divided into 100 sec bins |
 |
 |
| Parameter | Plot |
|---|---|
| CZT HV Monitor | 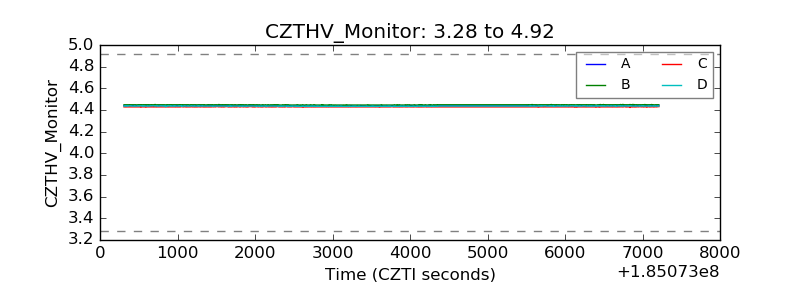 |
| D_VDD | 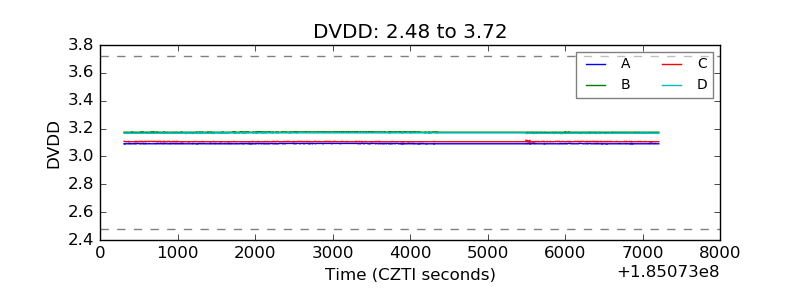 |
| Temperature 1 | 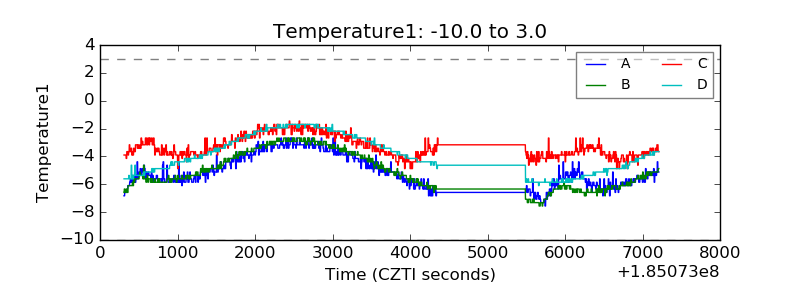 |
| Veto HV Monitor | 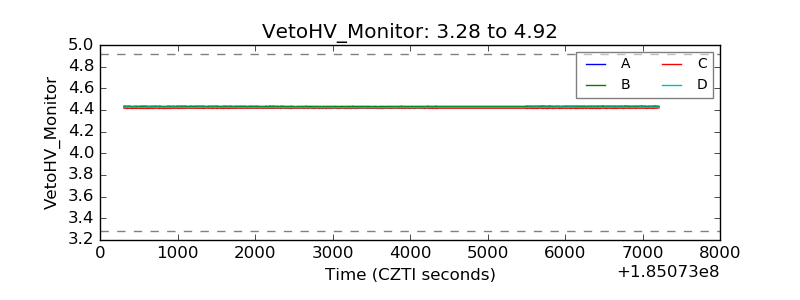 |
| Veto LLD | 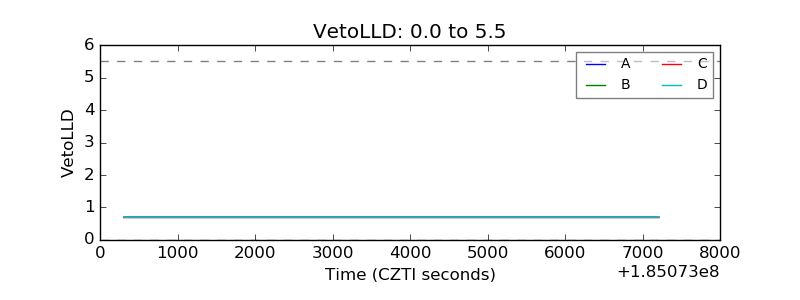 |
| Alpha Counter | 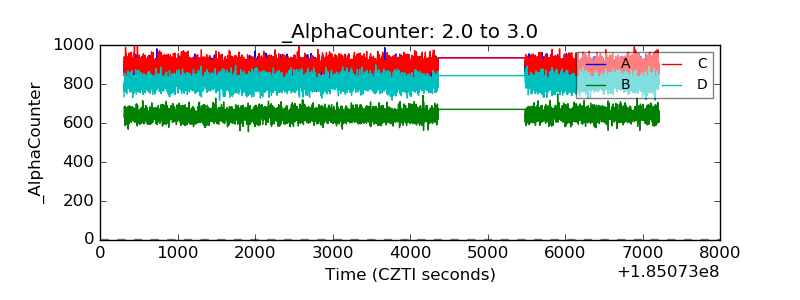 |
| _CPM_Rate | 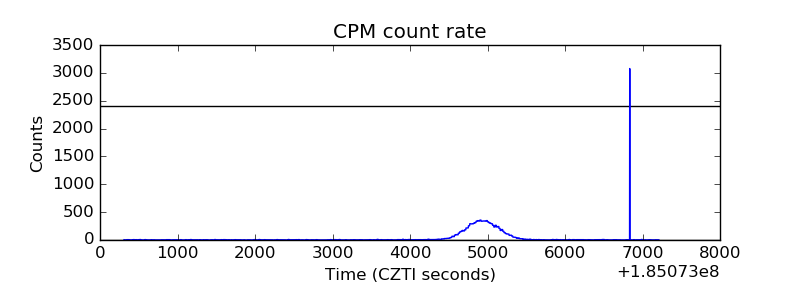 |
| CZT Counter | 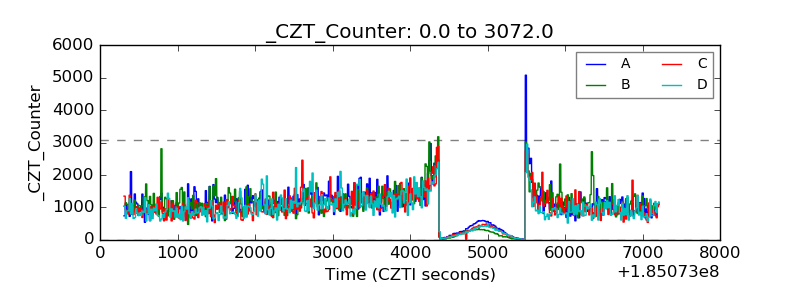 |
| +2.5 Volts monitor |  |
| +5 Volts monitor |  |
| _ROLL_ROT | 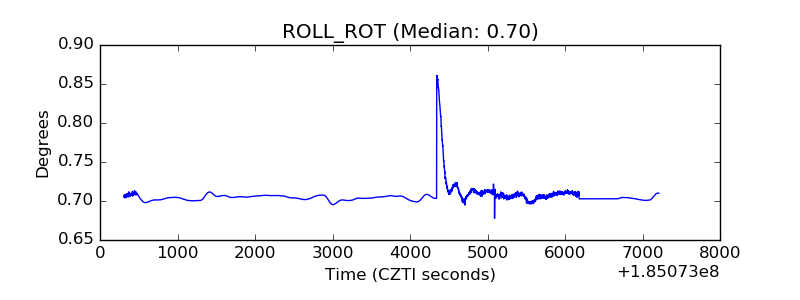 |
| _Roll_DEC | 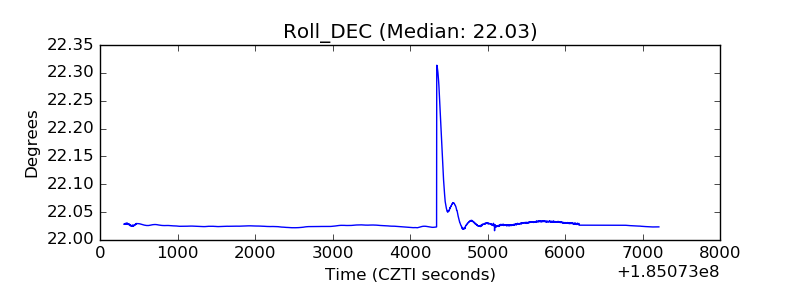 |
| _Roll_RA | 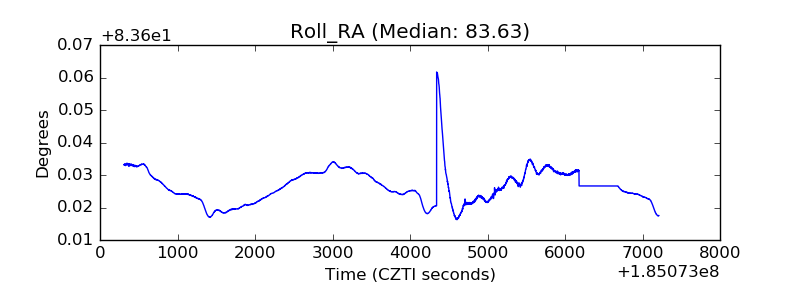 |
| Veto Counter | 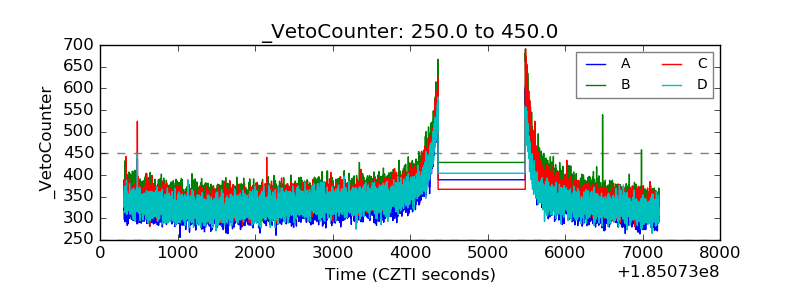 |