| Param | Original file | Final file |
|---|---|---|
| Filename | modeM0/AS1P01_141T01_9000000096_00682cztM0_level2.evt | modeM0/AS1P01_141T01_9000000096_00682cztM0_level2_quad_clean.evt |
| Size (bytes) | 520,680,960 | 25,153,920 |
| Size | 496.6 MB | 24.0 MB |
| Events in quadrant A | 4,006,847 | 129,572 |
| Events in quadrant B | 4,122,028 | 131,454 |
| Events in quadrant C | 3,740,304 | 131,621 |
| Events in quadrant D | 3,669,208 | 124,344 |
| Mode M0 | |||
|---|---|---|---|
| Quadrant | BADHDUFLAG | Total packets | Discarded packets |
| A | 0 | 28665 | 14330 |
| B | 0 | 29402 | 14701 |
| C | 0 | 27182 | 13591 |
| D | 0 | 26706 | 13353 |
| Mode SS | |||
|---|---|---|---|
| Quadrant | BADHDUFLAG | Total packets | Discarded packets |
| A | 0 | 136 | 68 |
| B | 0 | 136 | 68 |
| C | 0 | 136 | 68 |
| D | 0 | 136 | 68 |
| Quadrant | Total seconds | Saturated seconds | Saturation percentage |
|---|---|---|---|
| A | 3443 | 1 | 0.029044% |
| B | 3443 | 0 | 0.000000% |
| C | 3443 | 0 | 0.000000% |
| D | 3443 | 5 | 0.145222% |
Noise dominated data is calculated using 1-second bins in cleaned event files. If a bin has >2000 counts, and if more than 50% of those come from <1% of pixels, then it is considered to be noise-dominated and hence unusable.
| Quadrant | # 1 sec bins | Bins with >0 counts | Bins with >2000 counts | High rate bins dominated by noise | Noise dominated (total time) | Noise dominated (detector-on time) | Marked lightcurve |
|---|---|---|---|---|---|---|---|
| A | 3443 | 3443 | 35 | 35 | 1.02% | 1.02% | 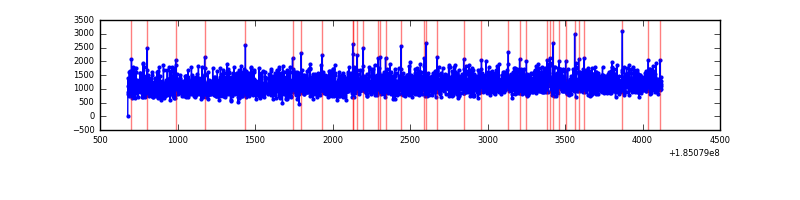 |
| B | 3443 | 3443 | 37 | 37 | 1.07% | 1.07% |  |
| C | 3443 | 3443 | 22 | 22 | 0.64% | 0.64% | 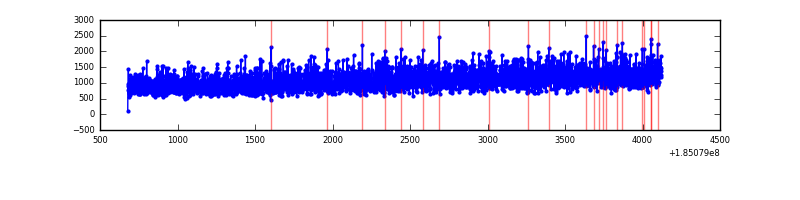 |
| D | 3443 | 3443 | 31 | 31 | 0.90% | 0.90% | 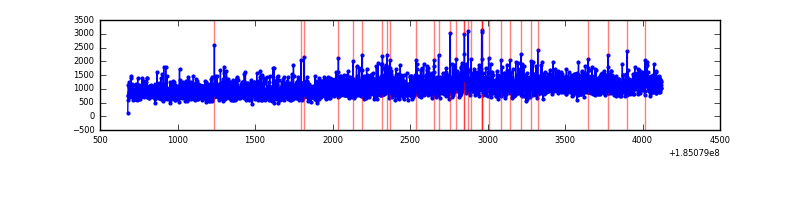 |
Top three noisy pixels from each quadrant. If the there are fewer than three noisy pixels in the level2.evt file, extra rows are filled as -1
| Pixel properties | Quadrant properties | ||||||
|---|---|---|---|---|---|---|---|
| Quadrant | DetID | PixID | Counts | Sigma | Mean | Median | Sigma |
| A | 12 | 236 | 8467 | 33.27 | 1041 | 1034 | 223.4 |
| A | 13 | 164 | 5438 | 19.71 | 1041 | 1034 | 223.4 |
| A | 3 | 111 | 2989 | 8.75 | 1041 | 1034 | 223.4 |
| B | 8 | 4 | 78876 | 316.75 | 1040 | 1048 | 245.7 |
| B | 0 | 220 | 67557 | 270.69 | 1040 | 1048 | 245.7 |
| B | 7 | 221 | 20323 | 78.45 | 1040 | 1048 | 245.7 |
| C | 8 | 208 | 7782 | 25.65 | 952 | 987 | 264.9 |
| C | 15 | 241 | 6024 | 19.02 | 952 | 987 | 264.9 |
| C | 9 | 52 | 3029 | 7.71 | 952 | 987 | 264.9 |
| D | 1 | 4 | 55438 | 188.86 | 944 | 976 | 288.4 |
| D | 13 | 252 | 30999 | 104.11 | 944 | 976 | 288.4 |
| D | 13 | 207 | 29436 | 98.69 | 944 | 976 | 288.4 |
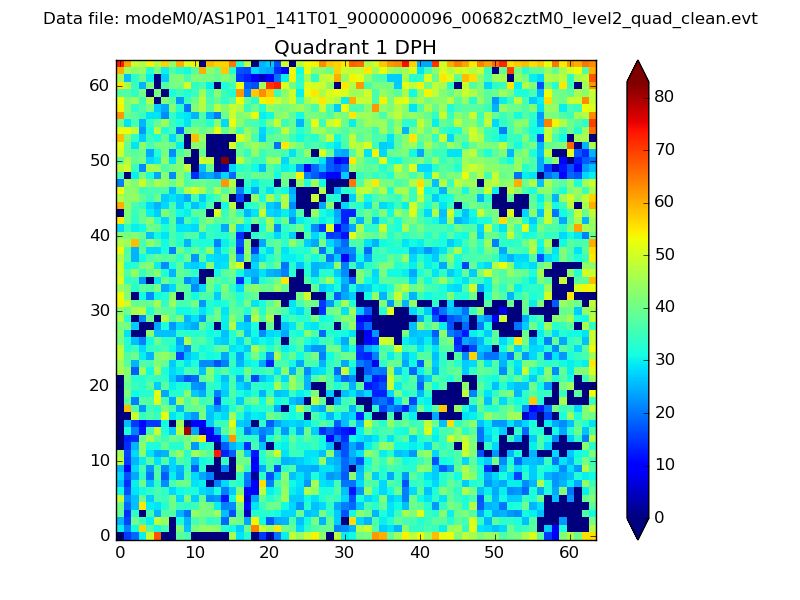
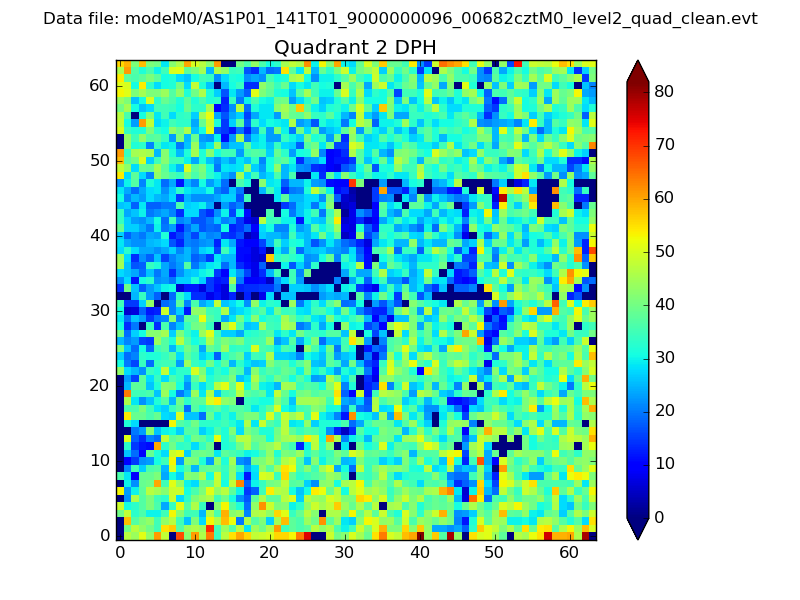
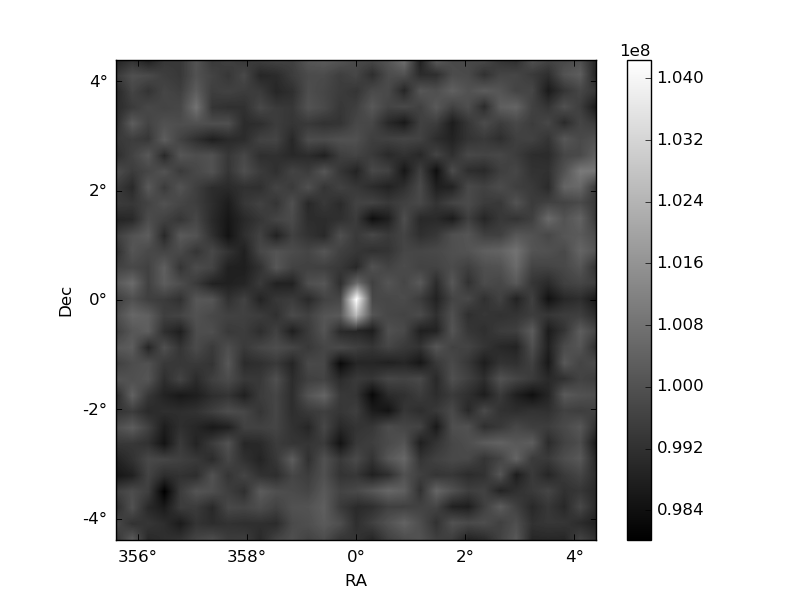
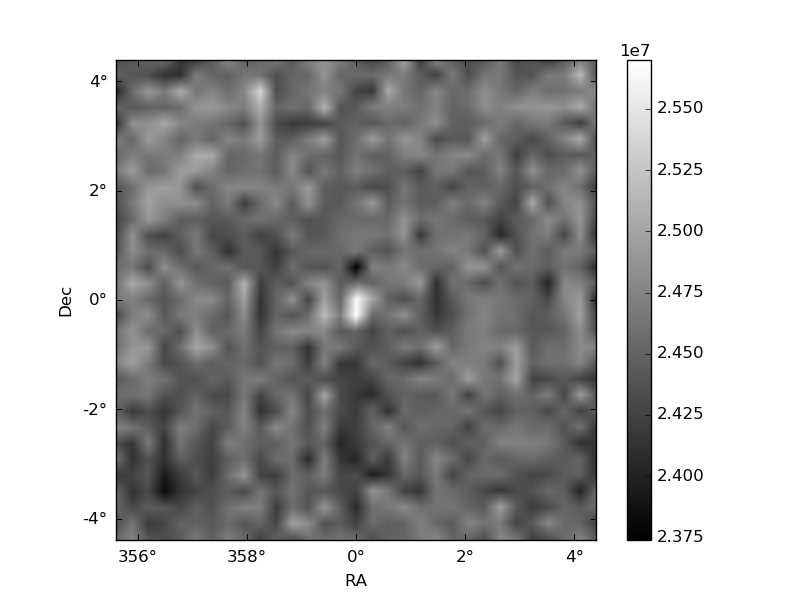
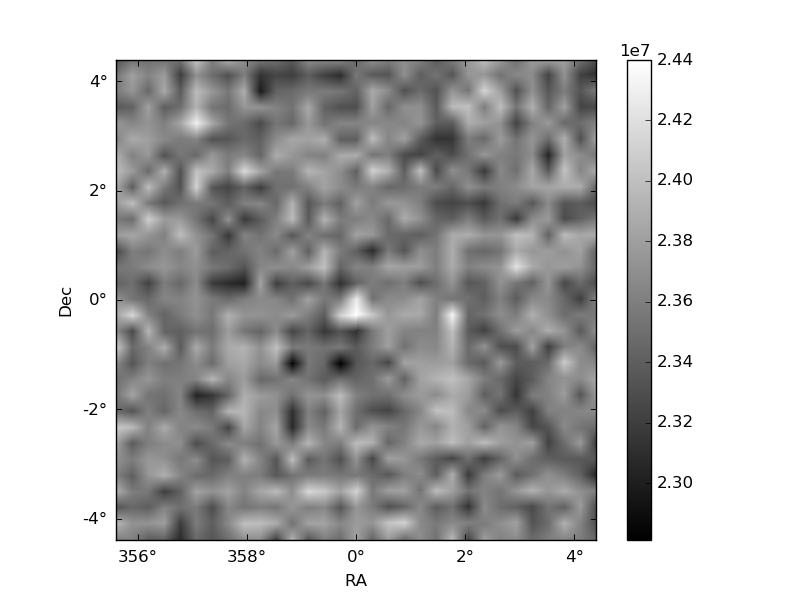
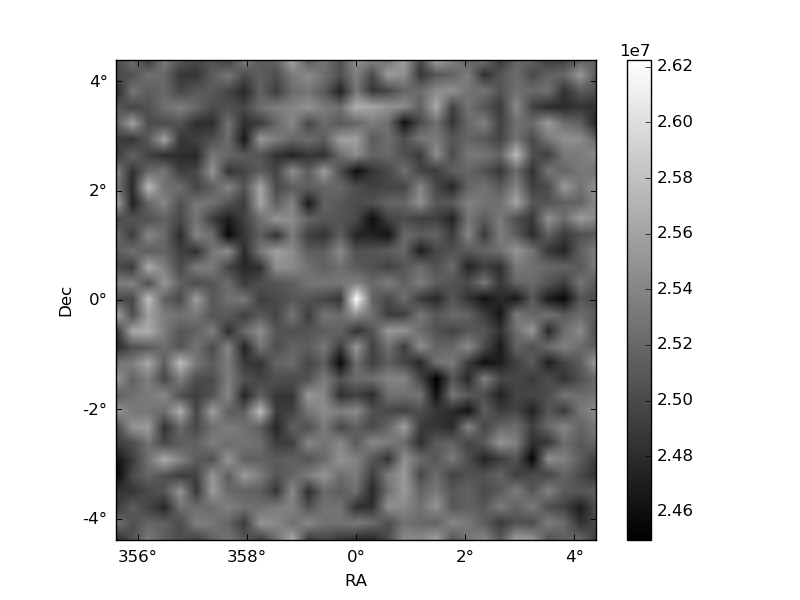
Histogram calculated using DETX and DETY for each event in the final _common_clean file
| Quadrant A | 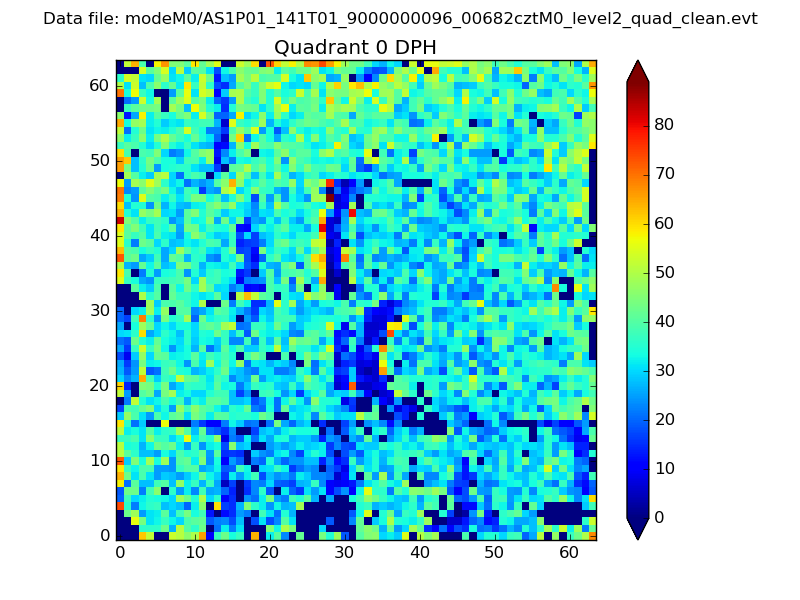 |
 |
Quadrant B |
|---|---|---|---|
| Quadrant D | 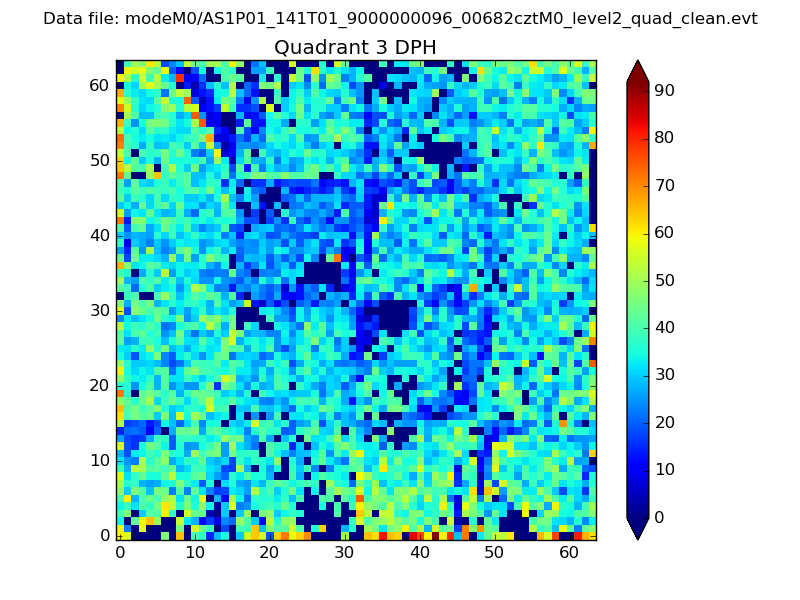 |
 |
Quadrant C |
| Plot type | Count rate plots | Images |
|---|---|---|
| Comparison with Poisson distribution Blue bars denote a histogram of data divided into 1 sec bins. Red curve is a Poisson curve with rate = median count rate of data. |
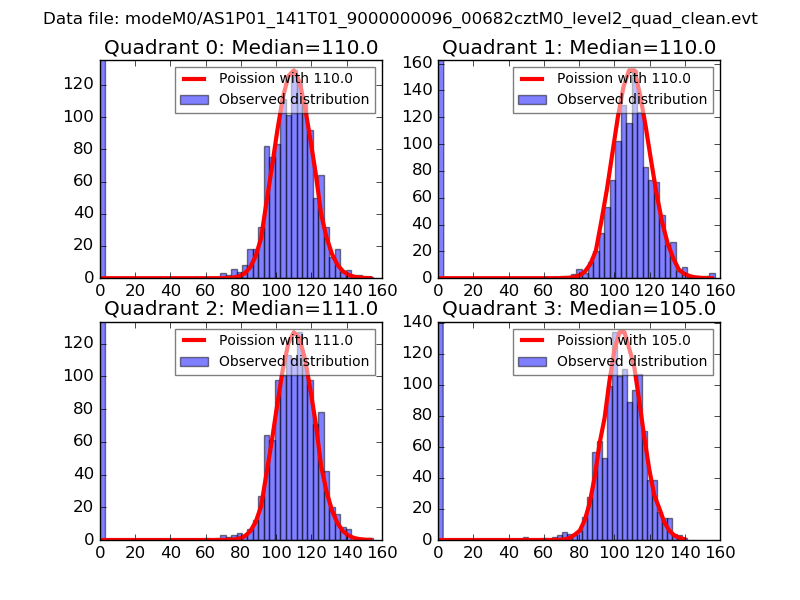 |
 |
| Quadrant-wise count rates Data is divided into 100 sec bins |
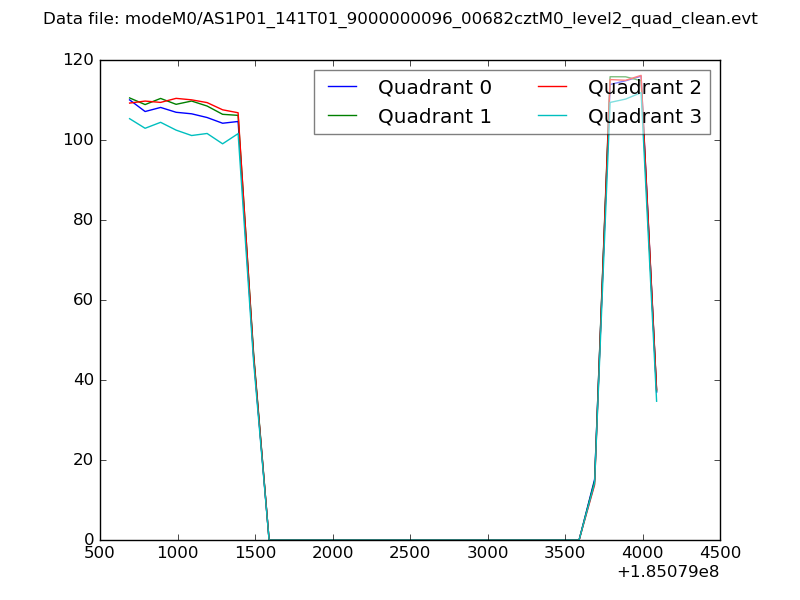 |
|
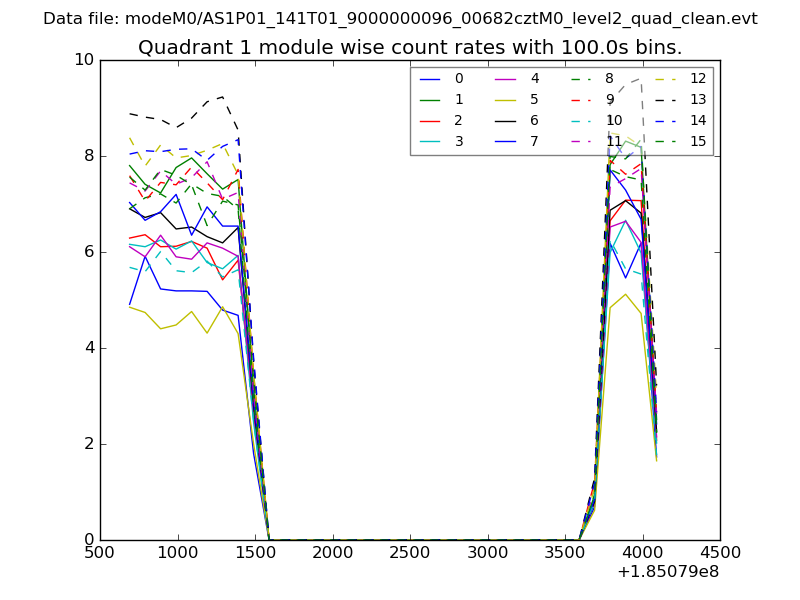
| Module-wise count rates for Quadrant A Data is divided into 100 sec bins |
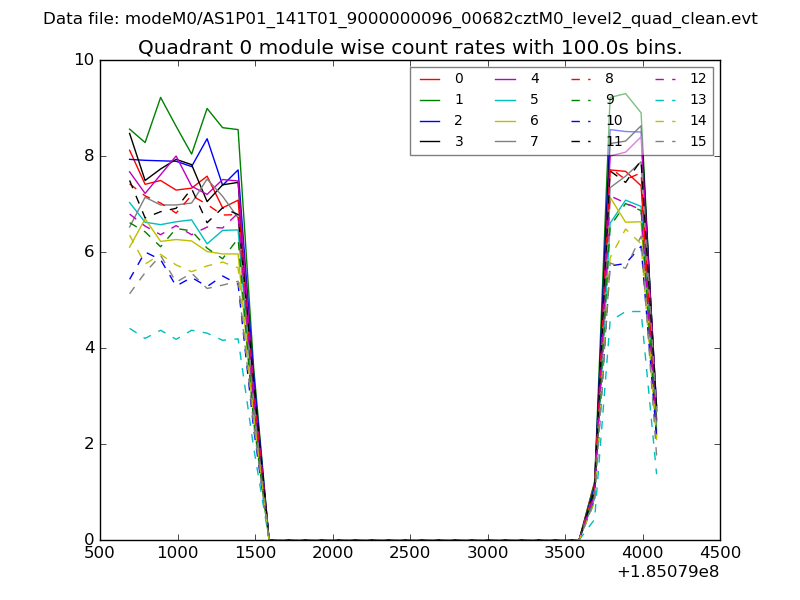 |
 |
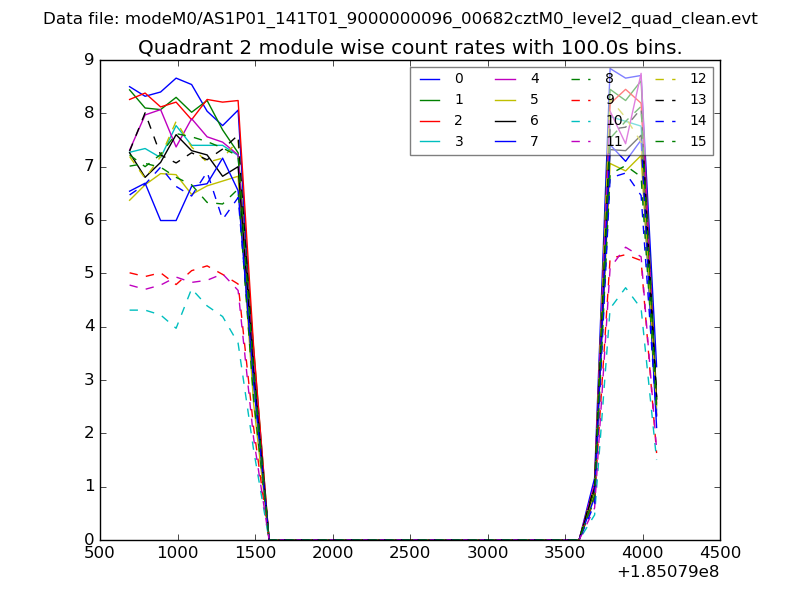
| Module-wise count rates for Quadrant B Data is divided into 100 sec bins |
 |
 |
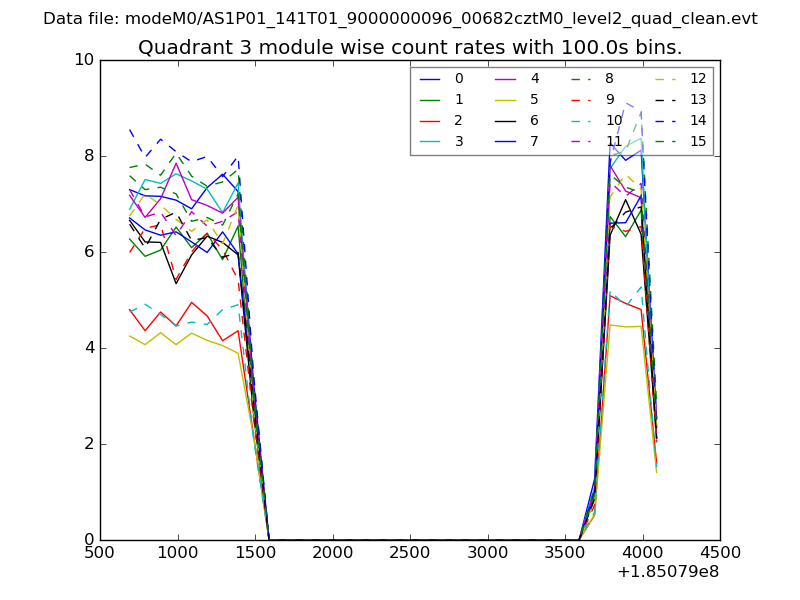
| Module-wise count rates for Quadrant C Data is divided into 100 sec bins |
 |
 |
| Module-wise count rates for Quadrant D Data is divided into 100 sec bins |
 |
 |
| Parameter | Plot |
|---|---|
| CZT HV Monitor | 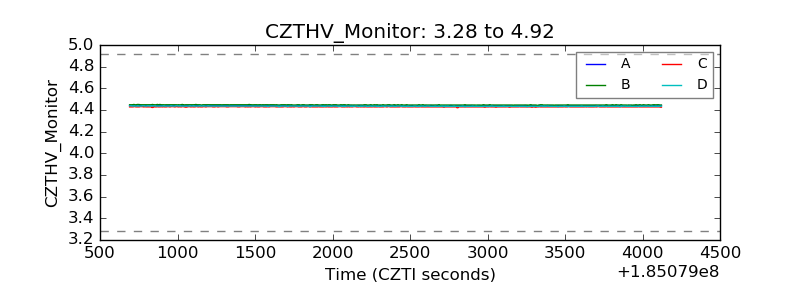 |
| D_VDD | 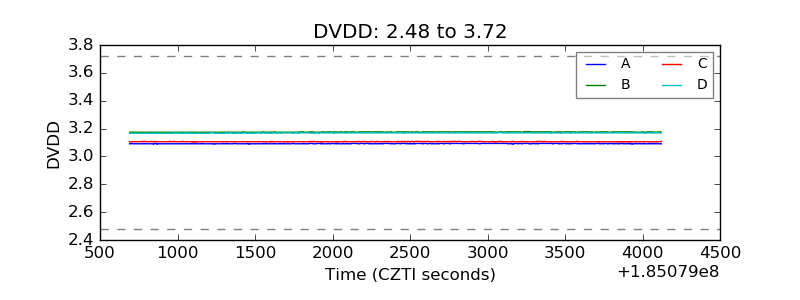 |
| Temperature 1 | 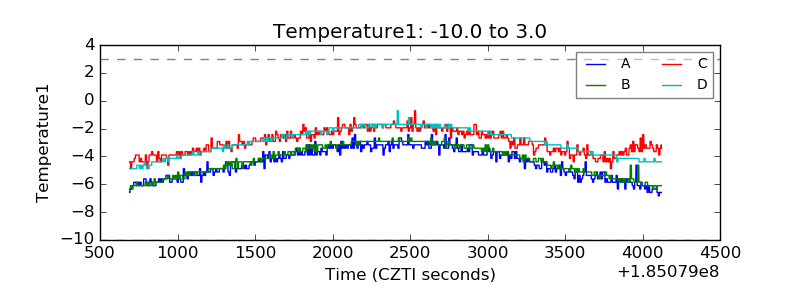 |
| Veto HV Monitor | 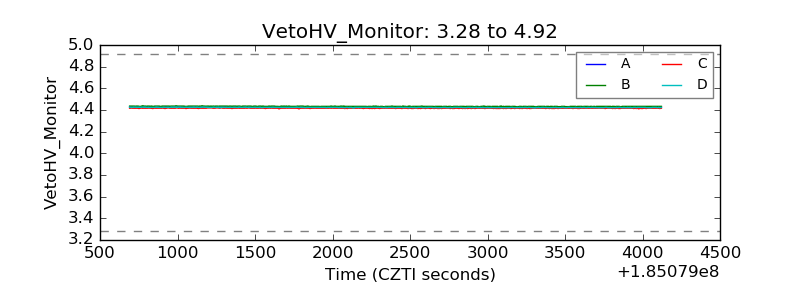 |
| Veto LLD | 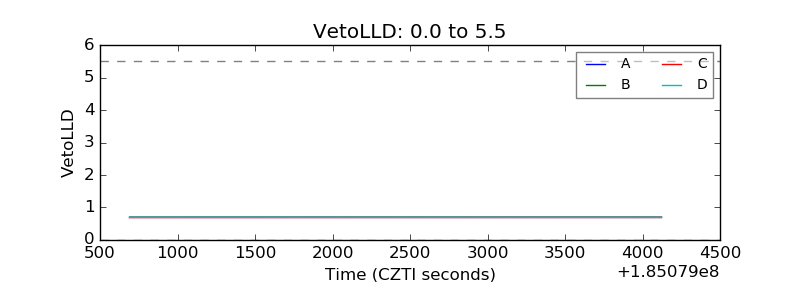 |
| Alpha Counter | 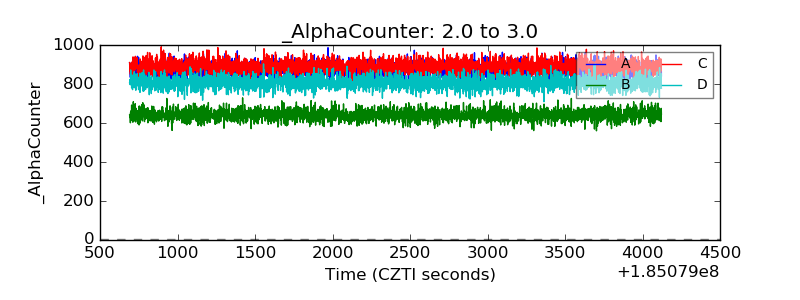 |
| _CPM_Rate | 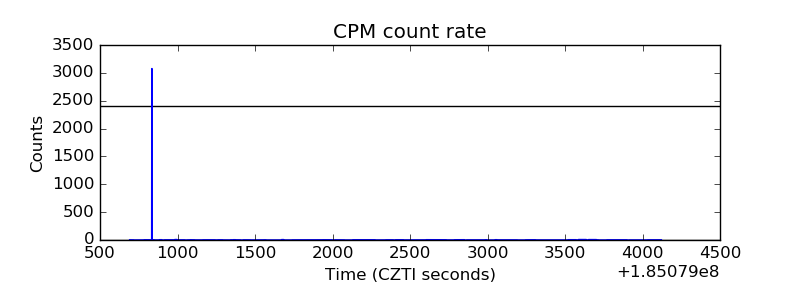 |
| CZT Counter | 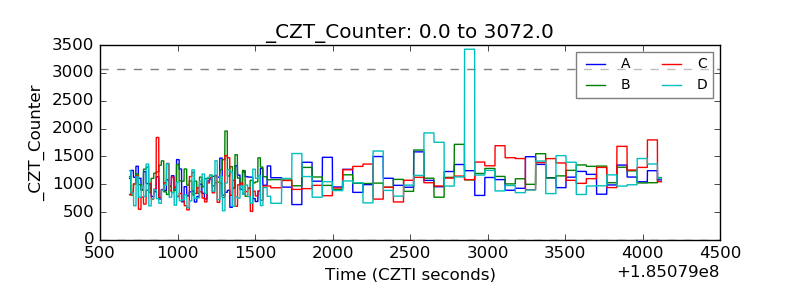 |
| +2.5 Volts monitor |  |
| +5 Volts monitor |  |
| _ROLL_ROT | 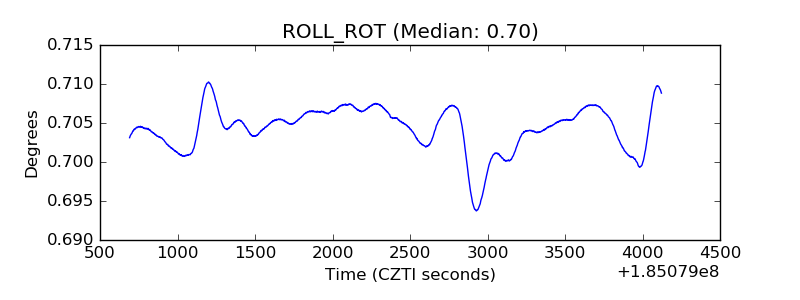 |
| _Roll_DEC | 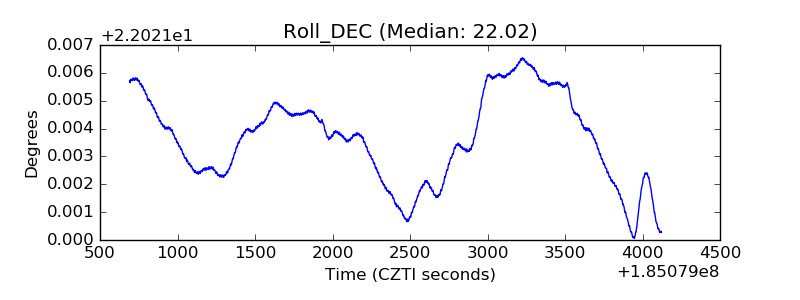 |
| _Roll_RA | 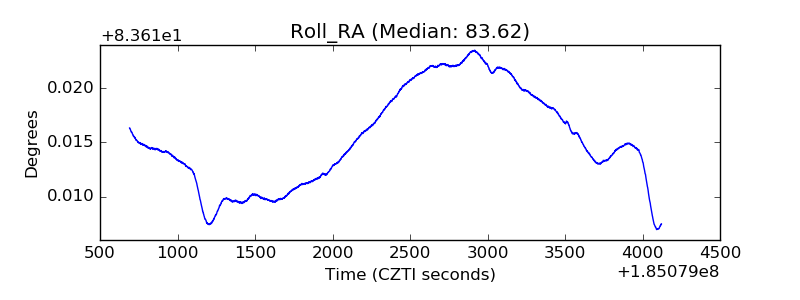 |
| Veto Counter | 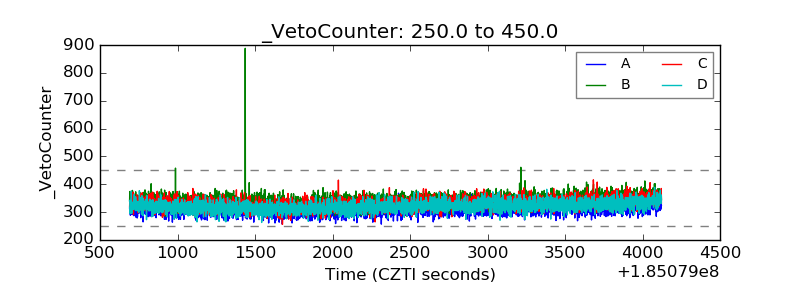 |