| Param | Original file | Final file |
|---|---|---|
| Filename | modeM0/AS1P01_147T02_9000000098_00683cztM0_level2.evt | modeM0/AS1P01_147T02_9000000098_00683cztM0_level2_quad_clean.evt |
| Size (bytes) | 1,050,454,080 | 67,403,520 |
| Size | 1001.8 MB | 64.3 MB |
| Events in quadrant A | 7,785,537 | 394,016 |
| Events in quadrant B | 8,515,250 | 402,809 |
| Events in quadrant C | 7,793,298 | 398,441 |
| Events in quadrant D | 7,282,982 | 387,188 |
| Mode M9 | |||
|---|---|---|---|
| Quadrant | BADHDUFLAG | Total packets | Discarded packets |
| A | 0 | 5 | 0 |
| B | 0 | 5 | 0 |
| C | 0 | 5 | 0 |
| D | 0 | 5 | 0 |
| Mode SS | |||
|---|---|---|---|
| Quadrant | BADHDUFLAG | Total packets | Discarded packets |
| A | 0 | 134 | 0 |
| B | 0 | 134 | 0 |
| C | 0 | 134 | 0 |
| D | 0 | 134 | 0 |
| Mode M0 | |||
|---|---|---|---|
| Quadrant | BADHDUFLAG | Total packets | Discarded packets |
| A | 0 | 27894 | 1 |
| B | 0 | 29996 | 1 |
| C | 0 | 27880 | 1 |
| D | 0 | 26322 | 1 |
| Quadrant | Total seconds | Saturated seconds | Saturation percentage |
|---|---|---|---|
| A | 6490 | 96 | 1.479199% |
| B | 6600 | 130 | 1.969697% |
| C | 6601 | 66 | 0.999849% |
| D | 6601 | 63 | 0.954401% |
Noise dominated data is calculated using 1-second bins in cleaned event files. If a bin has >2000 counts, and if more than 50% of those come from <1% of pixels, then it is considered to be noise-dominated and hence unusable.
| Quadrant | # 1 sec bins | Bins with >0 counts | Bins with >2000 counts | High rate bins dominated by noise | Noise dominated (total time) | Noise dominated (detector-on time) | Marked lightcurve |
|---|---|---|---|---|---|---|---|
| A | 7100 | 6492 | 314 | 314 | 4.42% | 4.84% | 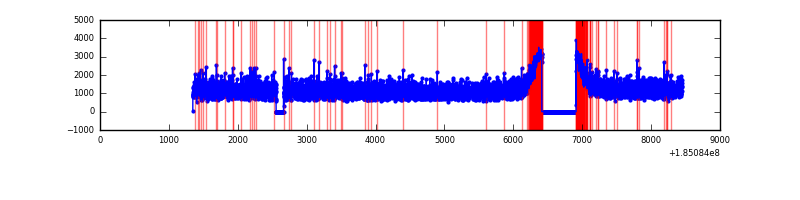 |
| B | 7100 | 6601 | 446 | 446 | 6.28% | 6.76% | 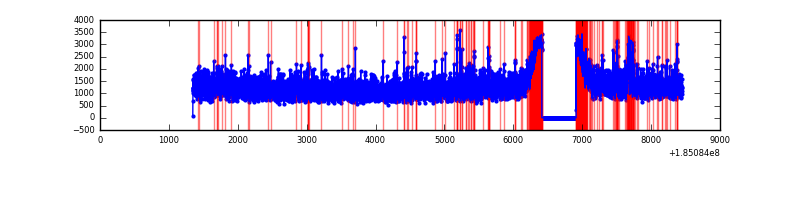 |
| C | 7101 | 6602 | 321 | 321 | 4.52% | 4.86% | 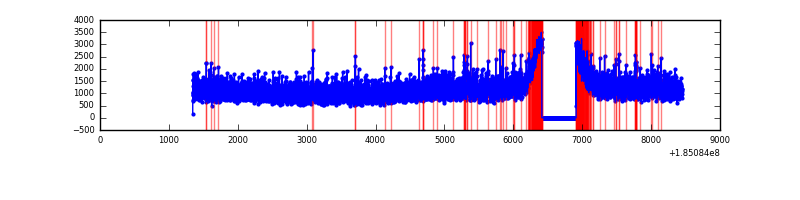 |
| D | 7101 | 6602 | 255 | 255 | 3.59% | 3.86% | 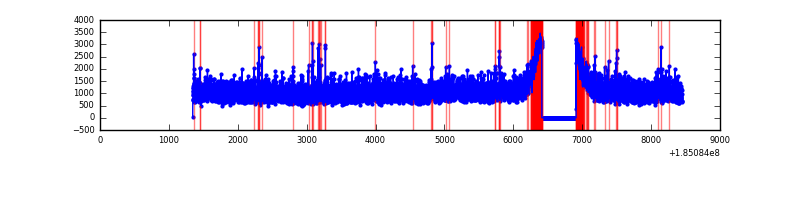 |
Top three noisy pixels from each quadrant. If the there are fewer than three noisy pixels in the level2.evt file, extra rows are filled as -1
| Pixel properties | Quadrant properties | ||||||
|---|---|---|---|---|---|---|---|
| Quadrant | DetID | PixID | Counts | Sigma | Mean | Median | Sigma |
| A | 10 | 233 | 12828 | 22.01 | 2024 | 2044 | 489.9 |
| A | 15 | 17 | 8247 | 12.66 | 2024 | 2044 | 489.9 |
| A | 11 | 79 | 6804 | 9.72 | 2024 | 2044 | 489.9 |
| B | 14 | 53 | 130022 | 250.37 | 2150 | 2160 | 510.7 |
| B | 0 | 220 | 99258 | 190.13 | 2150 | 2160 | 510.7 |
| B | 0 | 182 | 56519 | 106.44 | 2150 | 2160 | 510.7 |
| C | 15 | 241 | 218219 | 398.95 | 1935 | 1999 | 542.0 |
| C | 9 | 52 | 7442 | 10.04 | 1935 | 1999 | 542.0 |
| C | -1 | -1 | -1 | -1.0 | 1935 | 1999 | 542.0 |
| D | 1 | 4 | 132883 | 222.41 | 1890 | 1956 | 588.7 |
| D | 0 | 25 | 39499 | 63.78 | 1890 | 1956 | 588.7 |
| D | 9 | 64 | 29165 | 46.22 | 1890 | 1956 | 588.7 |
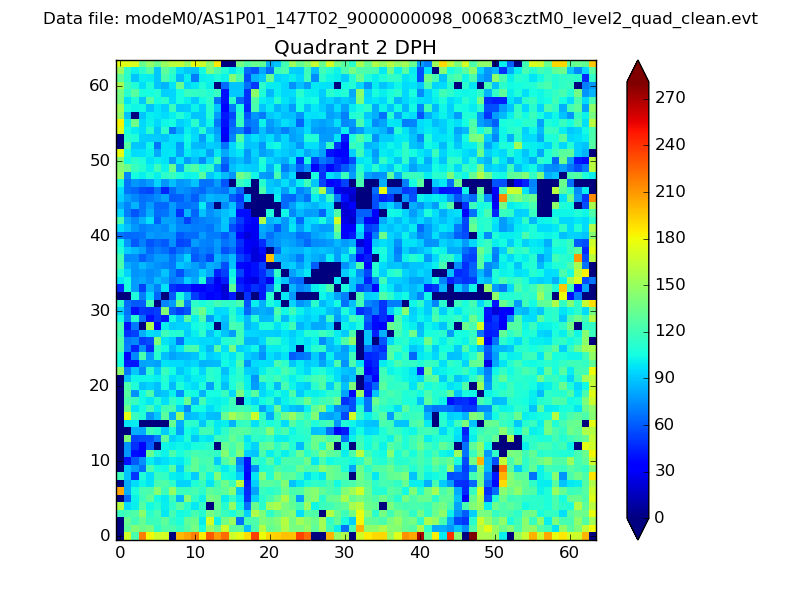
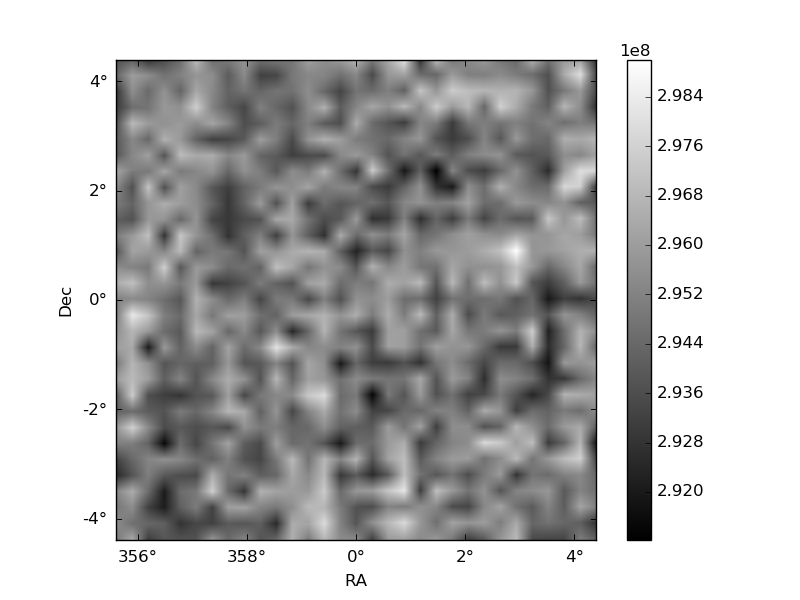
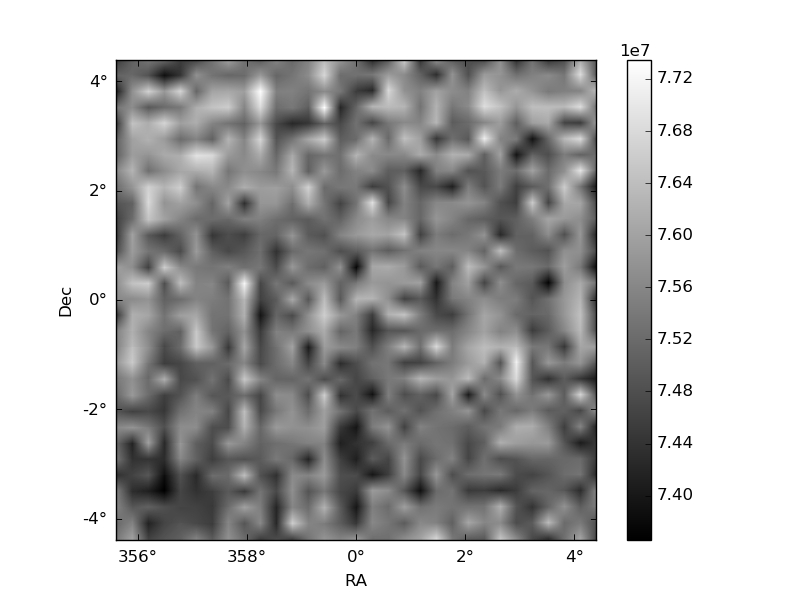
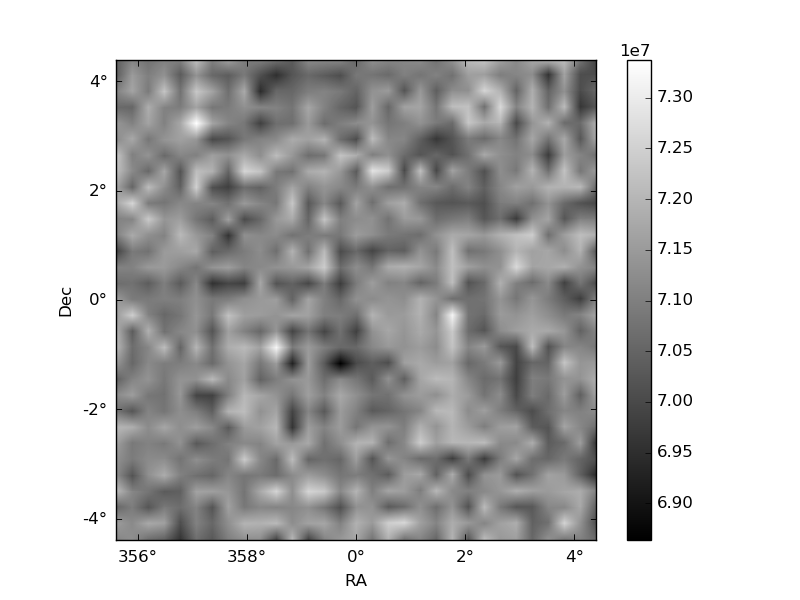
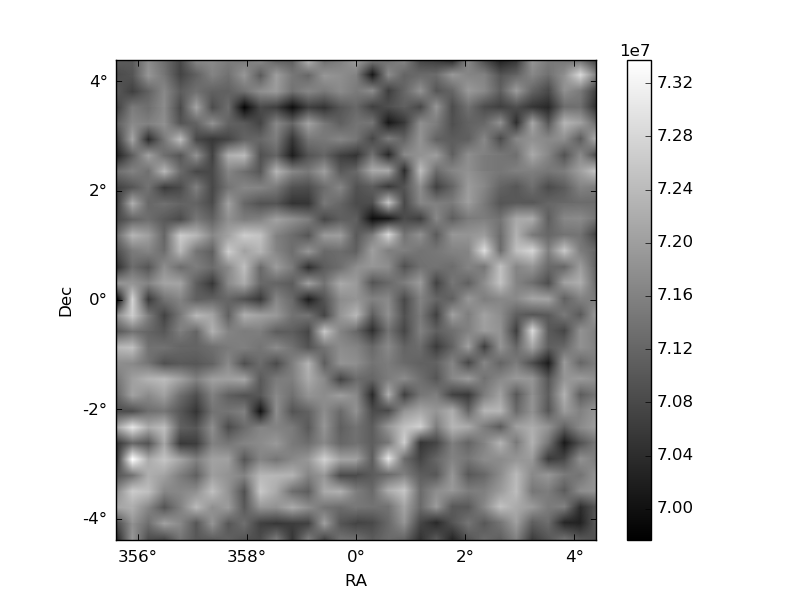
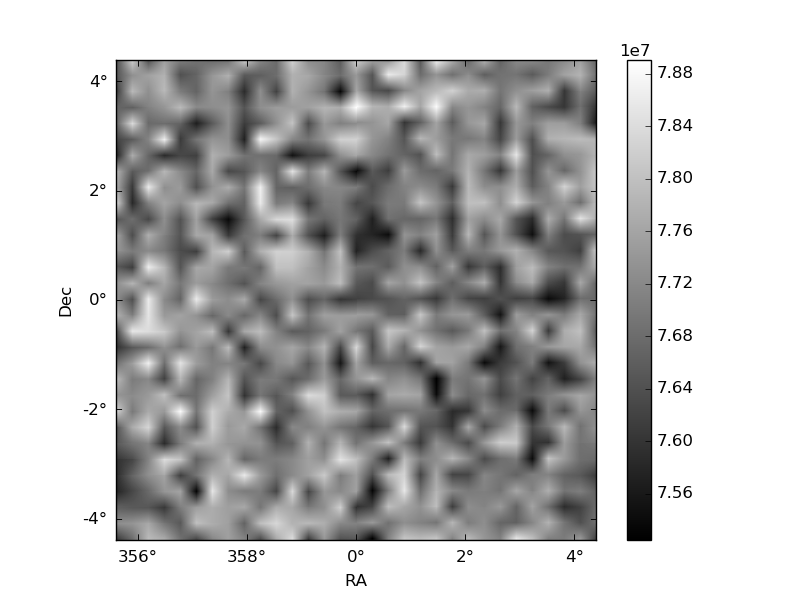
Histogram calculated using DETX and DETY for each event in the final _common_clean file
| Quadrant A | 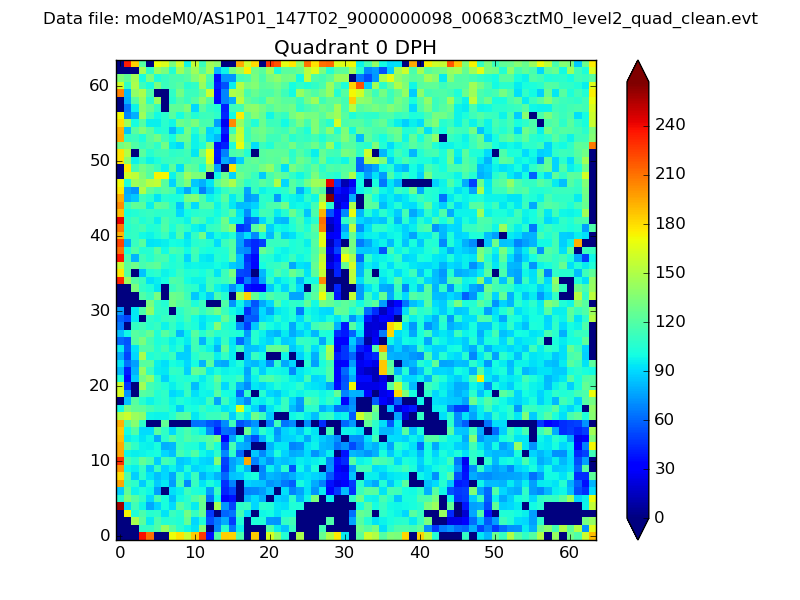 |
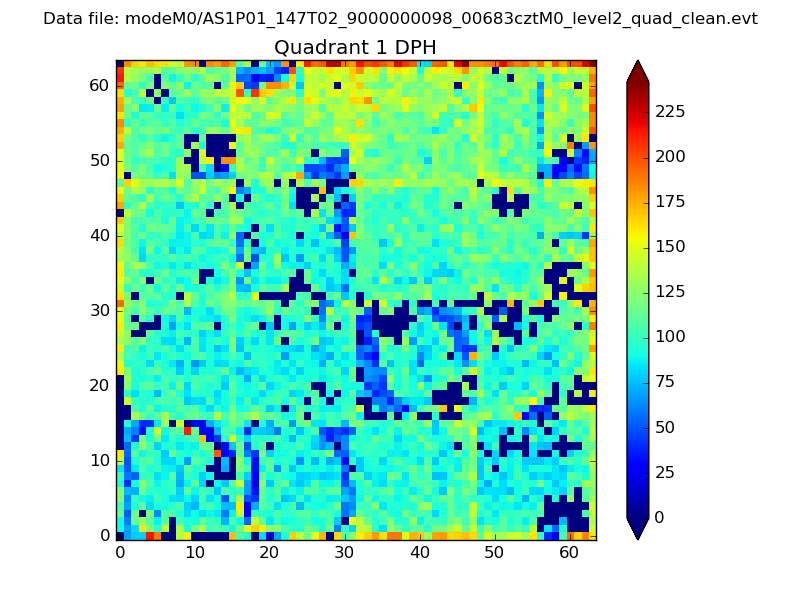 |
Quadrant B |
|---|---|---|---|
| Quadrant D | 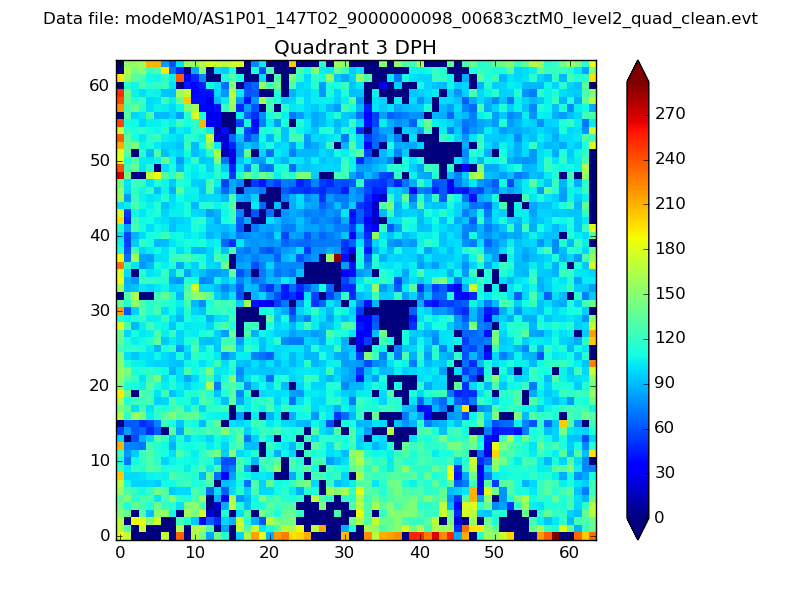 |
 |
Quadrant C |
| Plot type | Count rate plots | Images |
|---|---|---|
| Comparison with Poisson distribution Blue bars denote a histogram of data divided into 1 sec bins. Red curve is a Poisson curve with rate = median count rate of data. |
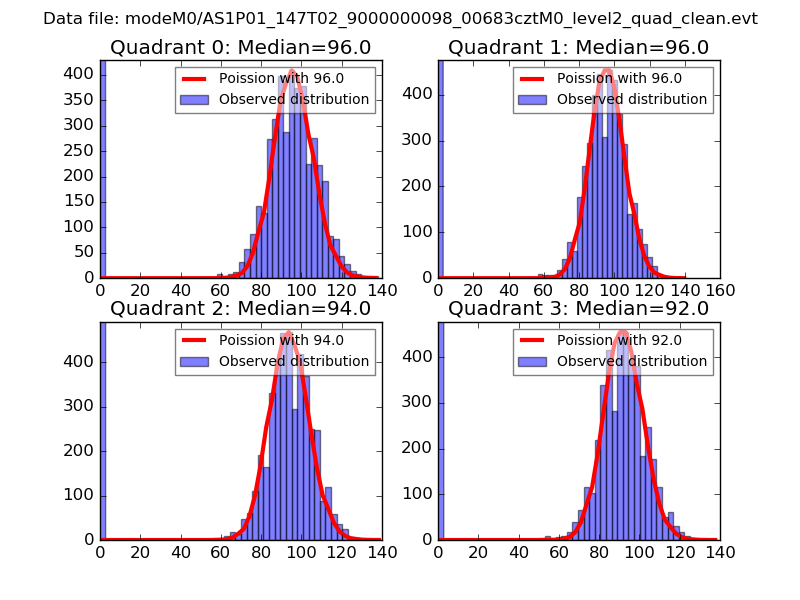 |
 |
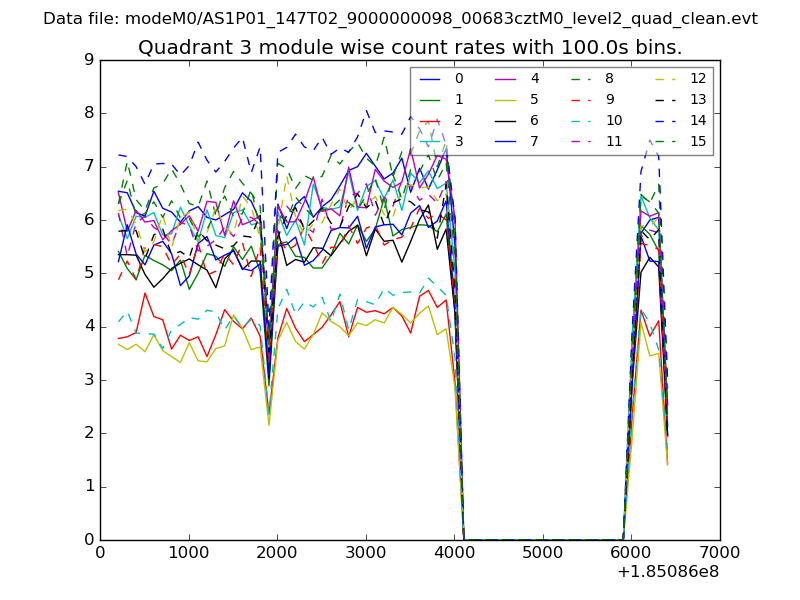
| Quadrant-wise count rates Data is divided into 100 sec bins |
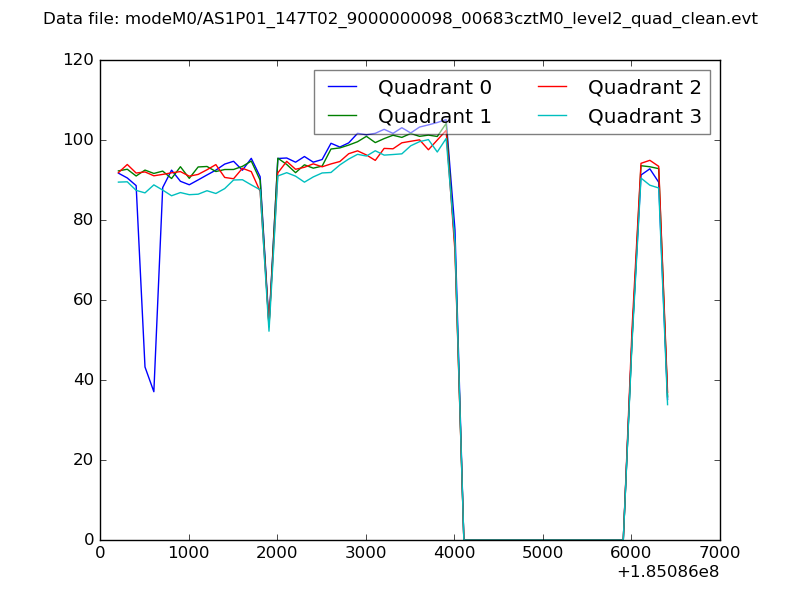 |
|
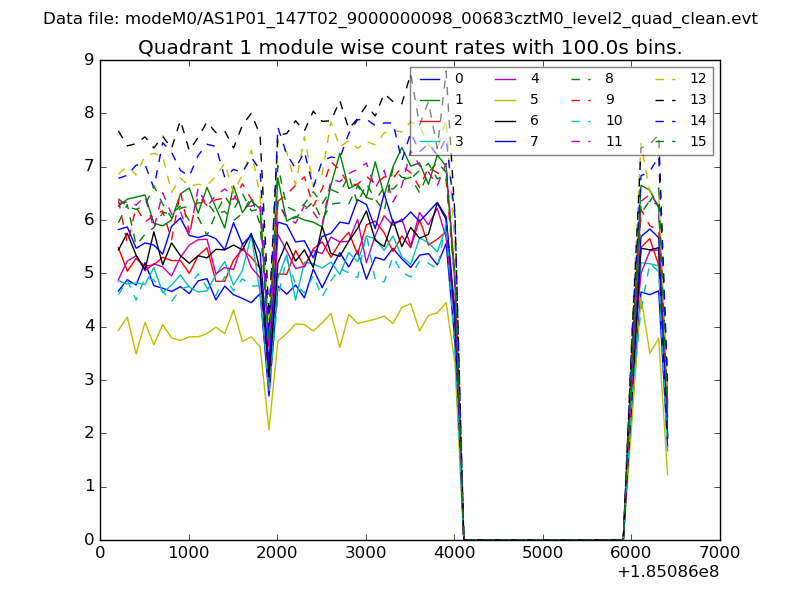
| Module-wise count rates for Quadrant A Data is divided into 100 sec bins |
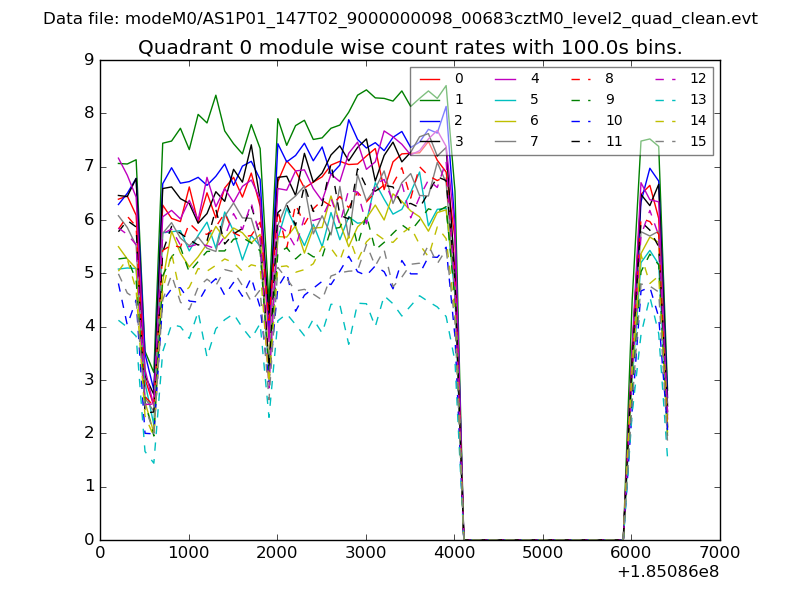 |
 |
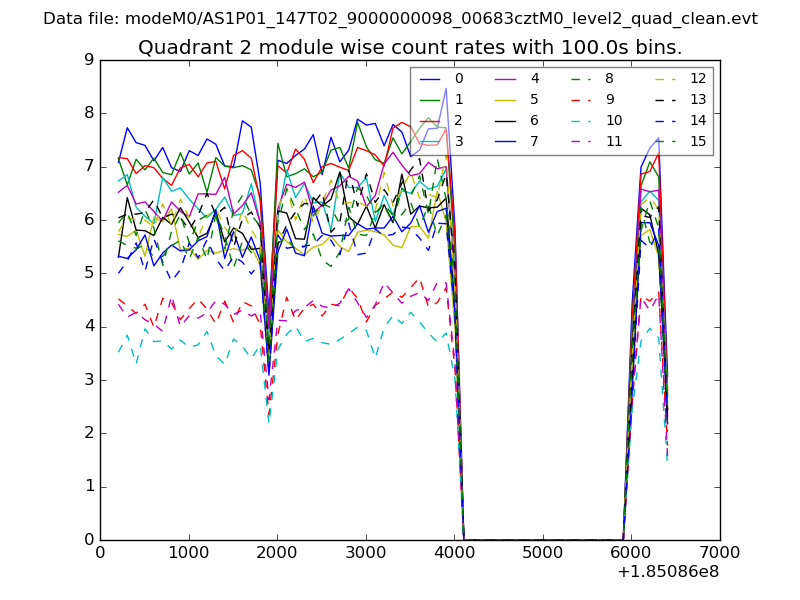
| Module-wise count rates for Quadrant B Data is divided into 100 sec bins |
 |
 |
| Module-wise count rates for Quadrant C Data is divided into 100 sec bins |
 |
 |
| Module-wise count rates for Quadrant D Data is divided into 100 sec bins |
 |
 |
| Parameter | Plot |
|---|---|
| CZT HV Monitor | 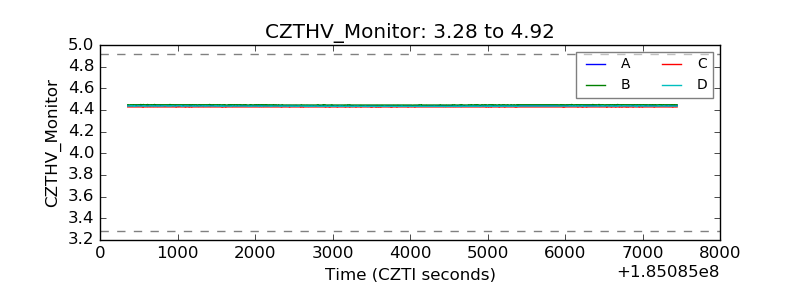 |
| D_VDD |  |
| Temperature 1 | 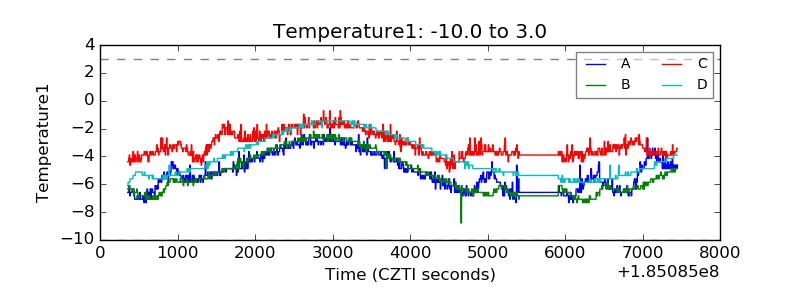 |
| Veto HV Monitor | 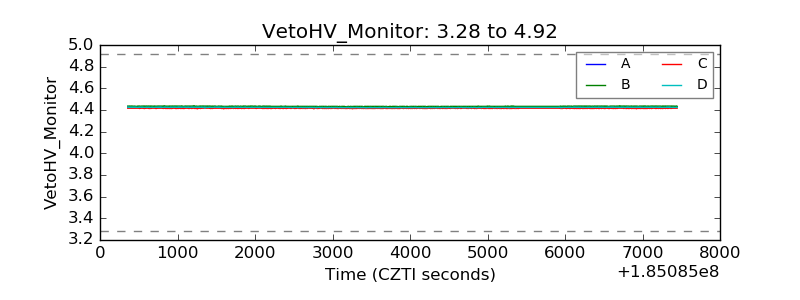 |
| Veto LLD | 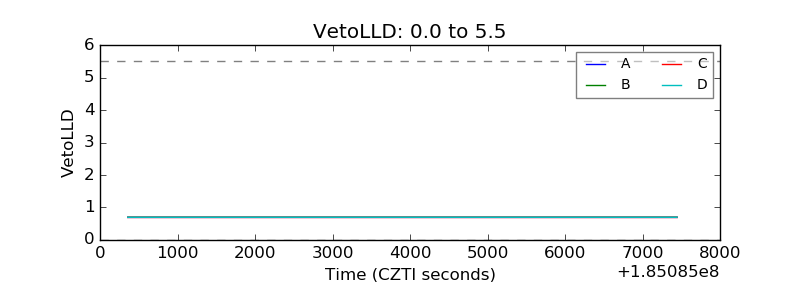 |
| Alpha Counter | 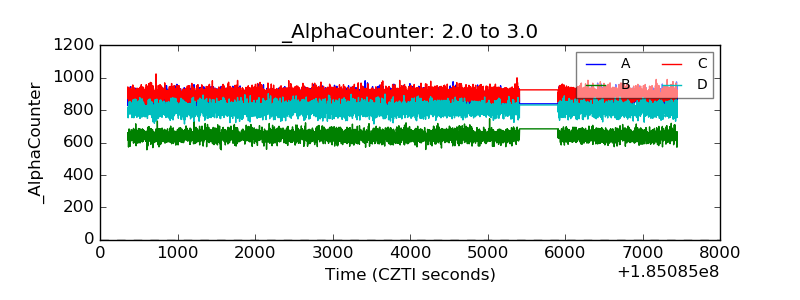 |
| _CPM_Rate | 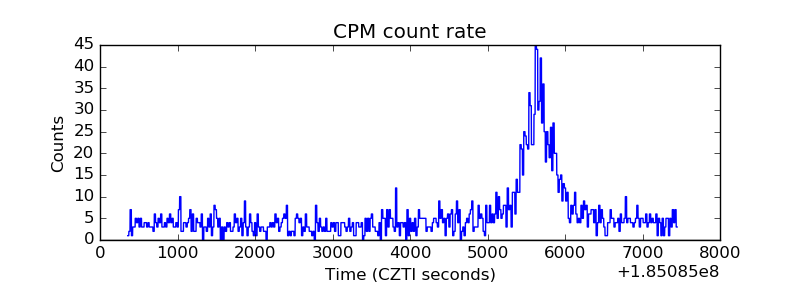 |
| CZT Counter | 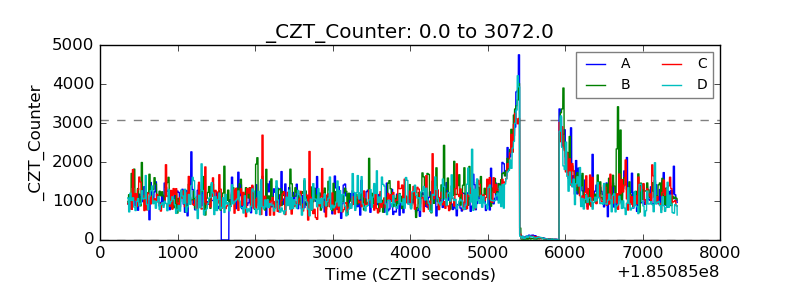 |
| +2.5 Volts monitor |  |
| +5 Volts monitor |  |
| _ROLL_ROT | 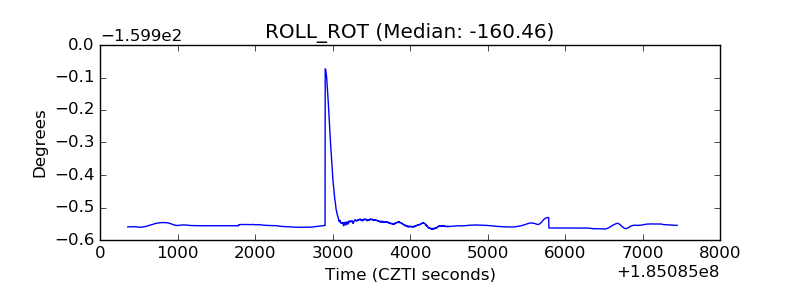 |
| _Roll_DEC | 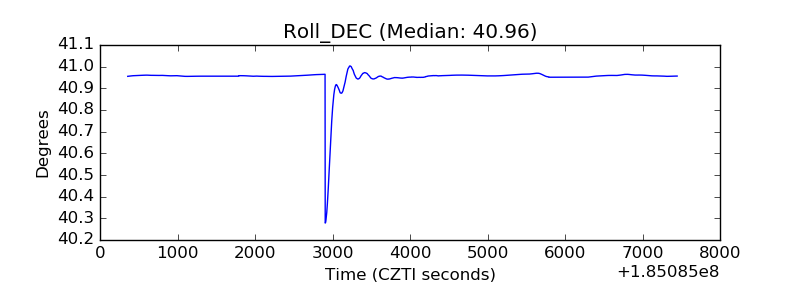 |
| _Roll_RA | 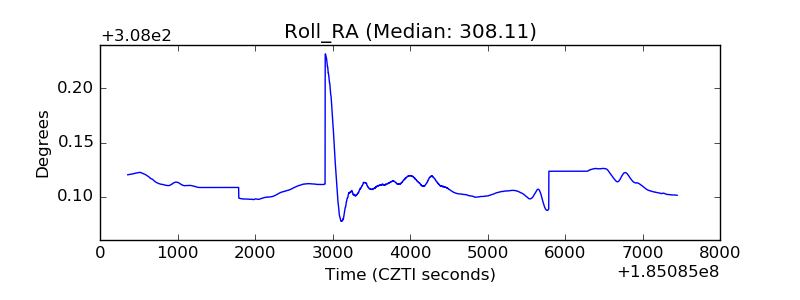 |
| Veto Counter | 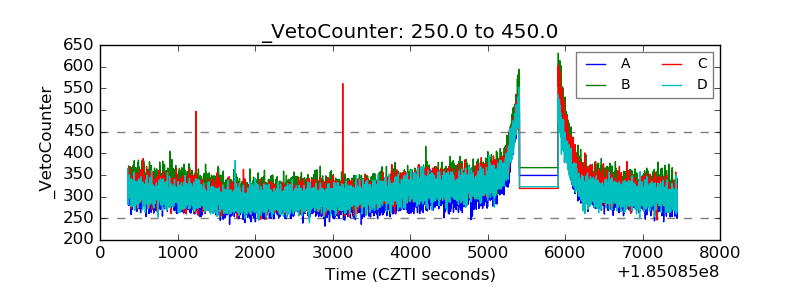 |