| Param | Original file | Final file |
|---|---|---|
| Filename | modeM0/AS1P01_147T02_9000000098_00684cztM0_level2.evt | modeM0/AS1P01_147T02_9000000098_00684cztM0_level2_quad_clean.evt |
| Size (bytes) | 1,509,301,440 | 72,538,560 |
| Size | 1.4 GB | 69.2 MB |
| Events in quadrant A | 9,344,468 | 442,452 |
| Events in quadrant B | 9,665,223 | 428,343 |
| Events in quadrant C | 17,508,610 | 382,813 |
| Events in quadrant D | 8,701,058 | 425,231 |
| Mode SS | |||
|---|---|---|---|
| Quadrant | BADHDUFLAG | Total packets | Discarded packets |
| A | 0 | 150 | 0 |
| B | 0 | 150 | 0 |
| C | 0 | 150 | 0 |
| D | 0 | 150 | 0 |
| Mode M0 | |||
|---|---|---|---|
| Quadrant | BADHDUFLAG | Total packets | Discarded packets |
| A | 0 | 33020 | 1 |
| B | 0 | 34007 | 1 |
| C | 0 | 58006 | 1 |
| D | 0 | 31122 | 2 |
| Quadrant | Total seconds | Saturated seconds | Saturation percentage |
|---|---|---|---|
| A | 7459 | 105 | 1.407695% |
| B | 7297 | 92 | 1.260792% |
| C | 7459 | 4119 | 55.221880% |
| D | 7458 | 113 | 1.515152% |
Noise dominated data is calculated using 1-second bins in cleaned event files. If a bin has >2000 counts, and if more than 50% of those come from <1% of pixels, then it is considered to be noise-dominated and hence unusable.
| Quadrant | # 1 sec bins | Bins with >0 counts | Bins with >2000 counts | High rate bins dominated by noise | Noise dominated (total time) | Noise dominated (detector-on time) | Marked lightcurve |
|---|---|---|---|---|---|---|---|
| A | 7474 | 7460 | 543 | 543 | 7.27% | 7.28% | 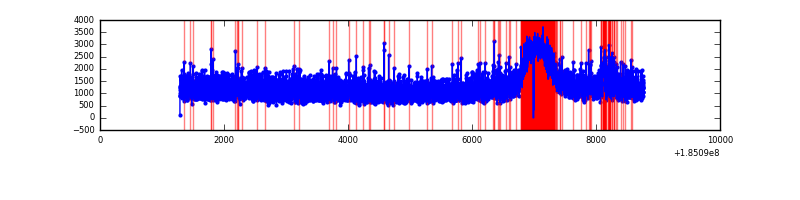 |
| B | 7474 | 7298 | 623 | 623 | 8.34% | 8.54% | 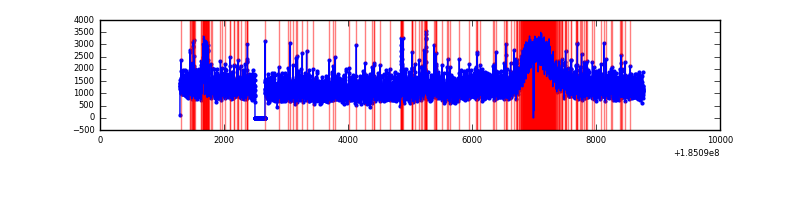 |
| C | 7474 | 7460 | 4765 | 4765 | 63.75% | 63.87% | 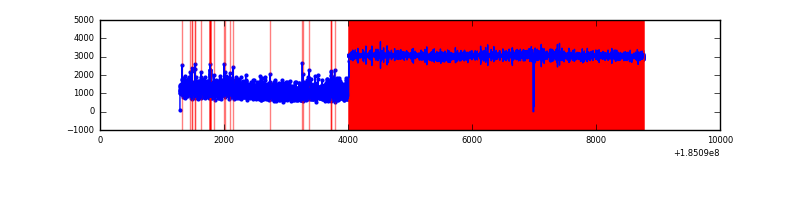 |
| D | 7473 | 7459 | 496 | 496 | 6.64% | 6.65% | 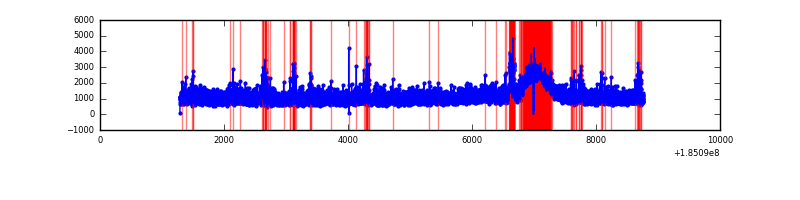 |
Top three noisy pixels from each quadrant. If the there are fewer than three noisy pixels in the level2.evt file, extra rows are filled as -1
| Pixel properties | Quadrant properties | ||||||
|---|---|---|---|---|---|---|---|
| Quadrant | DetID | PixID | Counts | Sigma | Mean | Median | Sigma |
| A | 15 | 171 | 109182 | 182.88 | 2395 | 2410 | 583.8 |
| A | 10 | 233 | 44731 | 72.49 | 2395 | 2410 | 583.8 |
| A | 11 | 79 | 9606 | 12.33 | 2395 | 2410 | 583.8 |
| B | 7 | 221 | 114599 | 192.43 | 2428 | 2439 | 582.9 |
| B | 14 | 53 | 100436 | 168.13 | 2428 | 2439 | 582.9 |
| B | 8 | 38 | 90592 | 151.24 | 2428 | 2439 | 582.9 |
| C | 3 | 191 | 7614477 | 13586.8 | 2002 | 2071 | 560.3 |
| C | 3 | 127 | 681590 | 1212.82 | 2002 | 2071 | 560.3 |
| C | 3 | 95 | 301789 | 534.94 | 2002 | 2071 | 560.3 |
| D | 1 | 4 | 246090 | 360.34 | 2173 | 2255 | 676.7 |
| D | 13 | 101 | 177447 | 258.9 | 2173 | 2255 | 676.7 |
| D | 0 | 25 | 105025 | 151.87 | 2173 | 2255 | 676.7 |
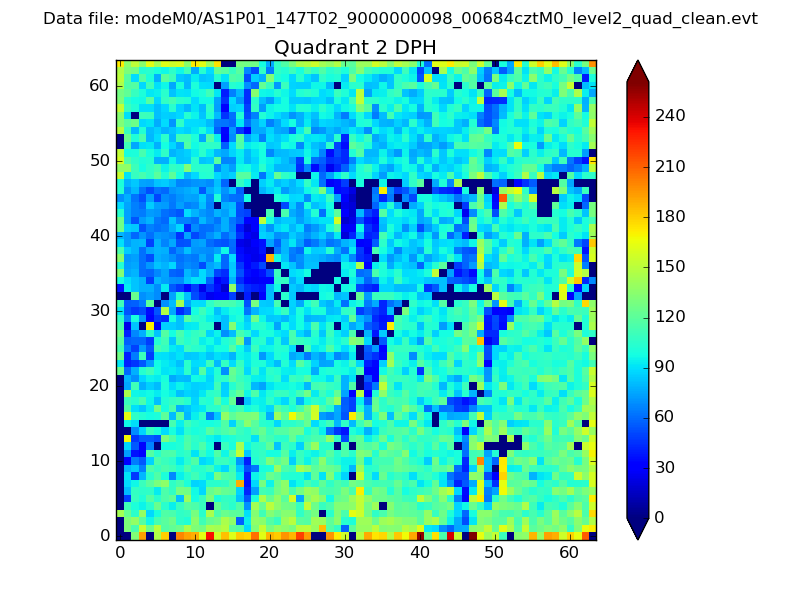
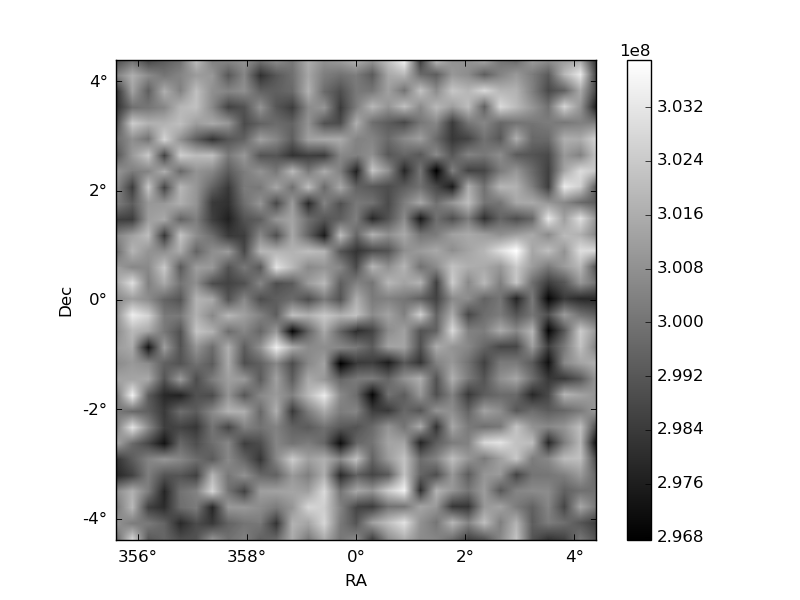
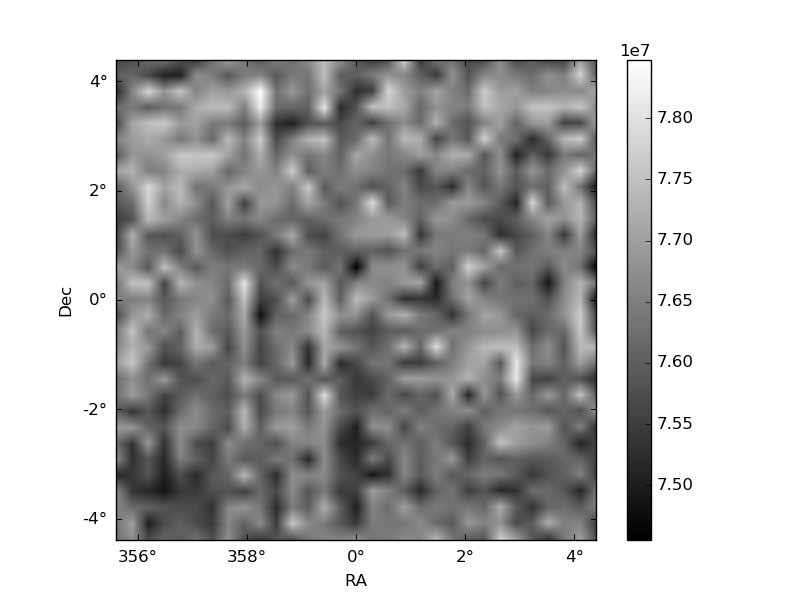
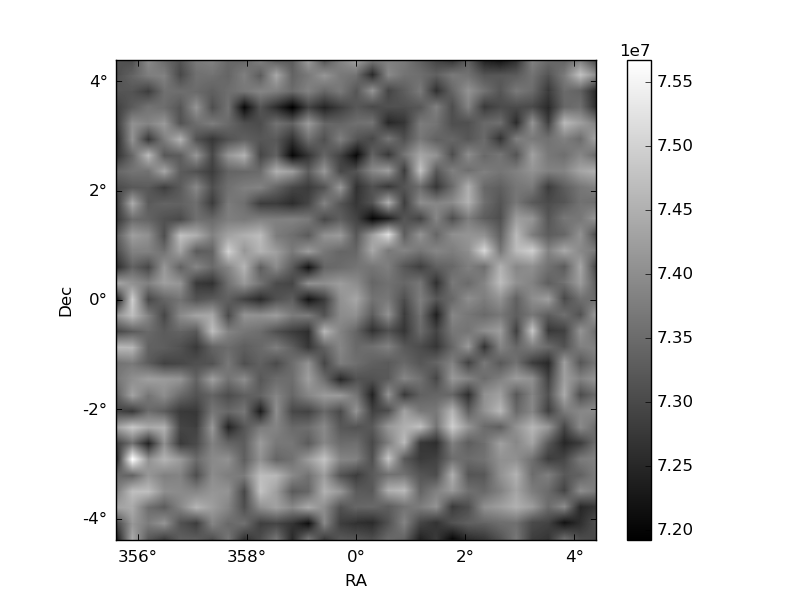
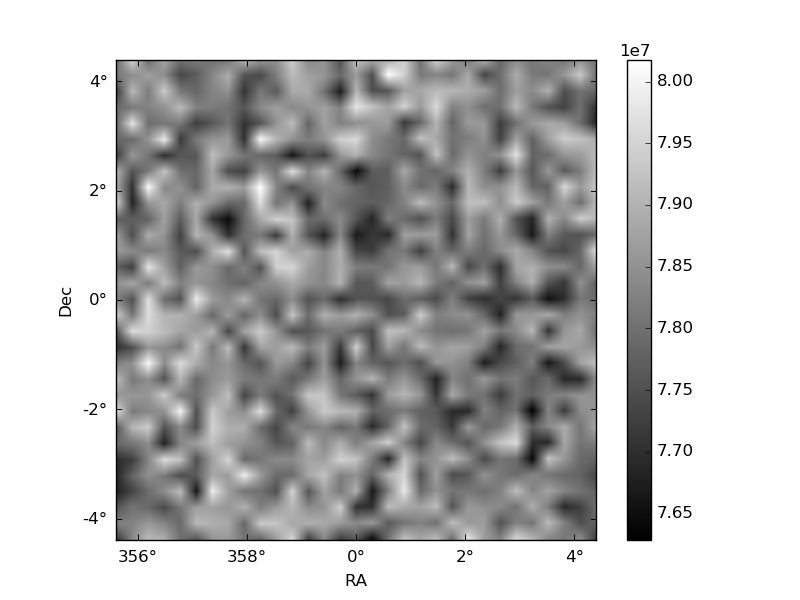
Histogram calculated using DETX and DETY for each event in the final _common_clean file
| Quadrant A | 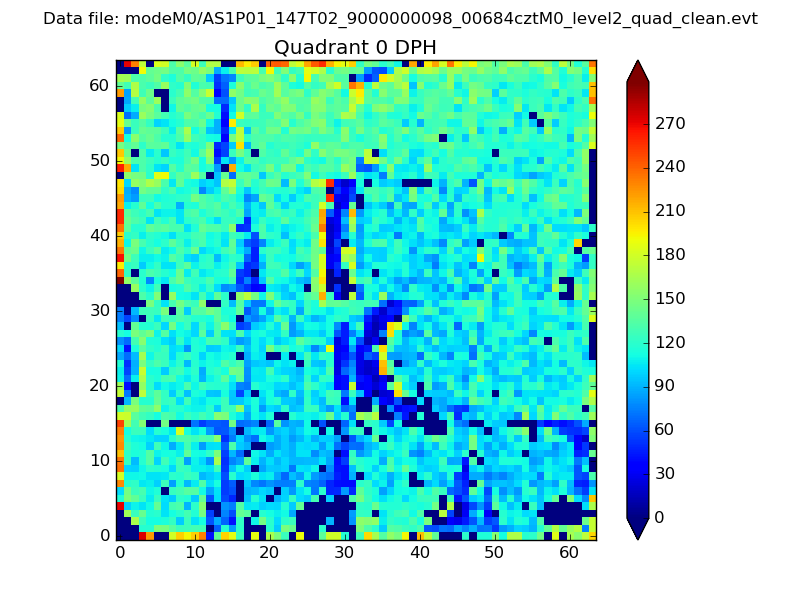 |
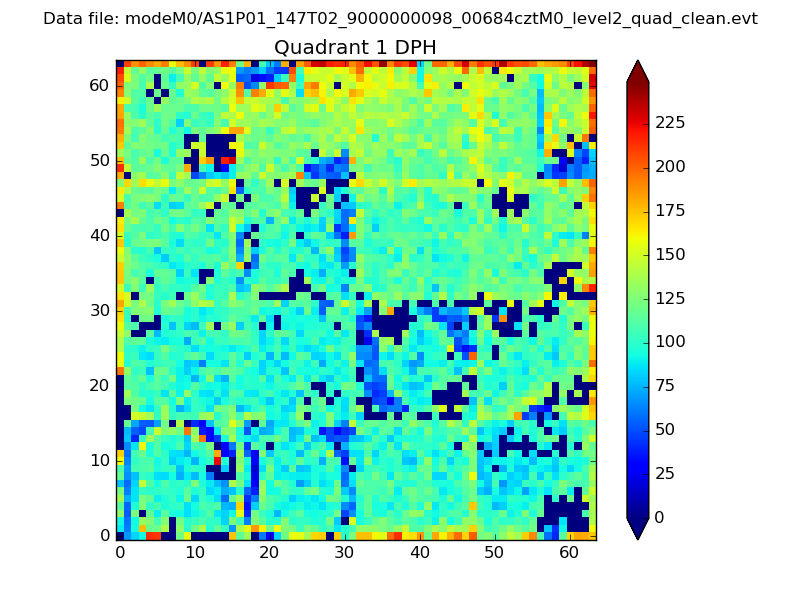 |
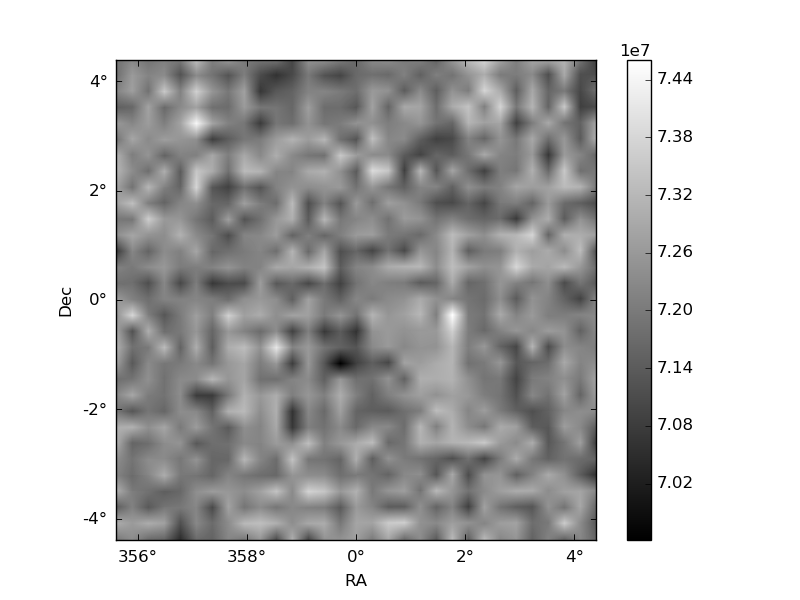
Quadrant B |
|---|---|---|---|
| Quadrant D | 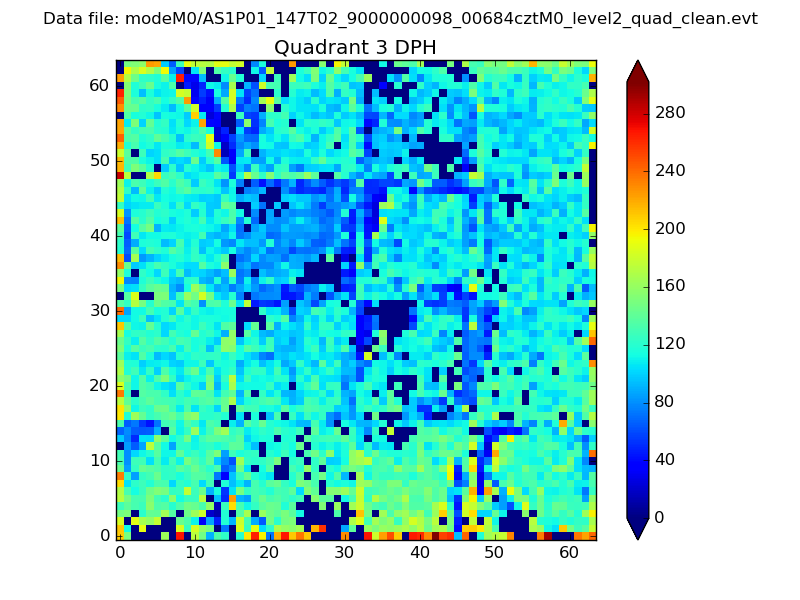 |
 |
Quadrant C |
| Plot type | Count rate plots | Images |
|---|---|---|
| Comparison with Poisson distribution Blue bars denote a histogram of data divided into 1 sec bins. Red curve is a Poisson curve with rate = median count rate of data. |
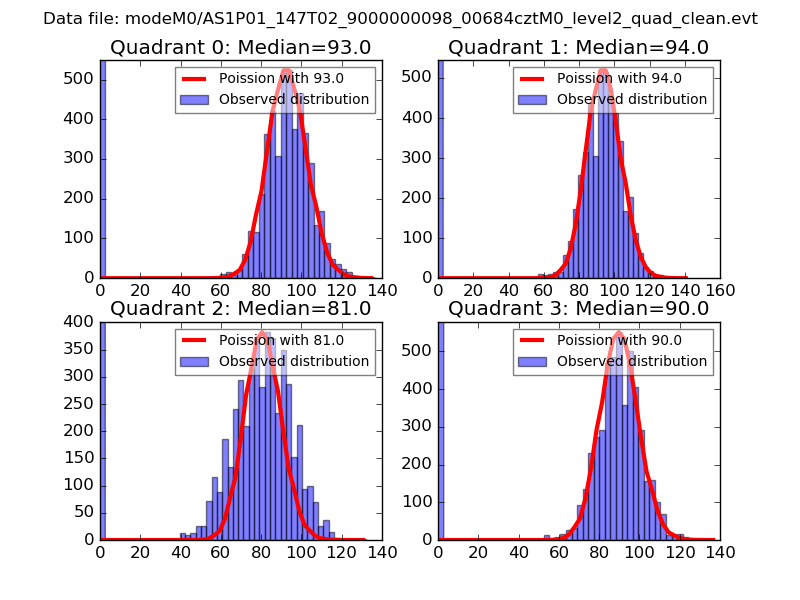 |
 |
| Quadrant-wise count rates Data is divided into 100 sec bins |
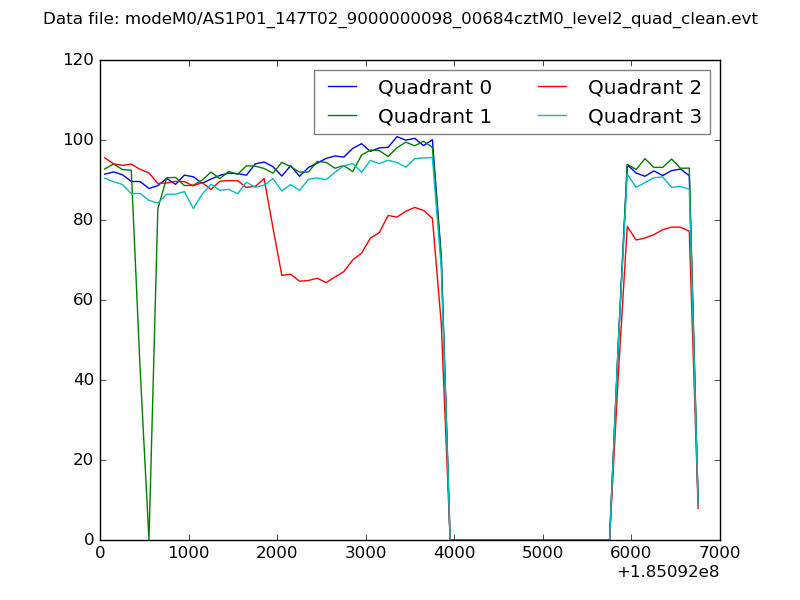 |
|
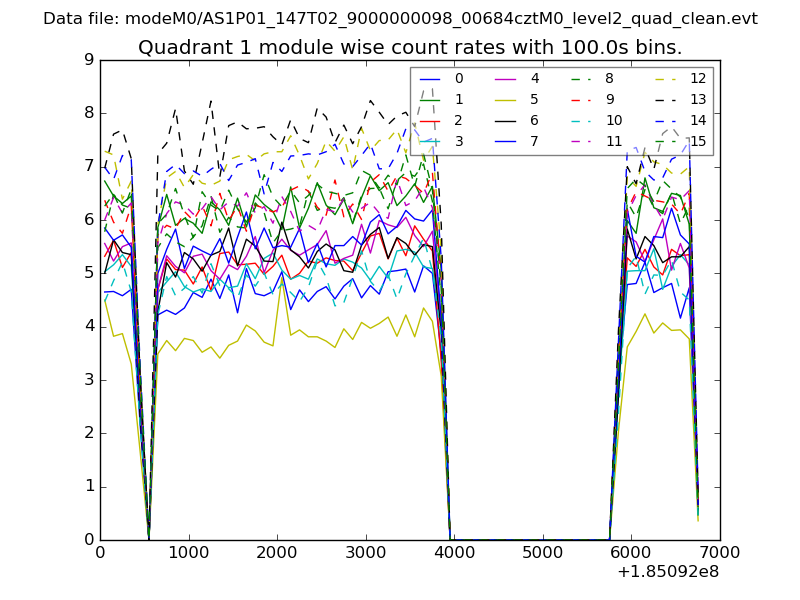
| Module-wise count rates for Quadrant A Data is divided into 100 sec bins |
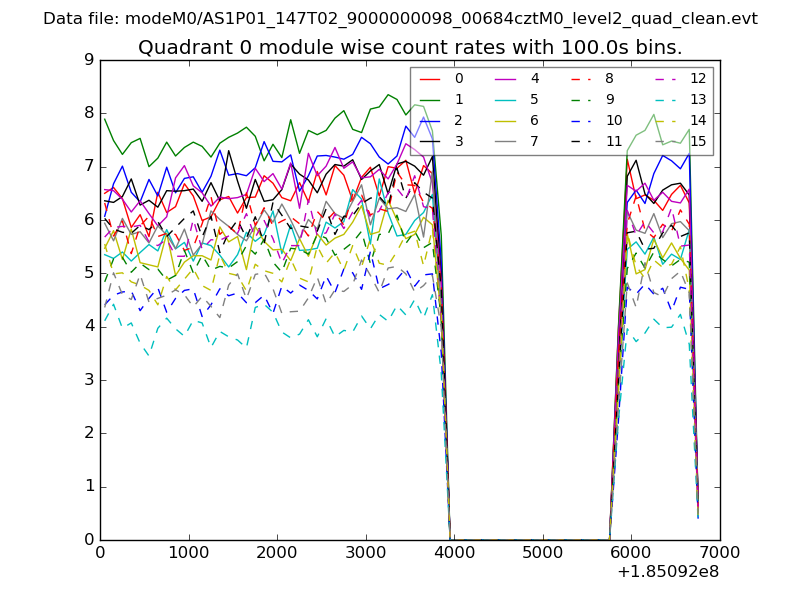 |
 |
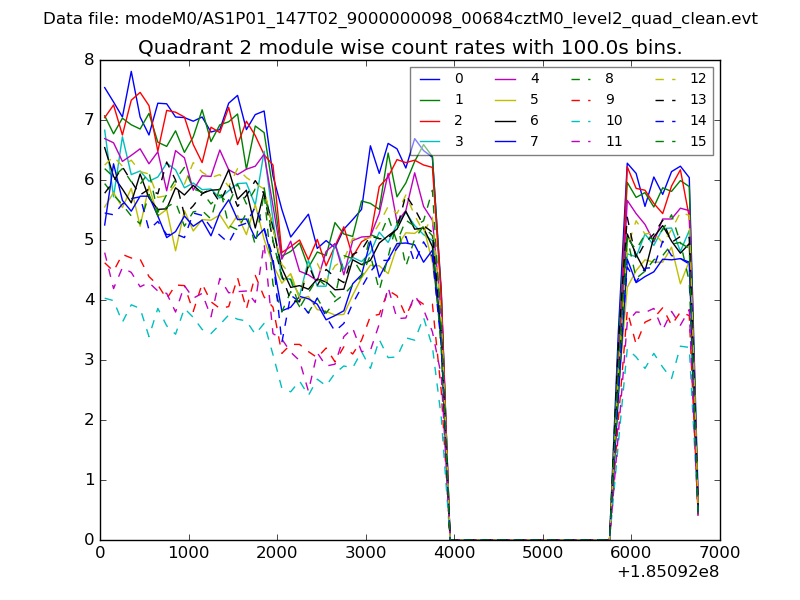
| Module-wise count rates for Quadrant B Data is divided into 100 sec bins |
 |
 |
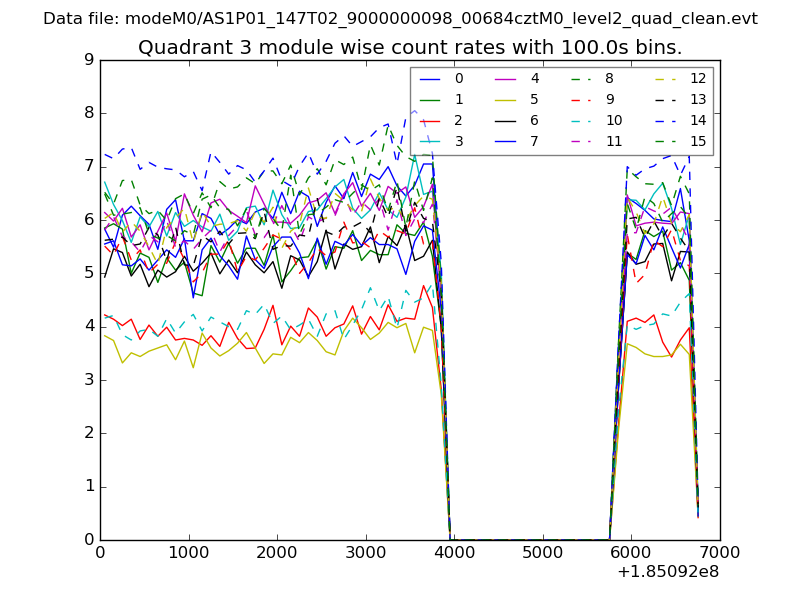
| Module-wise count rates for Quadrant C Data is divided into 100 sec bins |
 |
 |
| Module-wise count rates for Quadrant D Data is divided into 100 sec bins |
 |
 |
| Parameter | Plot |
|---|---|
| CZT HV Monitor | 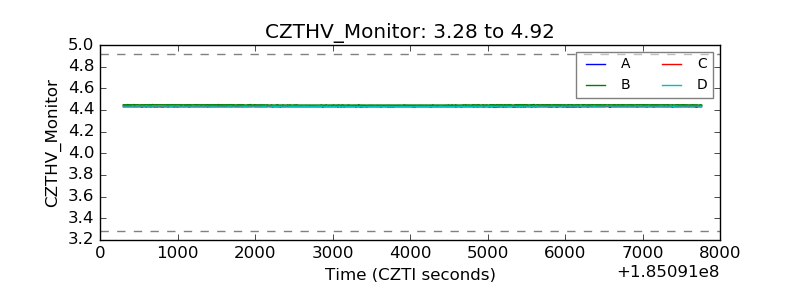 |
| D_VDD | 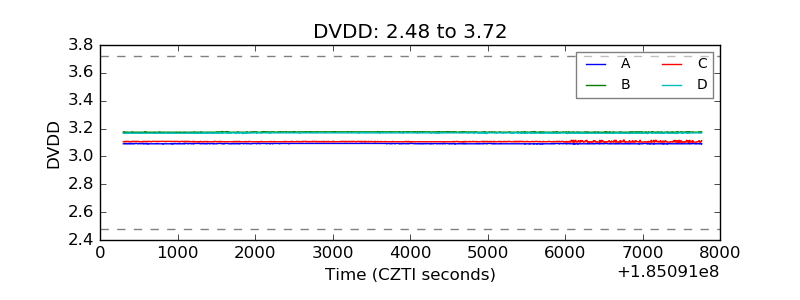 |
| Temperature 1 | 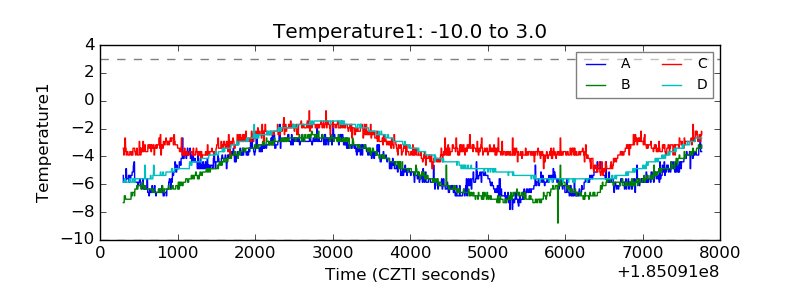 |
| Veto HV Monitor | 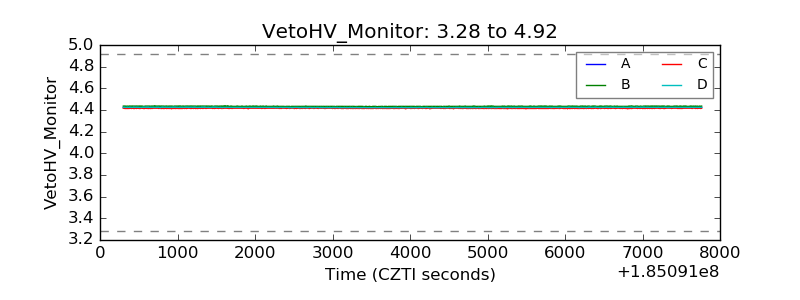 |
| Veto LLD | 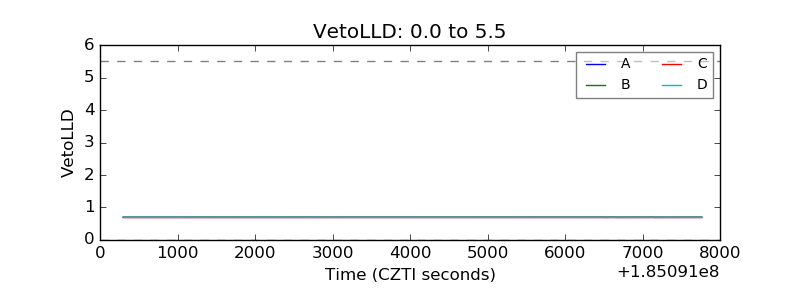 |
| Alpha Counter | 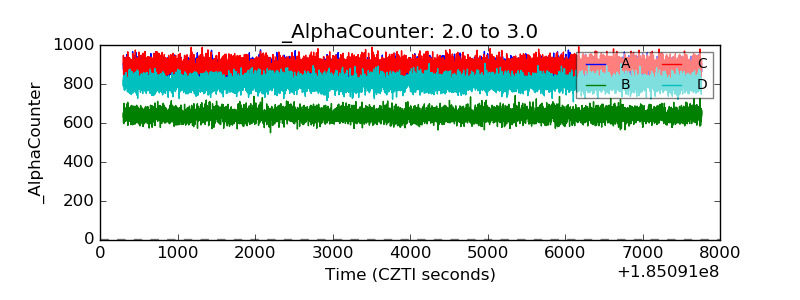 |
| _CPM_Rate | 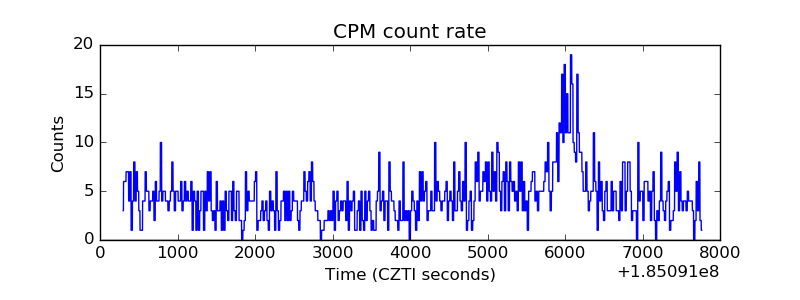 |
| CZT Counter | 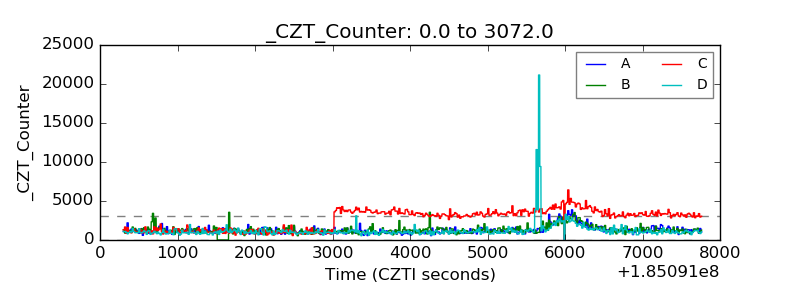 |
| +2.5 Volts monitor |  |
| +5 Volts monitor |  |
| _ROLL_ROT | 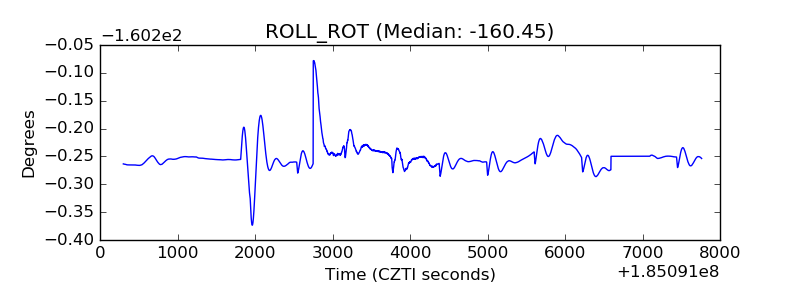 |
| _Roll_DEC | 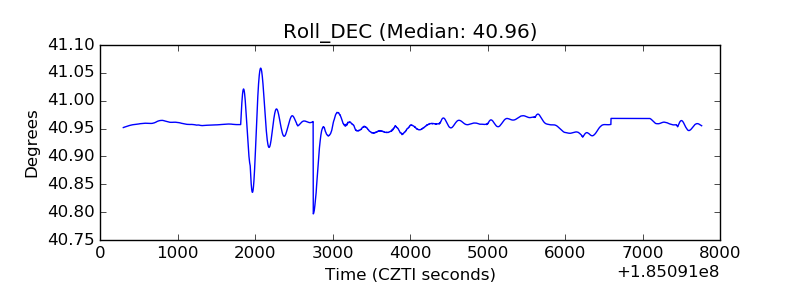 |
| _Roll_RA | 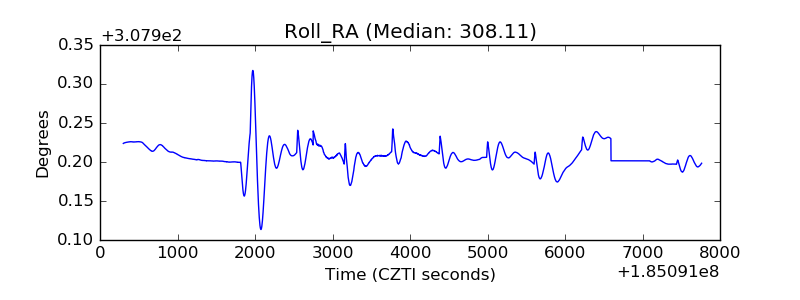 |
| Veto Counter | 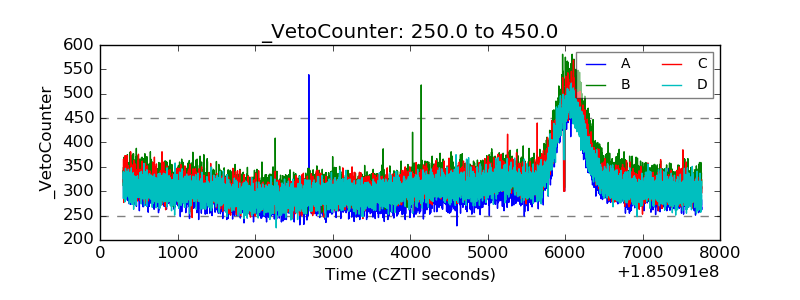 |