| Param | Original file | Final file |
|---|---|---|
| Filename | modeM0/AS1P01_147T02_9000000098_00685cztM0_level2.evt | modeM0/AS1P01_147T02_9000000098_00685cztM0_level2_quad_clean.evt |
| Size (bytes) | 1,650,234,240 | 73,399,680 |
| Size | 1.5 GB | 70.0 MB |
| Events in quadrant A | 8,739,712 | 468,392 |
| Events in quadrant B | 8,944,378 | 470,784 |
| Events in quadrant C | 21,343,445 | 357,159 |
| Events in quadrant D | 10,490,935 | 437,903 |
| Mode SS | |||
|---|---|---|---|
| Quadrant | BADHDUFLAG | Total packets | Discarded packets |
| A | 0 | 140 | 0 |
| B | 0 | 140 | 0 |
| C | 0 | 140 | 0 |
| D | 0 | 140 | 0 |
| Mode M0 | |||
|---|---|---|---|
| Quadrant | BADHDUFLAG | Total packets | Discarded packets |
| A | 0 | 30929 | 1 |
| B | 0 | 31527 | 1 |
| C | 0 | 69374 | 1 |
| D | 0 | 36155 | 1 |
| Quadrant | Total seconds | Saturated seconds | Saturation percentage |
|---|---|---|---|
| A | 6979 | 65 | 0.931366% |
| B | 6979 | 59 | 0.845393% |
| C | 6979 | 6146 | 88.064193% |
| D | 6979 | 288 | 4.126666% |
Noise dominated data is calculated using 1-second bins in cleaned event files. If a bin has >2000 counts, and if more than 50% of those come from <1% of pixels, then it is considered to be noise-dominated and hence unusable.
| Quadrant | # 1 sec bins | Bins with >0 counts | Bins with >2000 counts | High rate bins dominated by noise | Noise dominated (total time) | Noise dominated (detector-on time) | Marked lightcurve |
|---|---|---|---|---|---|---|---|
| A | 6994 | 6980 | 544 | 544 | 7.78% | 7.79% | 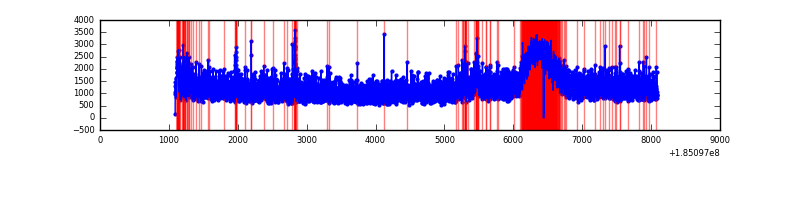 |
| B | 6994 | 6980 | 504 | 504 | 7.21% | 7.22% | 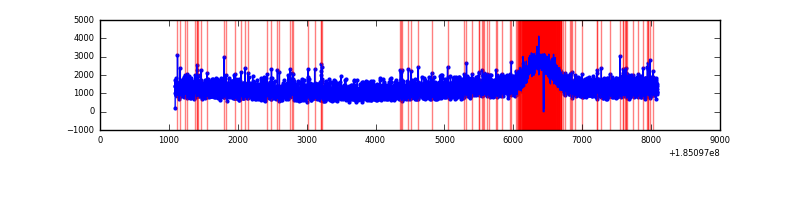 |
| C | 6994 | 6980 | 6977 | 6977 | 99.76% | 99.96% | 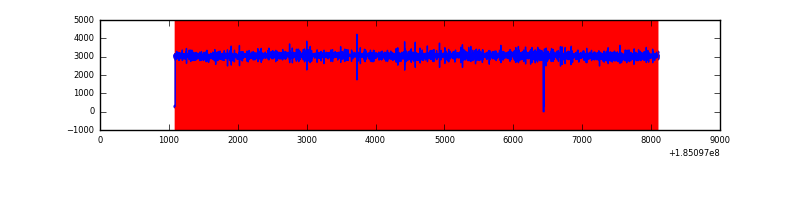 |
| D | 6994 | 6980 | 1178 | 1178 | 16.84% | 16.88% | 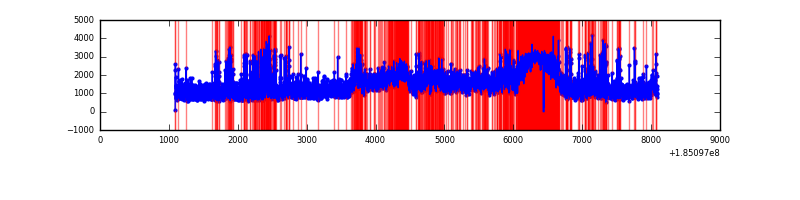 |
Top three noisy pixels from each quadrant. If the there are fewer than three noisy pixels in the level2.evt file, extra rows are filled as -1
| Pixel properties | Quadrant properties | ||||||
|---|---|---|---|---|---|---|---|
| Quadrant | DetID | PixID | Counts | Sigma | Mean | Median | Sigma |
| A | 15 | 171 | 99950 | 180.67 | 2228 | 2247 | 540.8 |
| A | 12 | 236 | 59510 | 105.89 | 2228 | 2247 | 540.8 |
| A | 12 | 133 | 27832 | 47.31 | 2228 | 2247 | 540.8 |
| B | 7 | 221 | 131894 | 235.17 | 2298 | 2310 | 551.0 |
| B | 0 | 220 | 40765 | 69.79 | 2298 | 2310 | 551.0 |
| B | 5 | 247 | 25440 | 41.98 | 2298 | 2310 | 551.0 |
| C | 3 | 191 | 11533572 | 23371.82 | 1757 | 1818 | 493.4 |
| C | 3 | 127 | 1026631 | 2077.03 | 1757 | 1818 | 493.4 |
| C | 3 | 95 | 505710 | 1021.26 | 1757 | 1818 | 493.4 |
| D | 1 | 84 | 1358609 | 2162.83 | 2018 | 2091 | 627.2 |
| D | 0 | 25 | 909451 | 1446.69 | 2018 | 2091 | 627.2 |
| D | 1 | 4 | 644624 | 1024.45 | 2018 | 2091 | 627.2 |
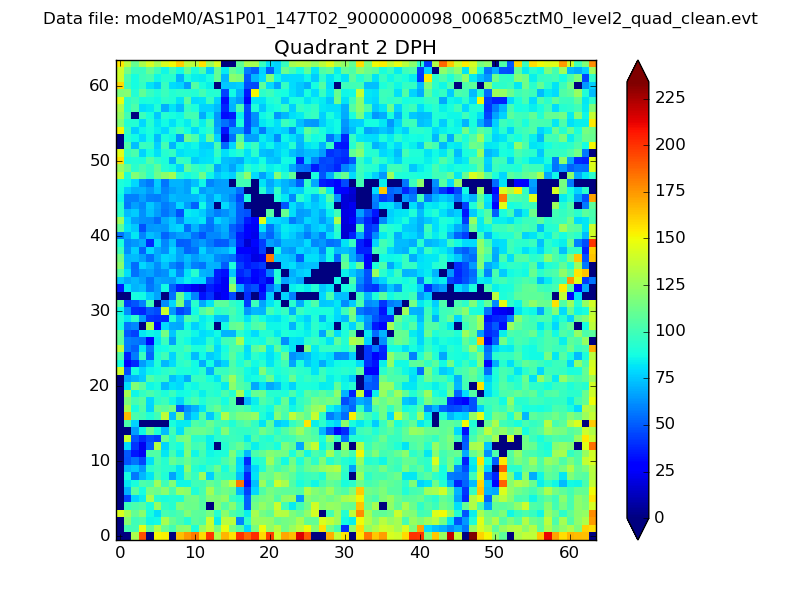
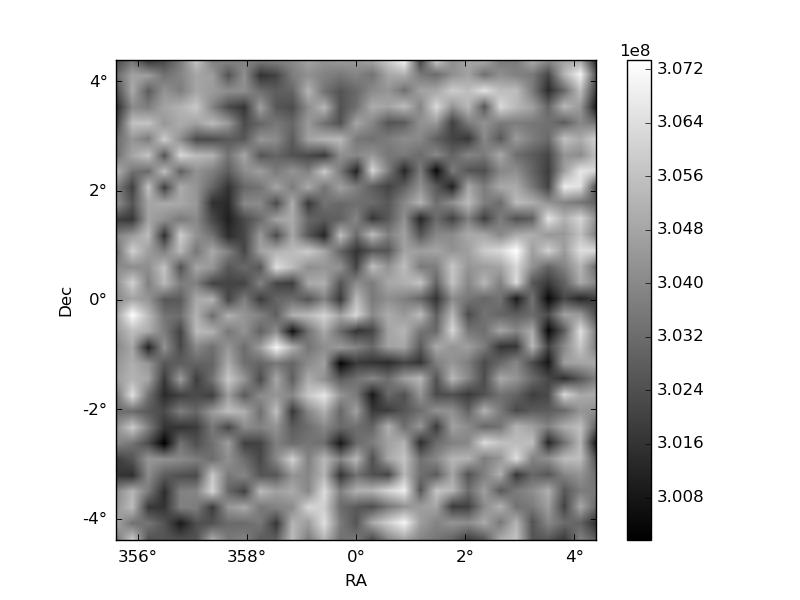
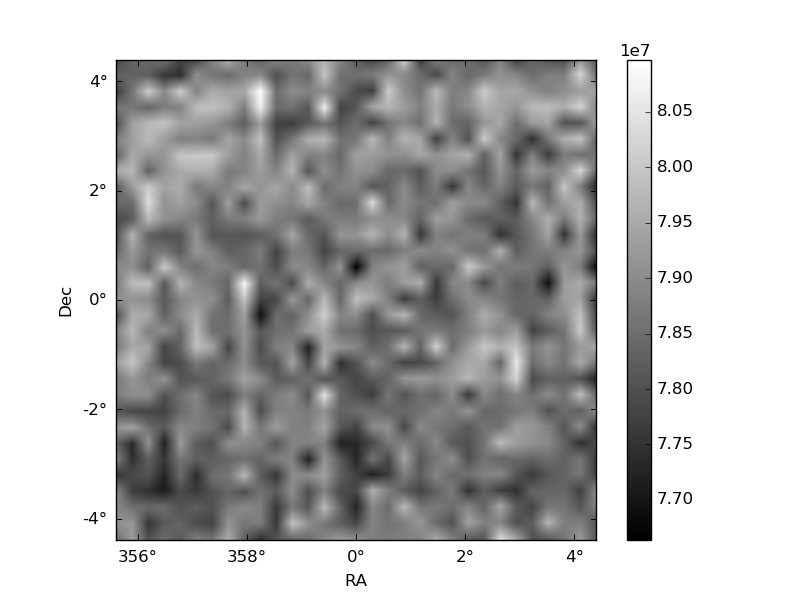
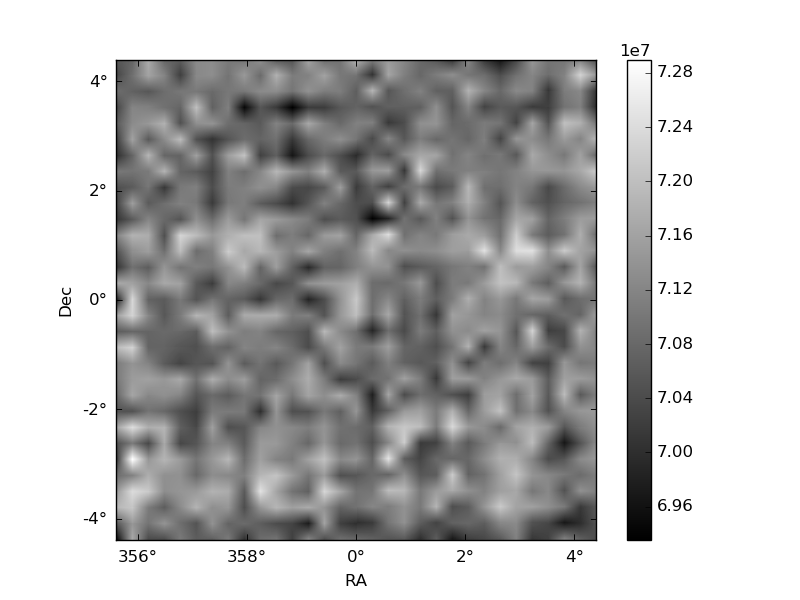
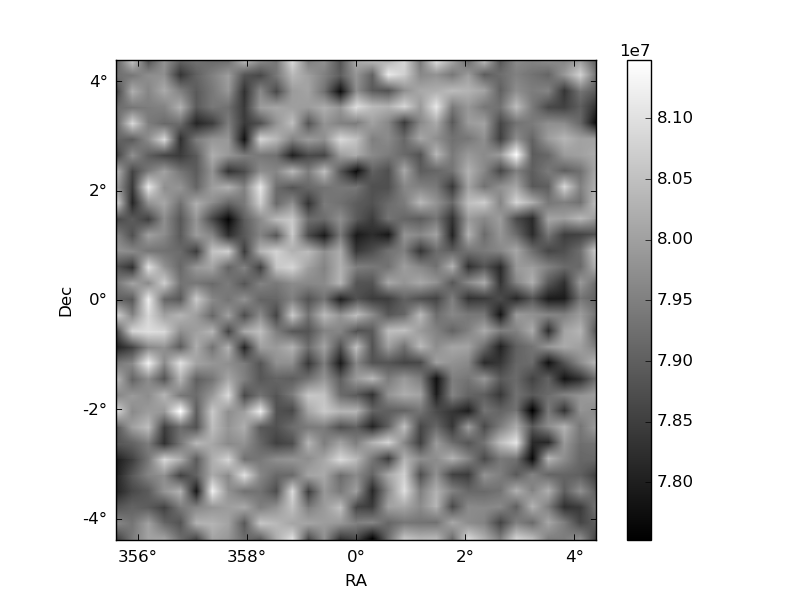
Histogram calculated using DETX and DETY for each event in the final _common_clean file
| Quadrant A | 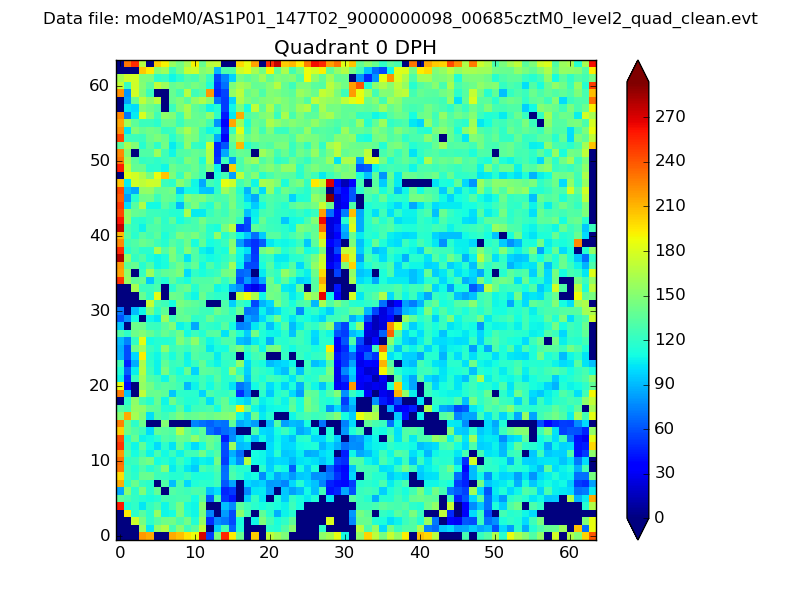 |
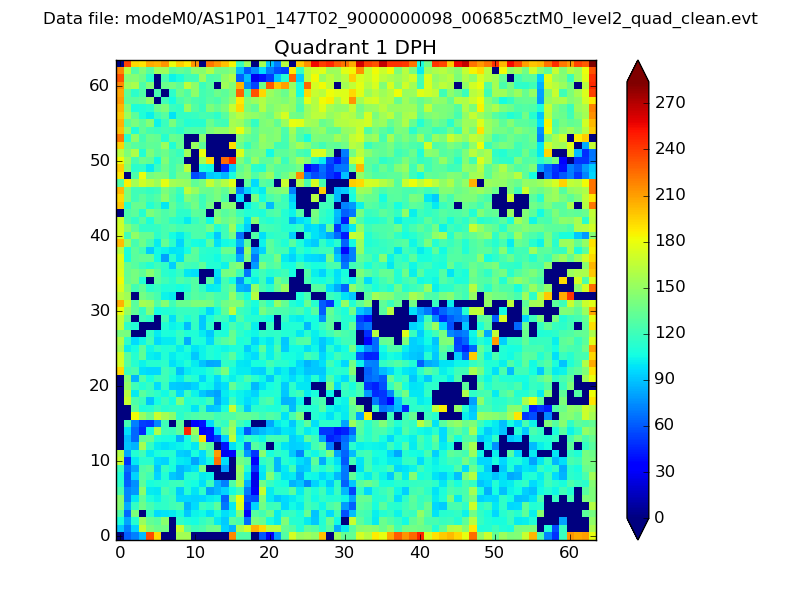 |
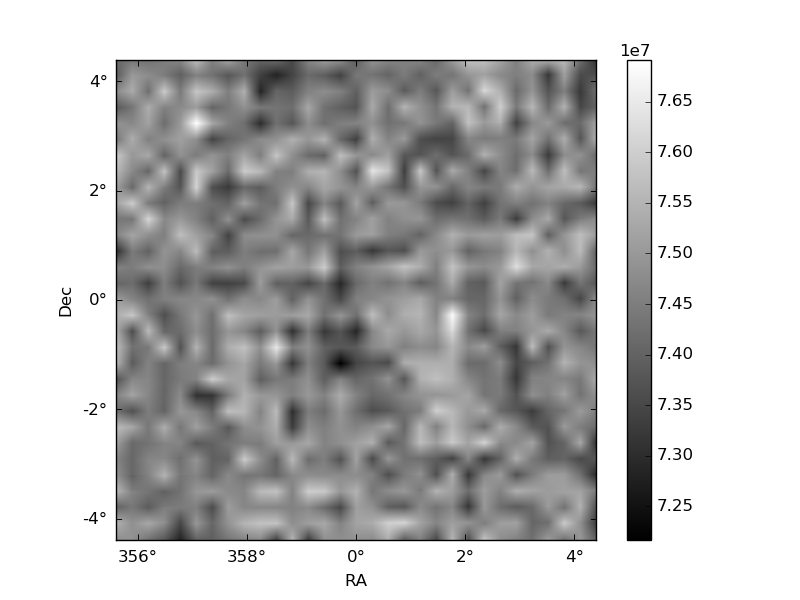
Quadrant B |
|---|---|---|---|
| Quadrant D | 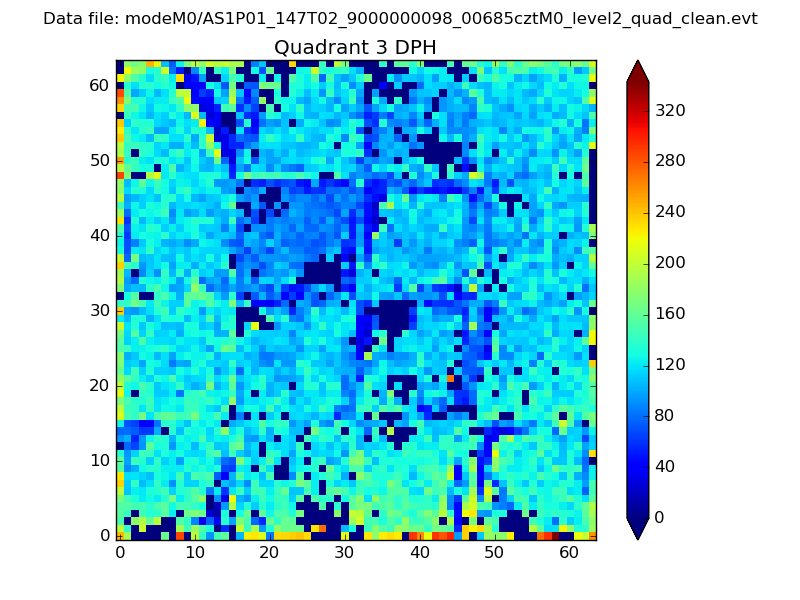 |
 |
Quadrant C |
| Plot type | Count rate plots | Images |
|---|---|---|
| Comparison with Poisson distribution Blue bars denote a histogram of data divided into 1 sec bins. Red curve is a Poisson curve with rate = median count rate of data. |
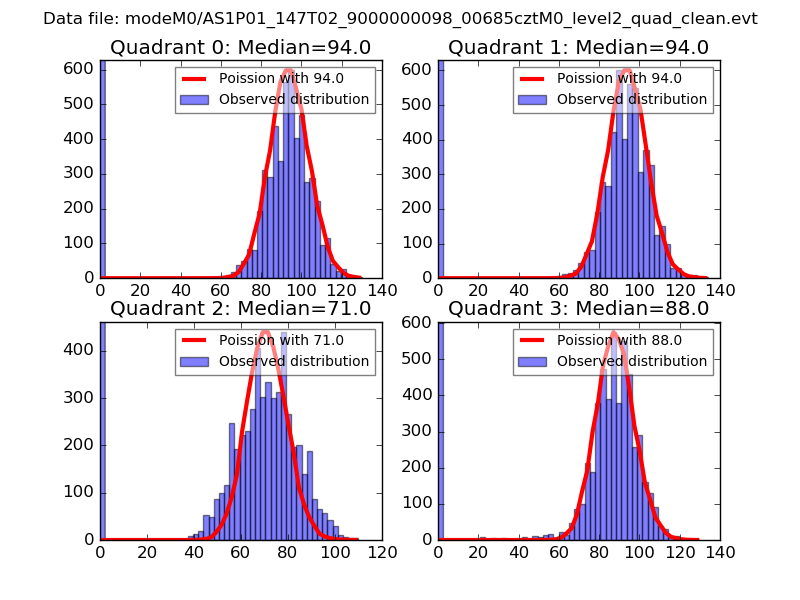 |
 |
| Quadrant-wise count rates Data is divided into 100 sec bins |
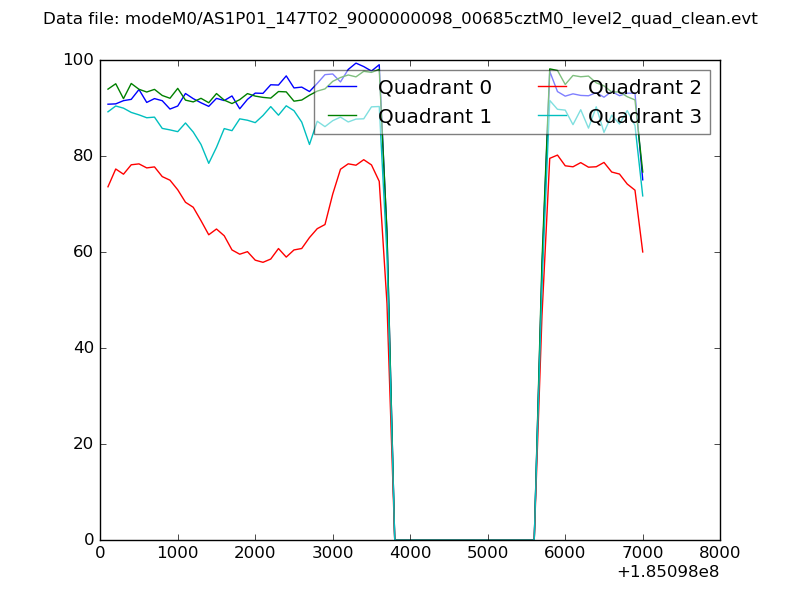 |
|
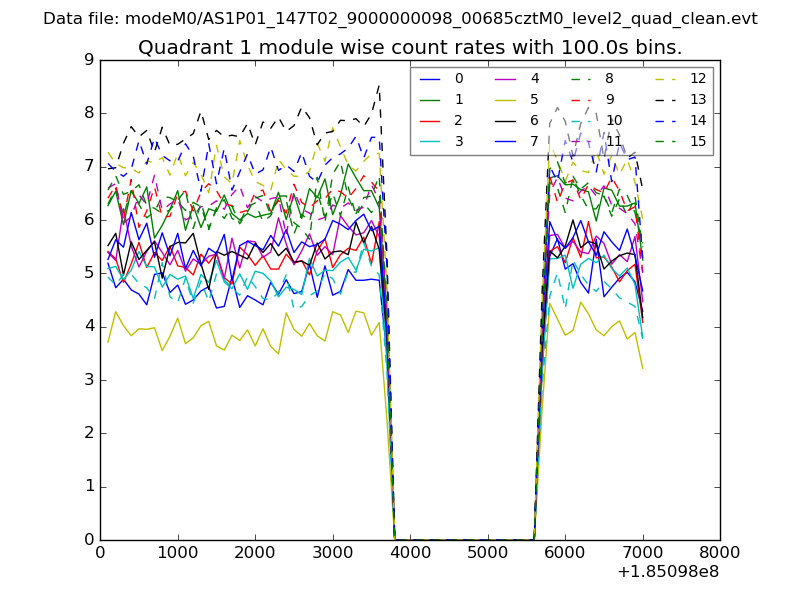
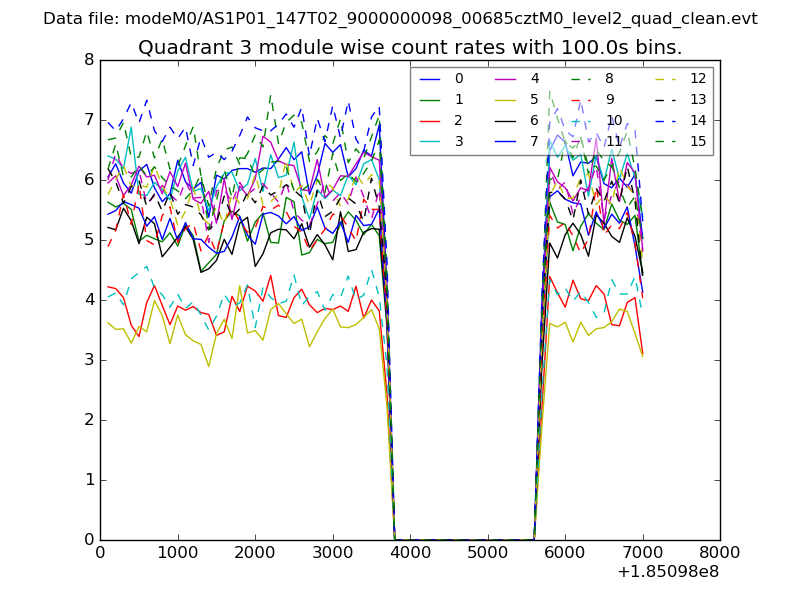
| Module-wise count rates for Quadrant A Data is divided into 100 sec bins |
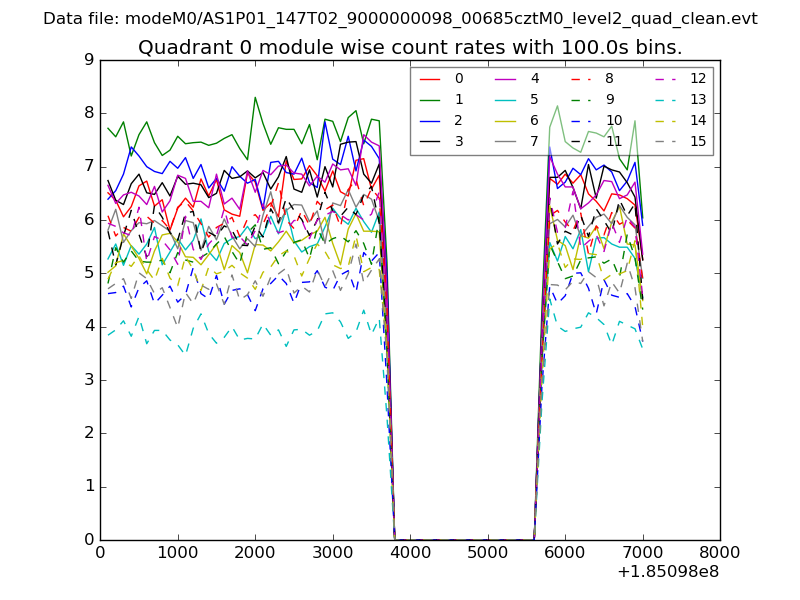 |
 |
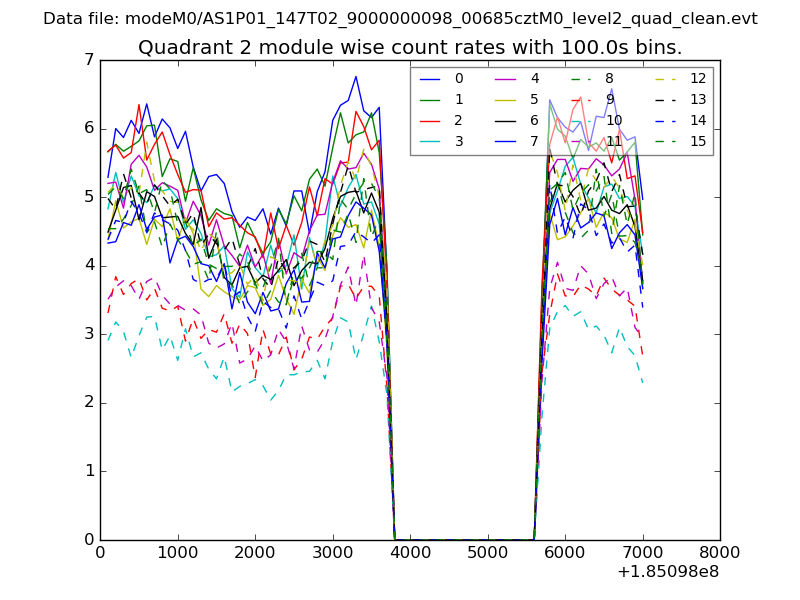
| Module-wise count rates for Quadrant B Data is divided into 100 sec bins |
 |
 |
| Module-wise count rates for Quadrant C Data is divided into 100 sec bins |
 |
 |
| Module-wise count rates for Quadrant D Data is divided into 100 sec bins |
 |
 |
| Parameter | Plot |
|---|---|
| CZT HV Monitor | 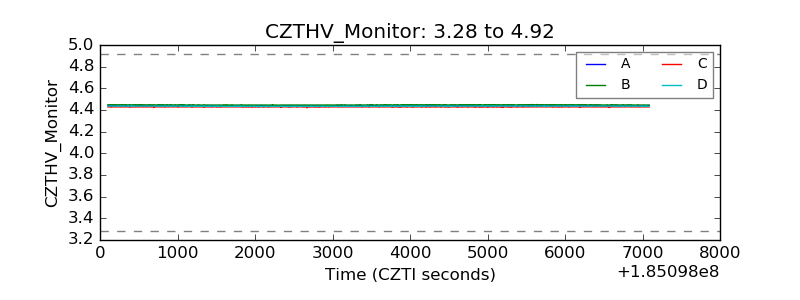 |
| D_VDD | 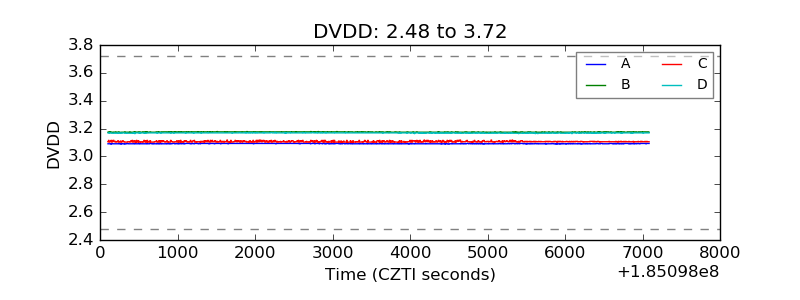 |
| Temperature 1 | 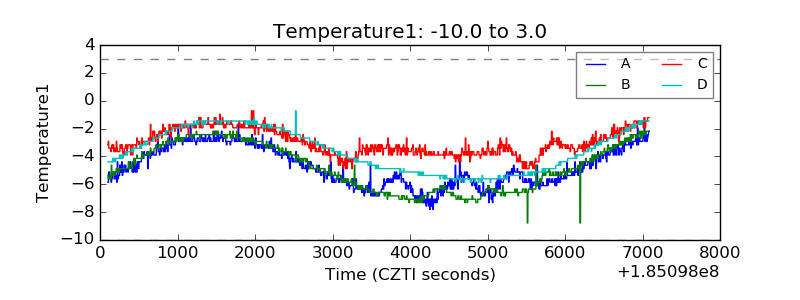 |
| Veto HV Monitor | 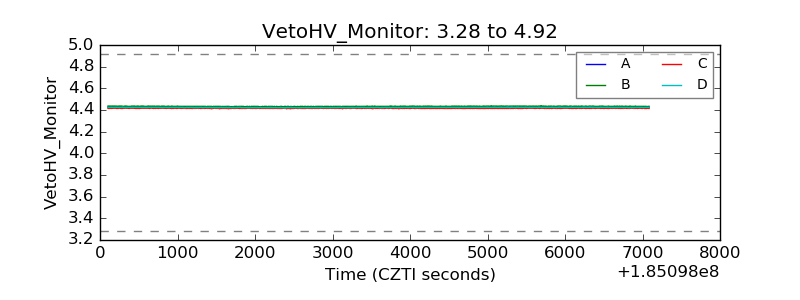 |
| Veto LLD | 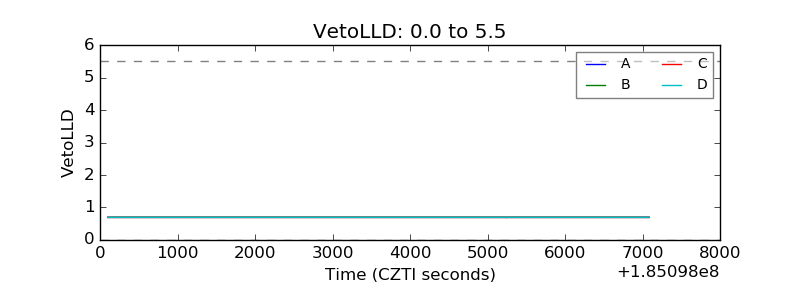 |
| Alpha Counter | 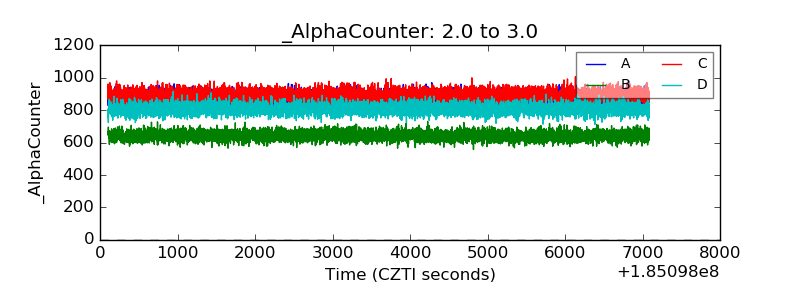 |
| _CPM_Rate | 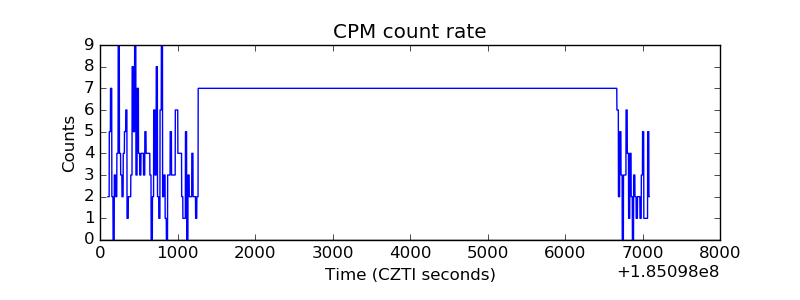 |
| CZT Counter | 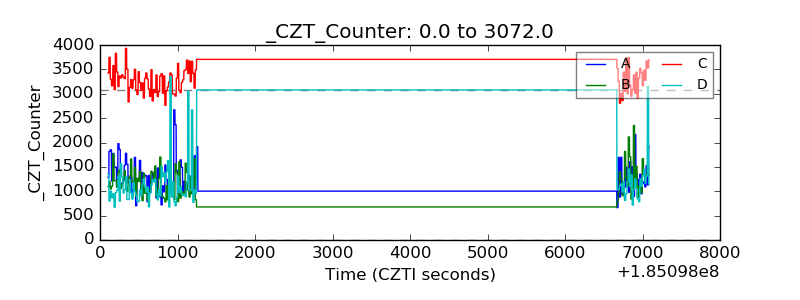 |
| +2.5 Volts monitor |  |
| +5 Volts monitor |  |
| _ROLL_ROT | 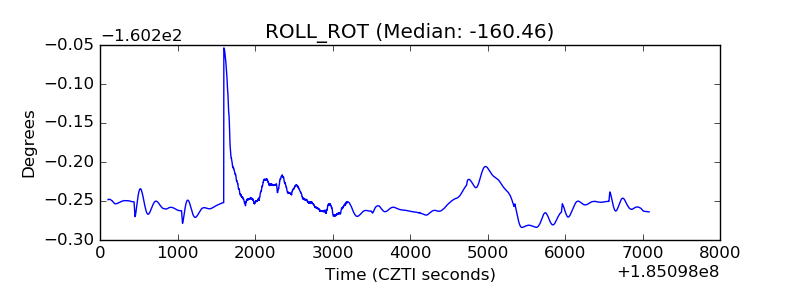 |
| _Roll_DEC | 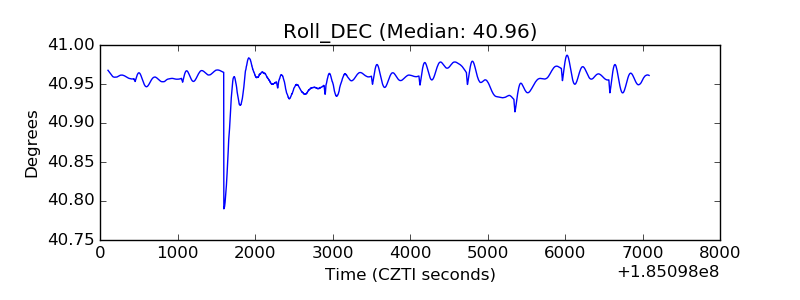 |
| _Roll_RA | 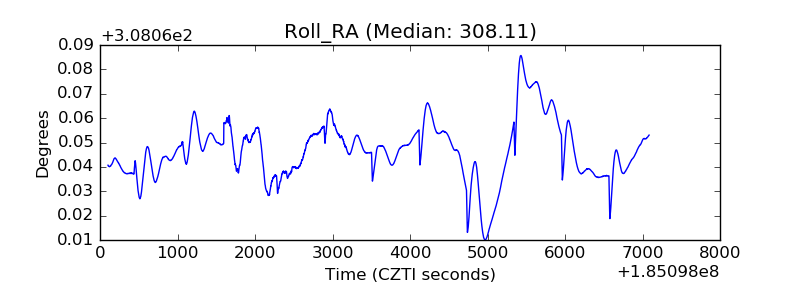 |
| Veto Counter |  |