| Param | Original file | Final file |
|---|---|---|
| Filename | modeM0/AS1P01_147T02_9000000098_00686cztM0_level2.evt | modeM0/AS1P01_147T02_9000000098_00686cztM0_level2_quad_clean.evt |
| Size (bytes) | 1,667,309,760 | 73,321,920 |
| Size | 1.6 GB | 69.9 MB |
| Events in quadrant A | 8,445,560 | 479,808 |
| Events in quadrant B | 9,695,061 | 472,746 |
| Events in quadrant C | 21,132,567 | 355,085 |
| Events in quadrant D | 10,764,505 | 425,859 |
| Mode M9 | |||
|---|---|---|---|
| Quadrant | BADHDUFLAG | Total packets | Discarded packets |
| A | 0 | 3 | 0 |
| B | 0 | 3 | 0 |
| C | 0 | 3 | 0 |
| D | 0 | 3 | 0 |
| Mode SS | |||
|---|---|---|---|
| Quadrant | BADHDUFLAG | Total packets | Discarded packets |
| A | 0 | 142 | 0 |
| B | 0 | 142 | 0 |
| C | 0 | 142 | 0 |
| D | 0 | 142 | 0 |
| Mode M0 | |||
|---|---|---|---|
| Quadrant | BADHDUFLAG | Total packets | Discarded packets |
| A | 0 | 30075 | 1 |
| B | 0 | 33903 | 1 |
| C | 0 | 68691 | 2 |
| D | 0 | 37073 | 1 |
| Quadrant | Total seconds | Saturated seconds | Saturation percentage |
|---|---|---|---|
| A | 7016 | 65 | 0.926454% |
| B | 6894 | 456 | 6.614447% |
| C | 6976 | 5807 | 83.242546% |
| D | 6937 | 651 | 9.384460% |
Noise dominated data is calculated using 1-second bins in cleaned event files. If a bin has >2000 counts, and if more than 50% of those come from <1% of pixels, then it is considered to be noise-dominated and hence unusable.
| Quadrant | # 1 sec bins | Bins with >0 counts | Bins with >2000 counts | High rate bins dominated by noise | Noise dominated (total time) | Noise dominated (detector-on time) | Marked lightcurve |
|---|---|---|---|---|---|---|---|
| A | 7331 | 7017 | 307 | 307 | 4.19% | 4.38% | 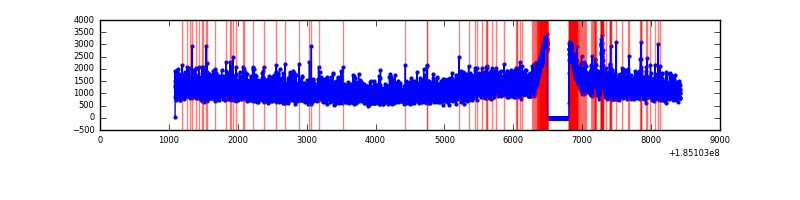 |
| B | 7331 | 6896 | 918 | 918 | 12.52% | 13.31% | 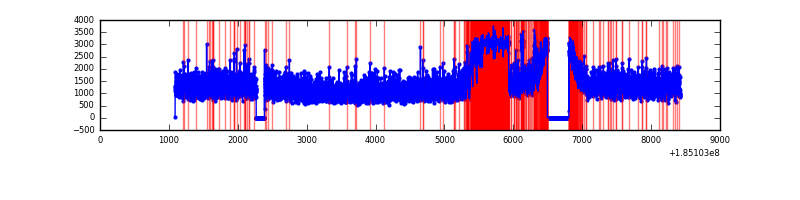 |
| C | 7331 | 6978 | 6965 | 6965 | 95.01% | 99.81% | 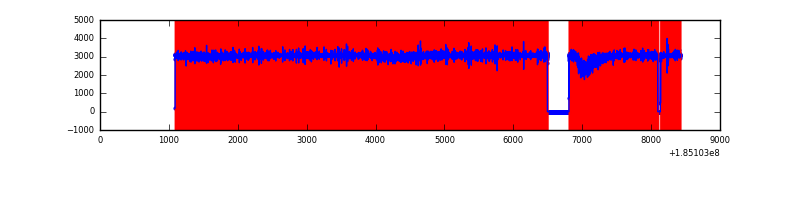 |
| D | 7331 | 6938 | 1080 | 1080 | 14.73% | 15.57% | 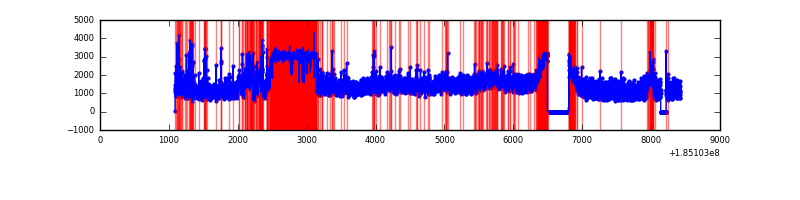 |
Top three noisy pixels from each quadrant. If the there are fewer than three noisy pixels in the level2.evt file, extra rows are filled as -1
| Pixel properties | Quadrant properties | ||||||
|---|---|---|---|---|---|---|---|
| Quadrant | DetID | PixID | Counts | Sigma | Mean | Median | Sigma |
| A | 15 | 249 | 135622 | 255.1 | 2161 | 2178 | 523.1 |
| A | 12 | 189 | 9502 | 14.0 | 2161 | 2178 | 523.1 |
| A | 15 | 69 | 8533 | 12.15 | 2161 | 2178 | 523.1 |
| B | 5 | 191 | 1116524 | 2169.43 | 2161 | 2180 | 513.7 |
| B | 7 | 221 | 265014 | 511.69 | 2161 | 2180 | 513.7 |
| B | 5 | 247 | 36611 | 67.03 | 2161 | 2180 | 513.7 |
| C | 3 | 191 | 11515872 | 24026.41 | 1720 | 1784 | 479.2 |
| C | 3 | 127 | 962105 | 2003.9 | 1720 | 1784 | 479.2 |
| C | 3 | 95 | 505656 | 1051.43 | 1720 | 1784 | 479.2 |
| D | 0 | 25 | 1589860 | 2664.91 | 1920 | 1985 | 595.8 |
| D | 1 | 84 | 1454012 | 2436.92 | 1920 | 1985 | 595.8 |
| D | 1 | 4 | 274464 | 457.3 | 1920 | 1985 | 595.8 |
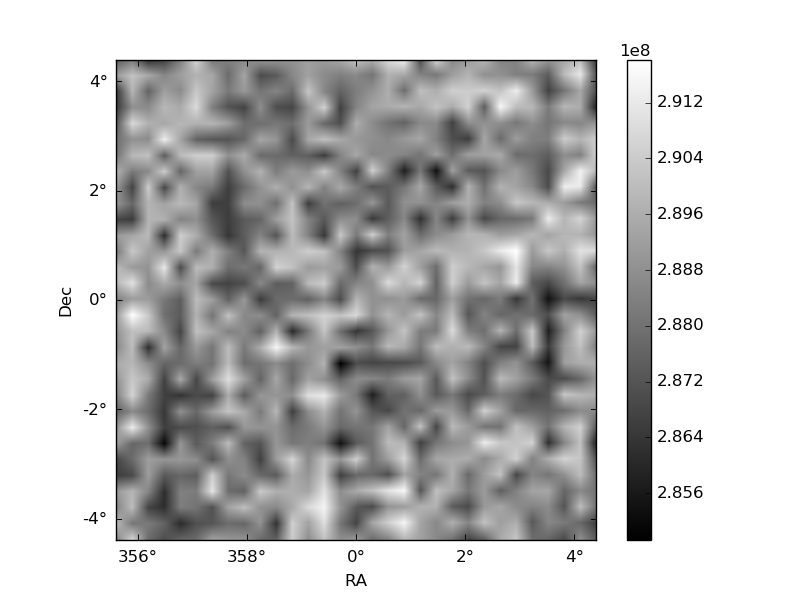
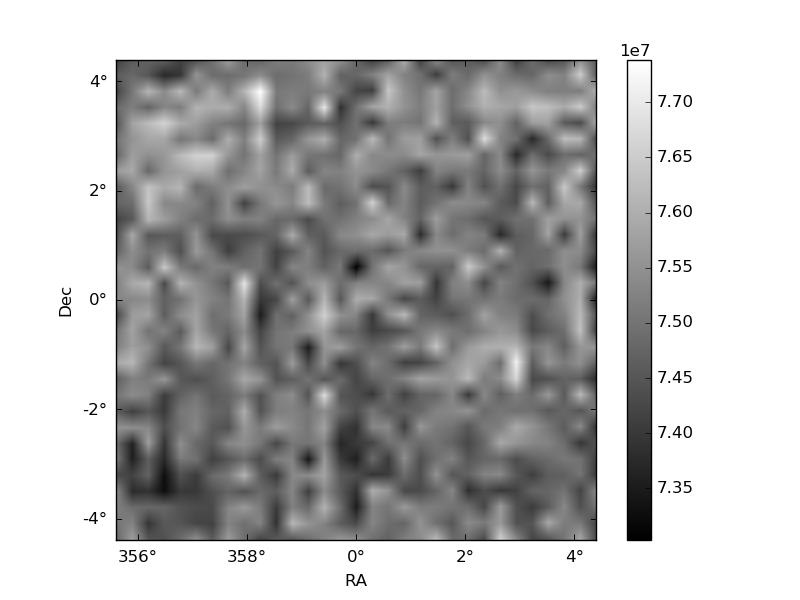
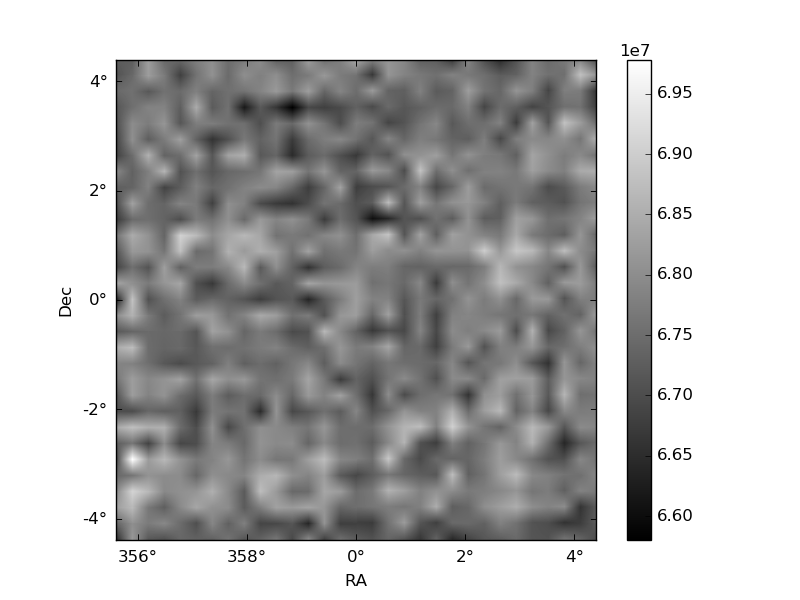
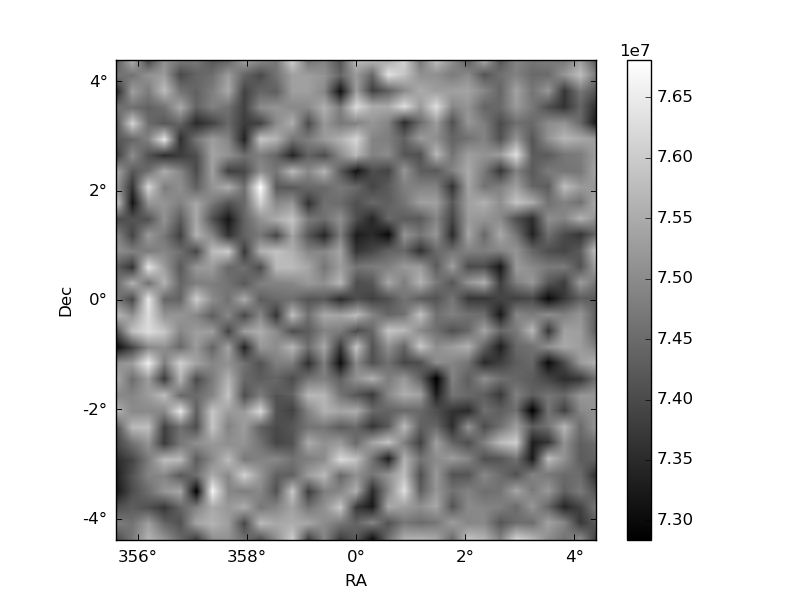
Histogram calculated using DETX and DETY for each event in the final _common_clean file
| Quadrant A | 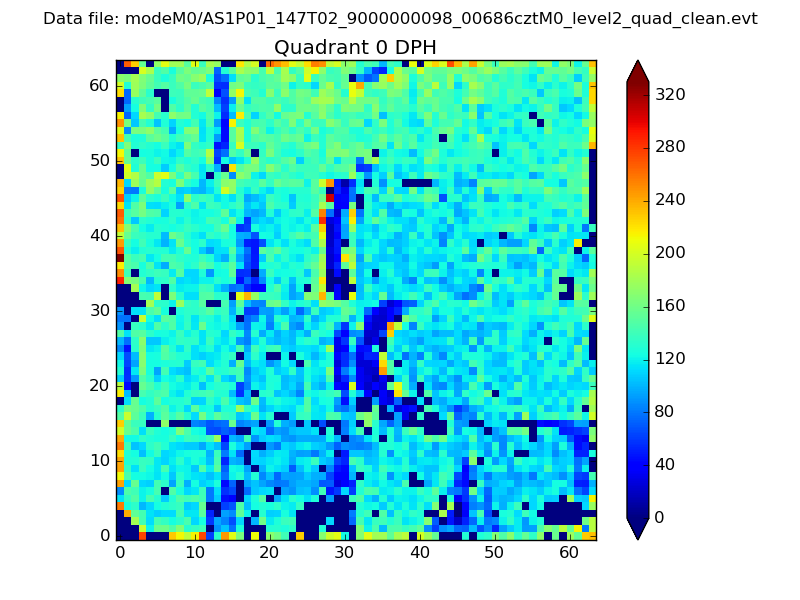 |
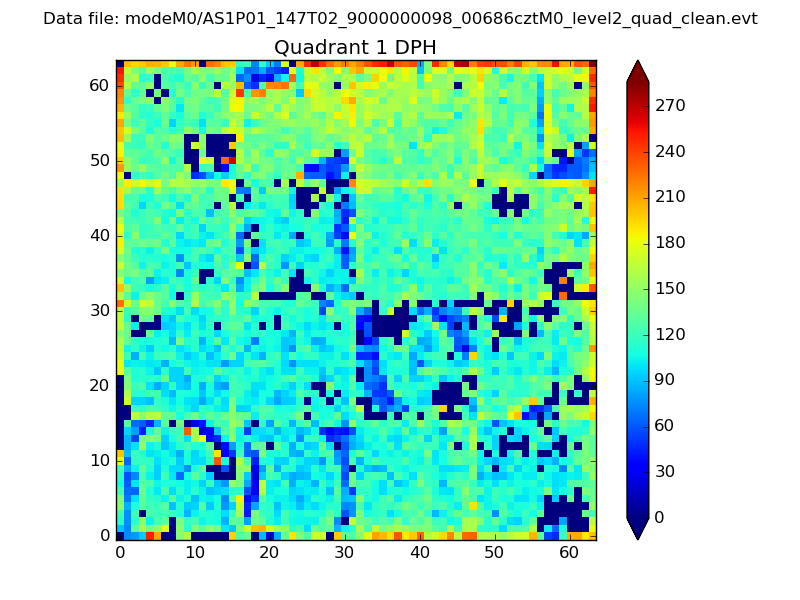 |
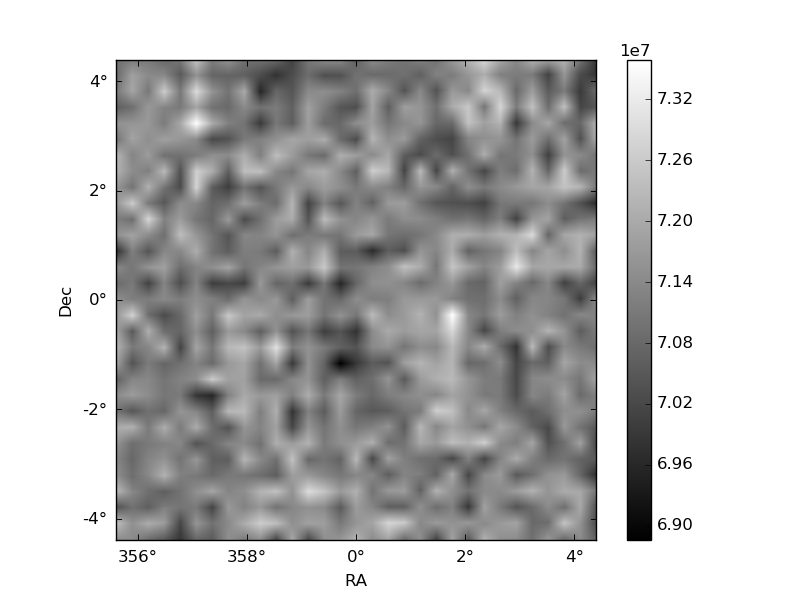
Quadrant B |
|---|---|---|---|
| Quadrant D | 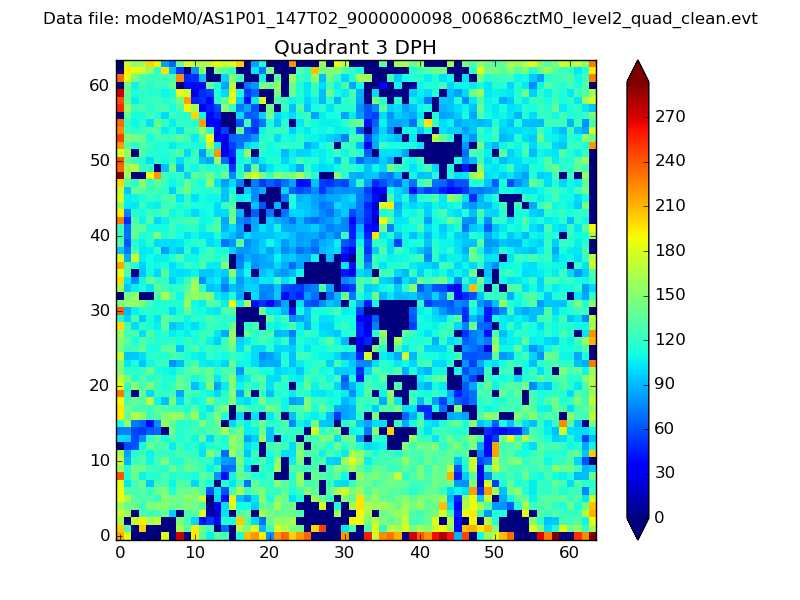 |
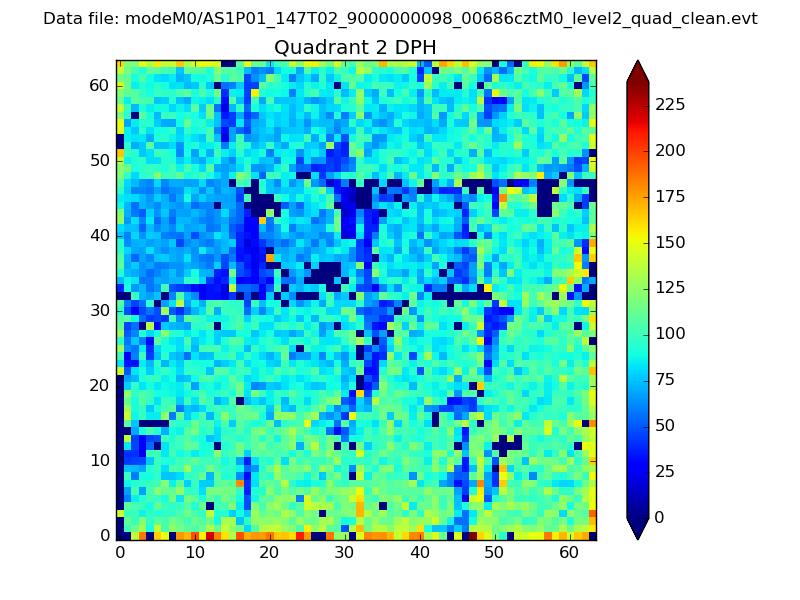 |
Quadrant C |
| Plot type | Count rate plots | Images |
|---|---|---|
| Comparison with Poisson distribution Blue bars denote a histogram of data divided into 1 sec bins. Red curve is a Poisson curve with rate = median count rate of data. |
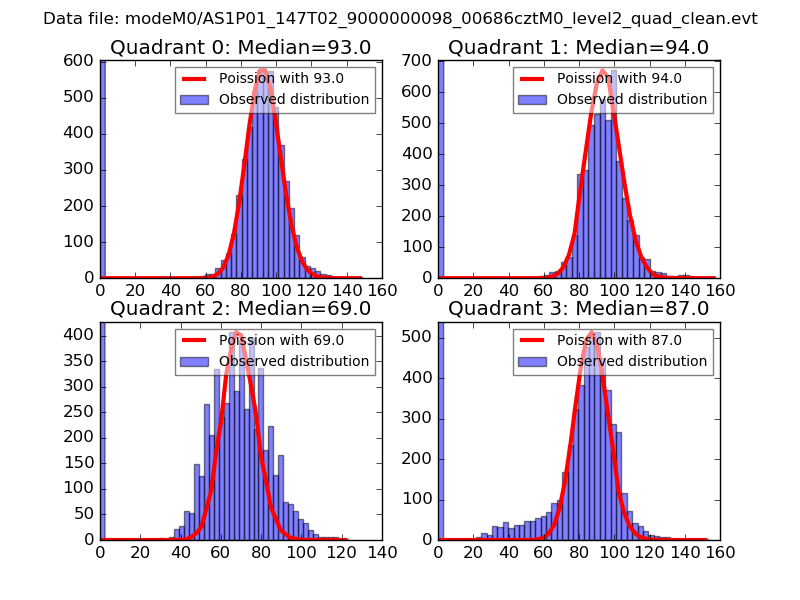 |
 |
| Quadrant-wise count rates Data is divided into 100 sec bins |
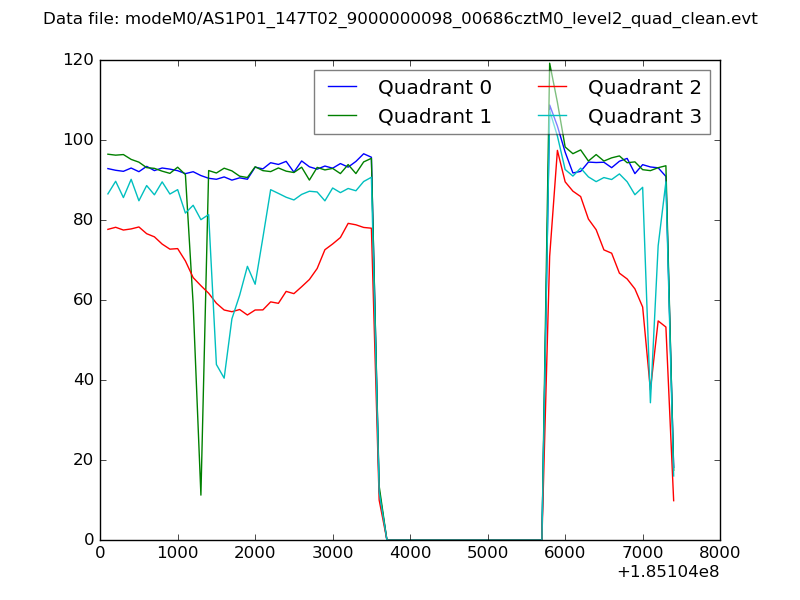 |
|
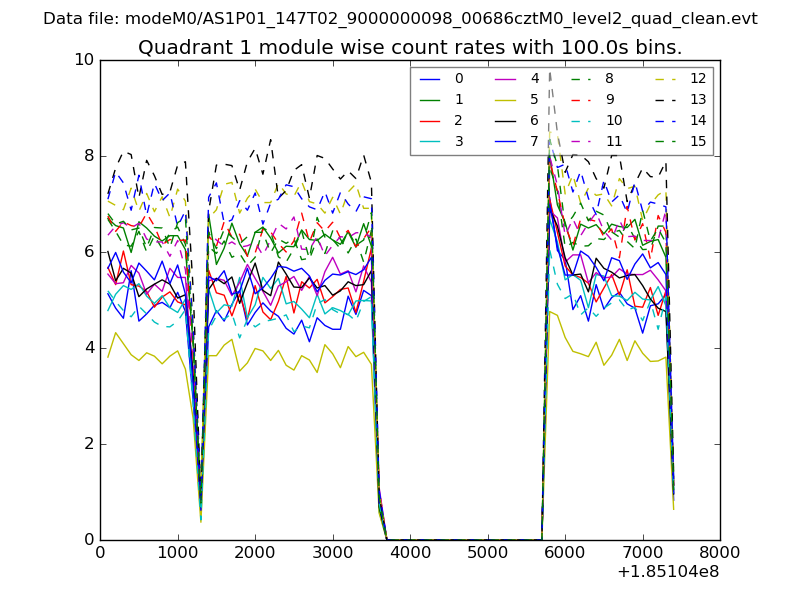
| Module-wise count rates for Quadrant A Data is divided into 100 sec bins |
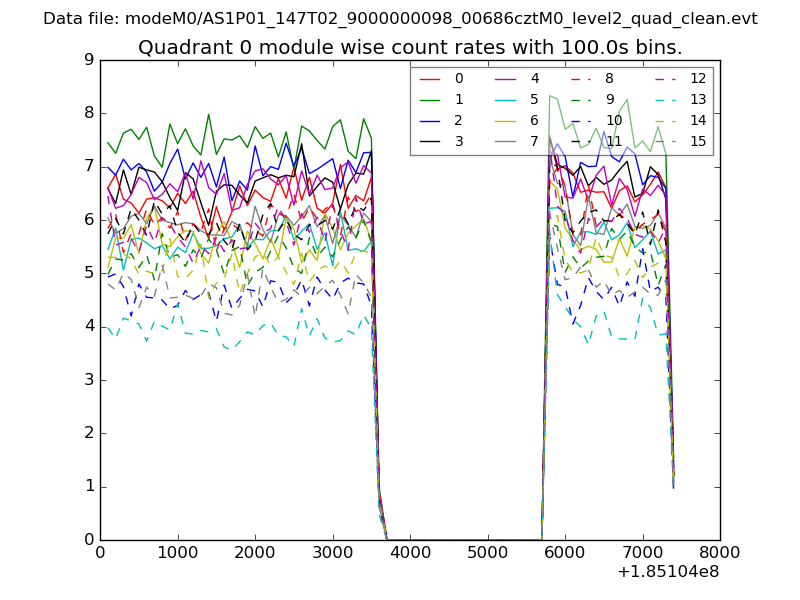 |
 |
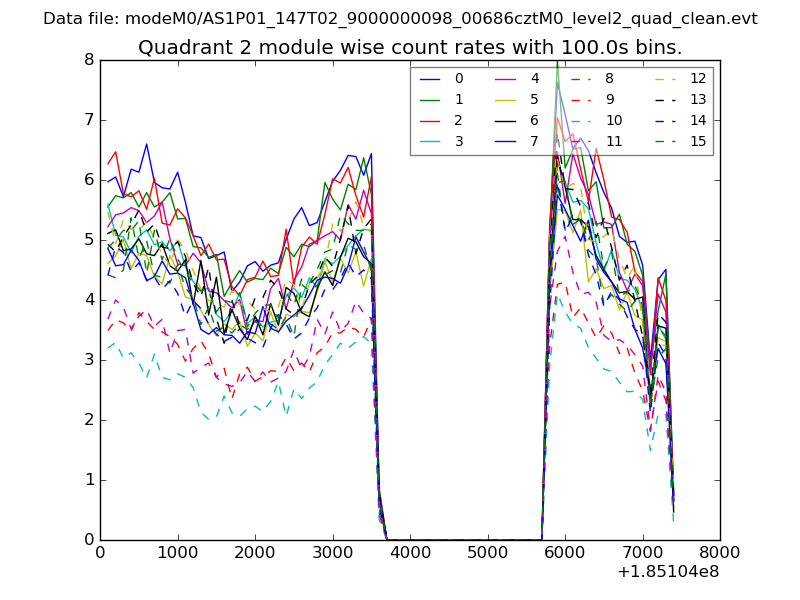
| Module-wise count rates for Quadrant B Data is divided into 100 sec bins |
 |
 |
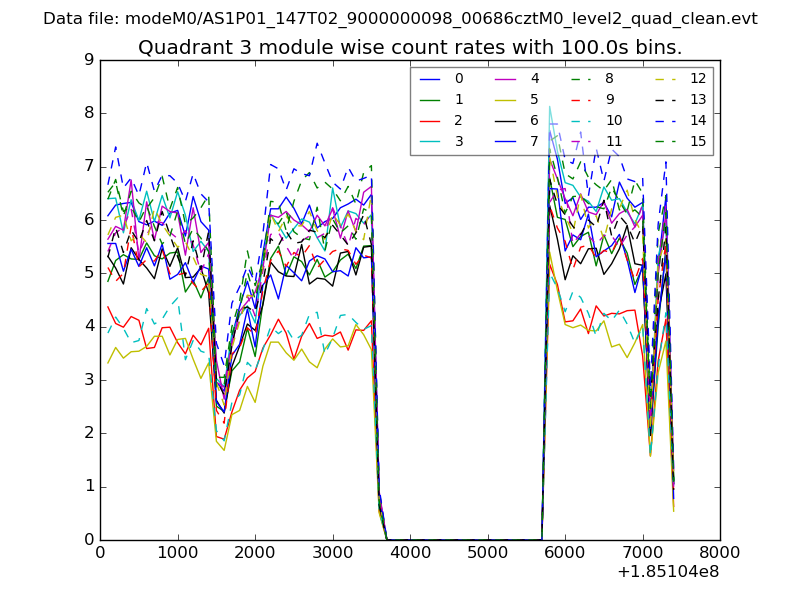
| Module-wise count rates for Quadrant C Data is divided into 100 sec bins |
 |
 |
| Module-wise count rates for Quadrant D Data is divided into 100 sec bins |
 |
 |
| Parameter | Plot |
|---|---|
| CZT HV Monitor | 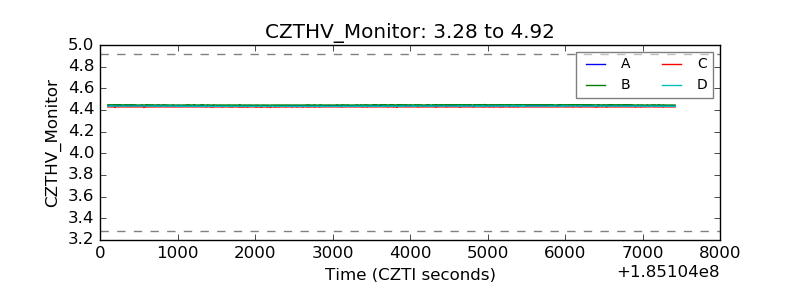 |
| D_VDD | 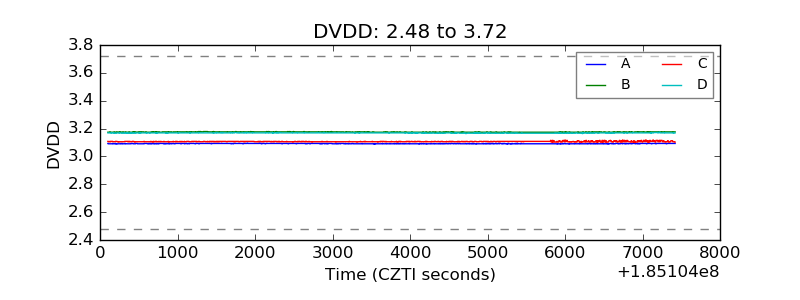 |
| Temperature 1 | 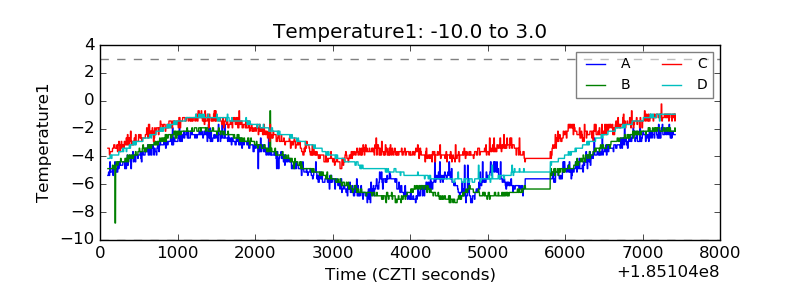 |
| Veto HV Monitor | 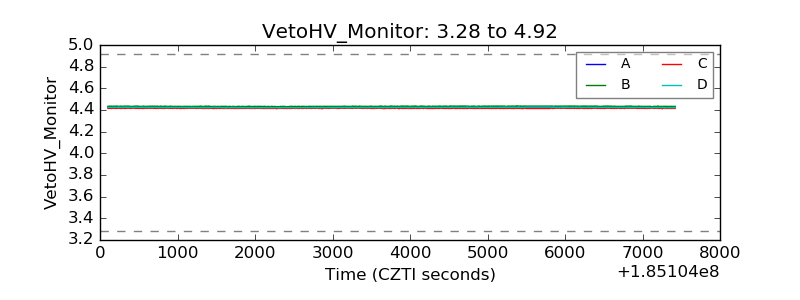 |
| Veto LLD | 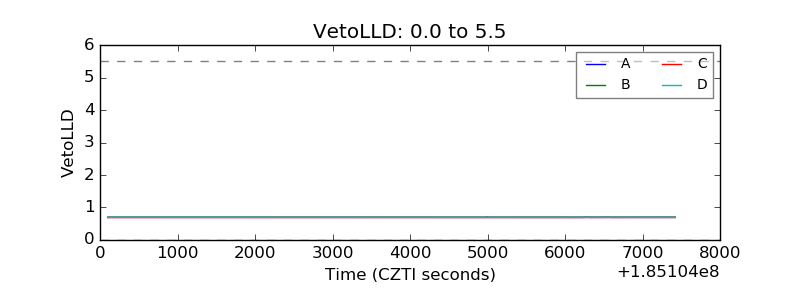 |
| Alpha Counter | 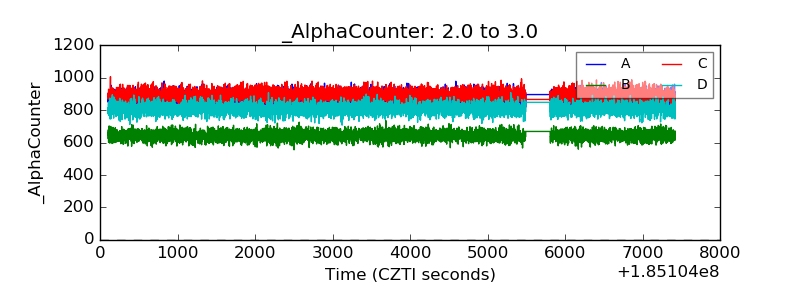 |
| _CPM_Rate | 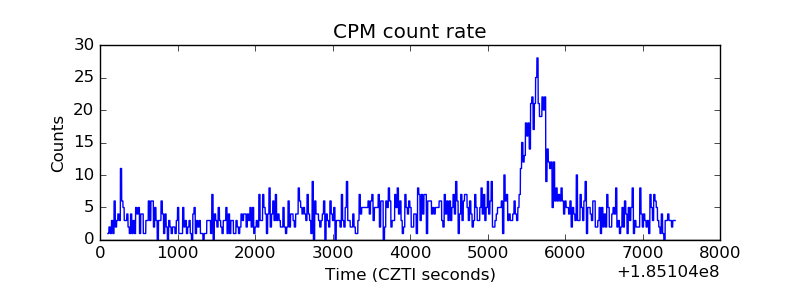 |
| CZT Counter | 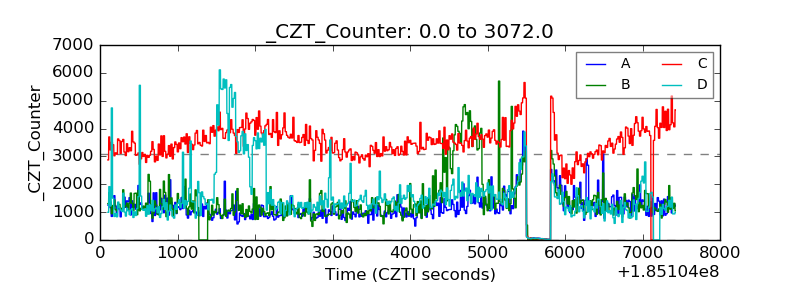 |
| +2.5 Volts monitor |  |
| +5 Volts monitor |  |
| _ROLL_ROT | 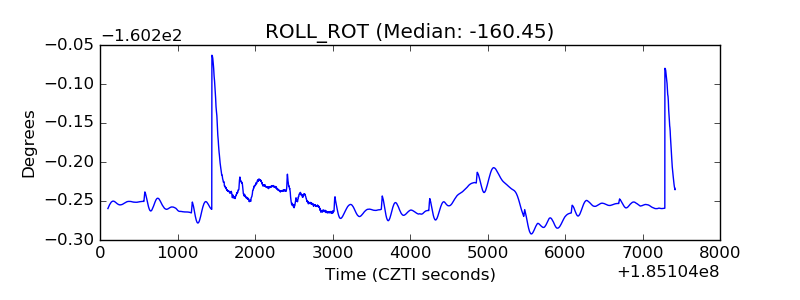 |
| _Roll_DEC | 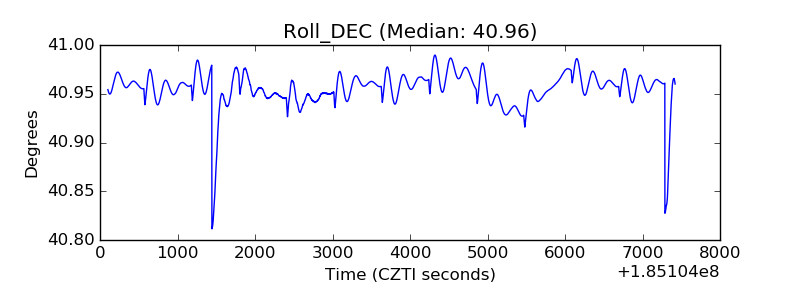 |
| _Roll_RA | 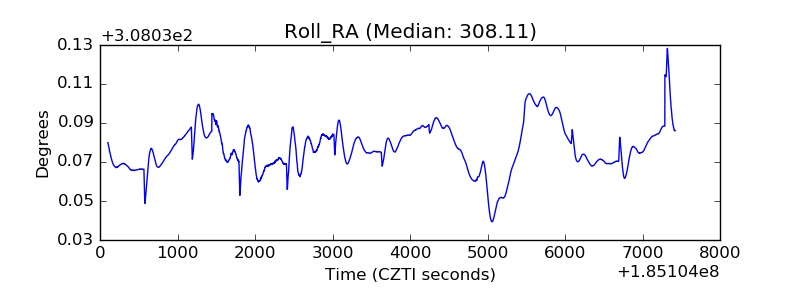 |
| Veto Counter | 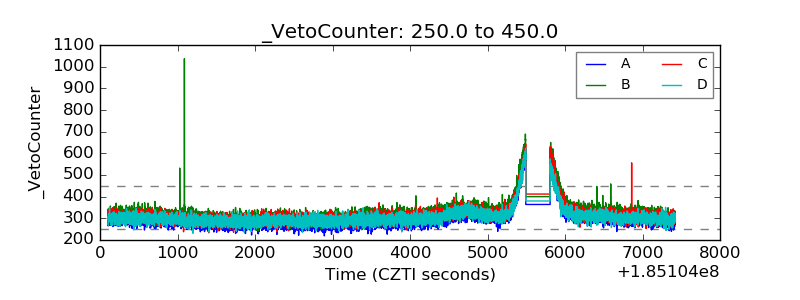 |