| Param | Original file | Final file |
|---|---|---|
| Filename | modeM0/AS1P01_147T02_9000000098_00688cztM0_level2.evt | modeM0/AS1P01_147T02_9000000098_00688cztM0_level2_quad_clean.evt |
| Size (bytes) | 1,469,093,760 | 69,811,200 |
| Size | 1.4 GB | 66.6 MB |
| Events in quadrant A | 7,838,302 | 442,523 |
| Events in quadrant B | 8,376,040 | 445,304 |
| Events in quadrant C | 19,487,902 | 353,230 |
| Events in quadrant D | 8,355,648 | 411,443 |
| Mode M9 | |||
|---|---|---|---|
| Quadrant | BADHDUFLAG | Total packets | Discarded packets |
| A | 0 | 7 | 0 |
| B | 0 | 7 | 0 |
| C | 0 | 7 | 0 |
| D | 0 | 7 | 0 |
| Mode SS | |||
|---|---|---|---|
| Quadrant | BADHDUFLAG | Total packets | Discarded packets |
| A | 0 | 136 | 0 |
| B | 0 | 136 | 0 |
| C | 0 | 136 | 0 |
| D | 0 | 136 | 0 |
| Mode M0 | |||
|---|---|---|---|
| Quadrant | BADHDUFLAG | Total packets | Discarded packets |
| A | 0 | 28051 | 1 |
| B | 0 | 29561 | 5 |
| C | 0 | 63248 | 2 |
| D | 0 | 29557 | 1 |
| Quadrant | Total seconds | Saturated seconds | Saturation percentage |
|---|---|---|---|
| A | 6631 | 107 | 1.613633% |
| B | 6630 | 29 | 0.437406% |
| C | 6607 | 4281 | 64.794914% |
| D | 6494 | 98 | 1.509085% |
Noise dominated data is calculated using 1-second bins in cleaned event files. If a bin has >2000 counts, and if more than 50% of those come from <1% of pixels, then it is considered to be noise-dominated and hence unusable.
| Quadrant | # 1 sec bins | Bins with >0 counts | Bins with >2000 counts | High rate bins dominated by noise | Noise dominated (total time) | Noise dominated (detector-on time) | Marked lightcurve |
|---|---|---|---|---|---|---|---|
| A | 7381 | 6632 | 239 | 239 | 3.24% | 3.60% | 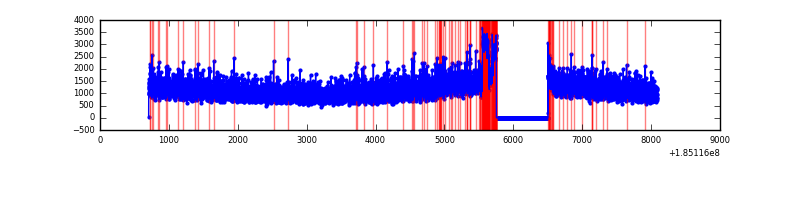 |
| B | 7380 | 6631 | 231 | 231 | 3.13% | 3.48% | 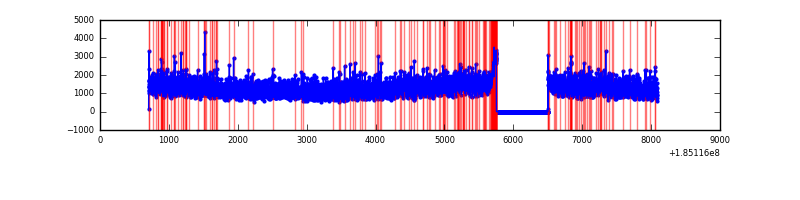 |
| C | 7380 | 6609 | 6493 | 6493 | 87.98% | 98.24% |  |
| D | 7380 | 6495 | 343 | 343 | 4.65% | 5.28% | 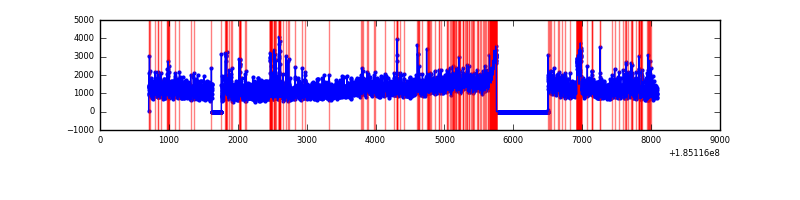 |
Top three noisy pixels from each quadrant. If the there are fewer than three noisy pixels in the level2.evt file, extra rows are filled as -1
| Pixel properties | Quadrant properties | ||||||
|---|---|---|---|---|---|---|---|
| Quadrant | DetID | PixID | Counts | Sigma | Mean | Median | Sigma |
| A | 15 | 143 | 229906 | 478.25 | 1969 | 1981 | 476.6 |
| A | 13 | 17 | 41481 | 82.88 | 1969 | 1981 | 476.6 |
| A | 11 | 79 | 8095 | 12.83 | 1969 | 1981 | 476.6 |
| B | 7 | 221 | 172938 | 348.41 | 2068 | 2078 | 490.4 |
| B | 0 | 137 | 151577 | 304.85 | 2068 | 2078 | 490.4 |
| B | 0 | 220 | 63879 | 126.02 | 2068 | 2078 | 490.4 |
| C | 3 | 191 | 10214590 | 21226.6 | 1721 | 1786 | 481.1 |
| C | 3 | 127 | 976377 | 2025.62 | 1721 | 1786 | 481.1 |
| C | 3 | 95 | 347514 | 718.57 | 1721 | 1786 | 481.1 |
| D | 0 | 25 | 877681 | 1572.47 | 1806 | 1875 | 557.0 |
| D | 14 | 52 | 402714 | 719.69 | 1806 | 1875 | 557.0 |
| D | 1 | 4 | 154225 | 273.54 | 1806 | 1875 | 557.0 |
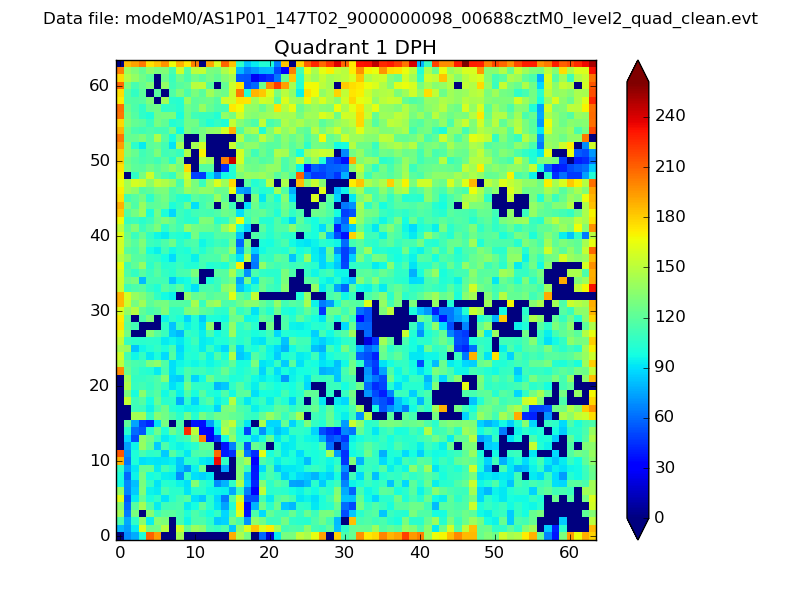
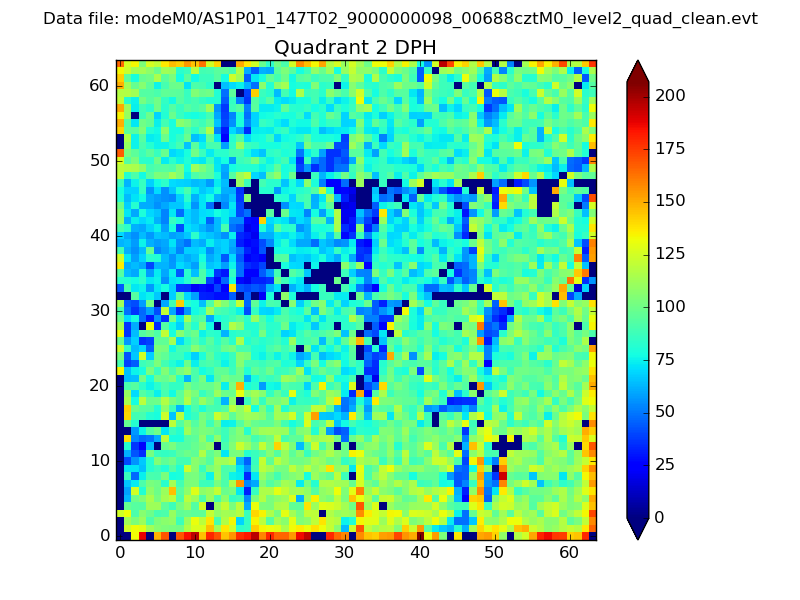
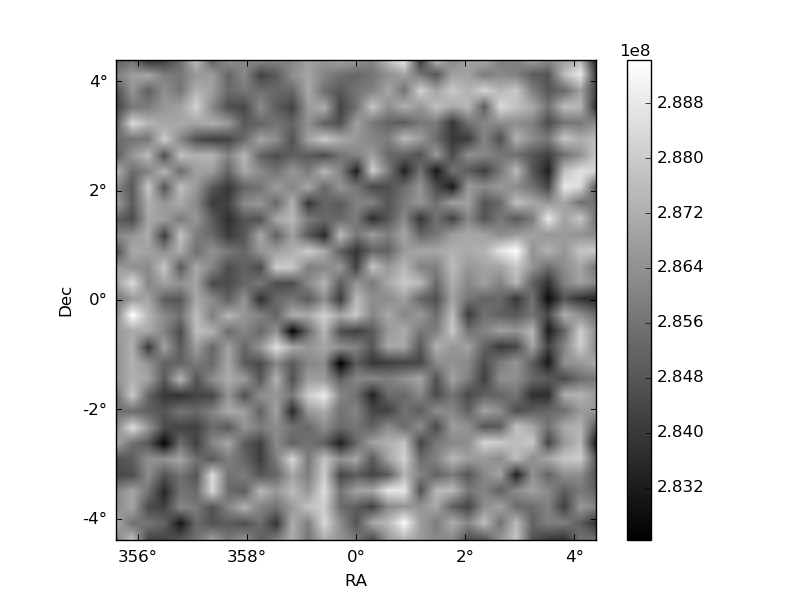
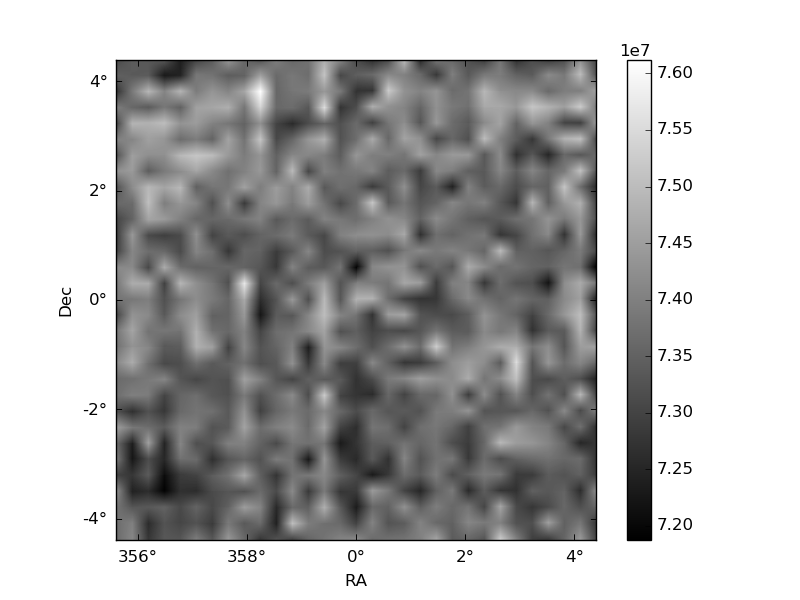
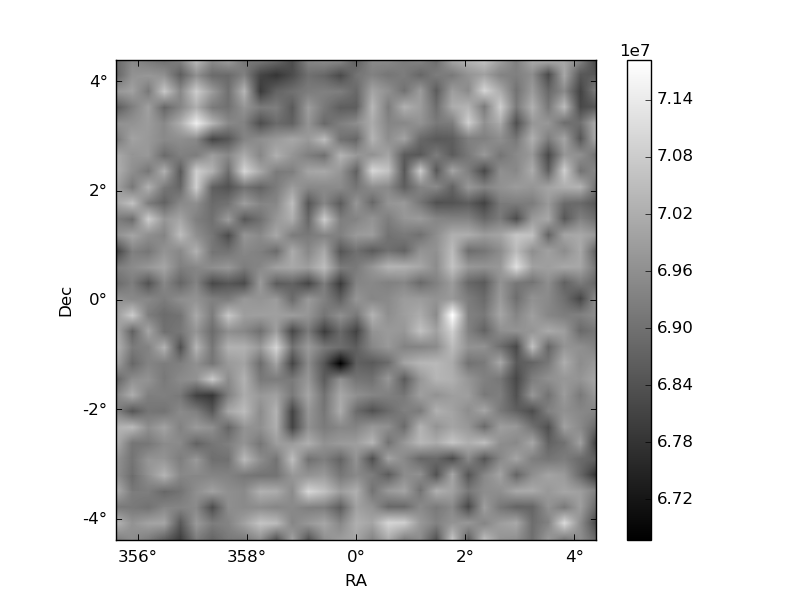
Histogram calculated using DETX and DETY for each event in the final _common_clean file
| Quadrant A | 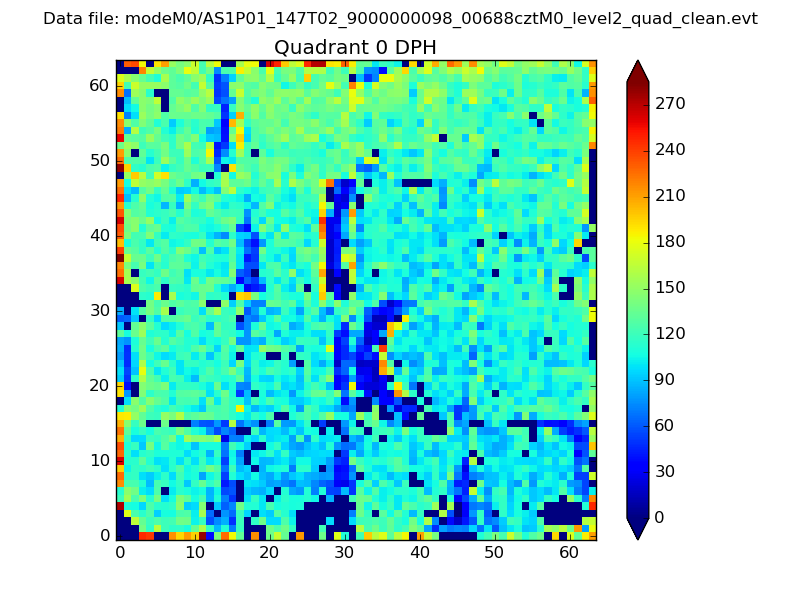 |
 |
Quadrant B |
|---|---|---|---|
| Quadrant D | 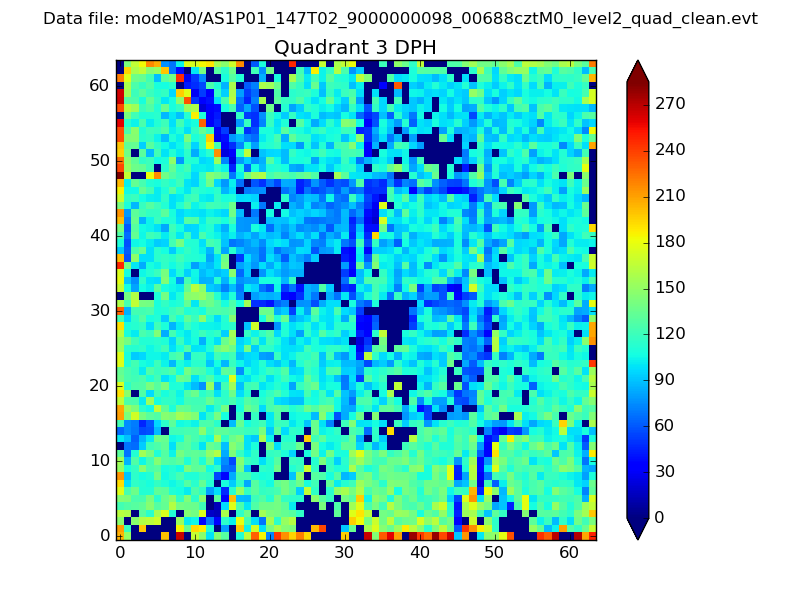 |
 |
Quadrant C |
| Plot type | Count rate plots | Images |
|---|---|---|
| Comparison with Poisson distribution Blue bars denote a histogram of data divided into 1 sec bins. Red curve is a Poisson curve with rate = median count rate of data. |
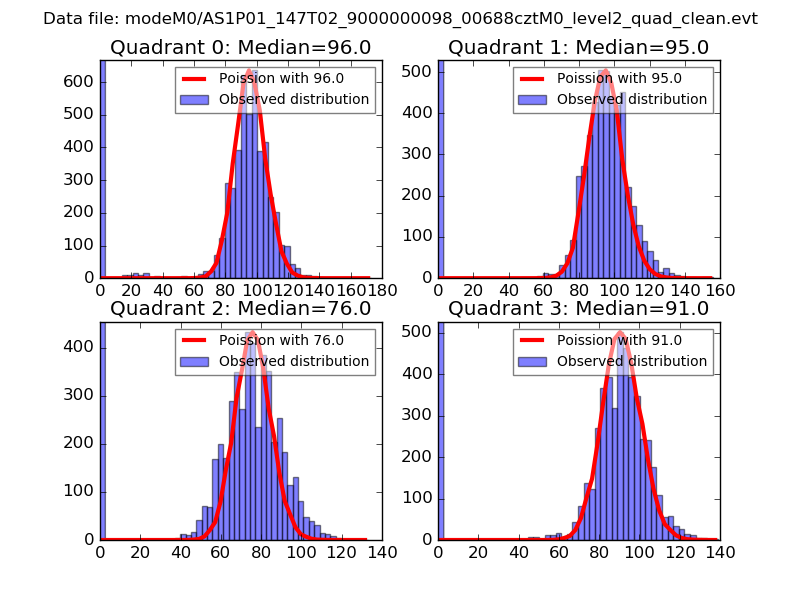 |
 |
| Quadrant-wise count rates Data is divided into 100 sec bins |
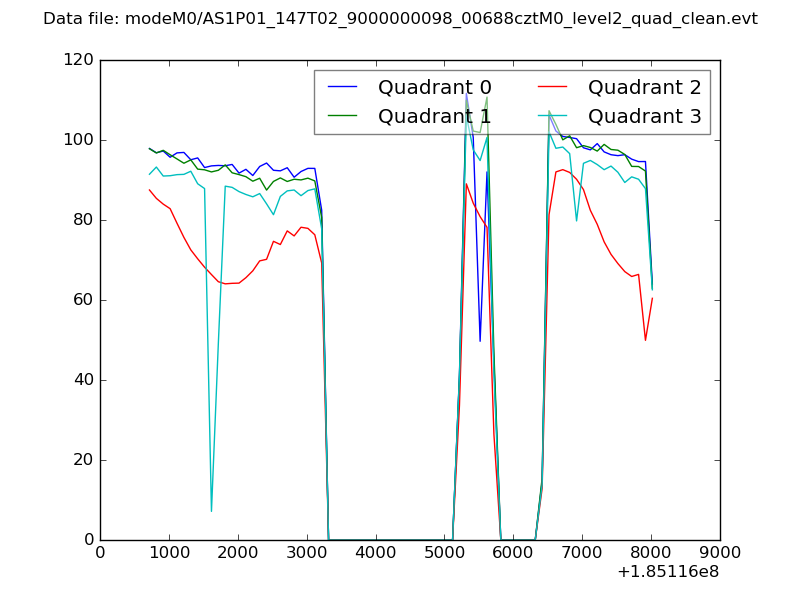 |
|
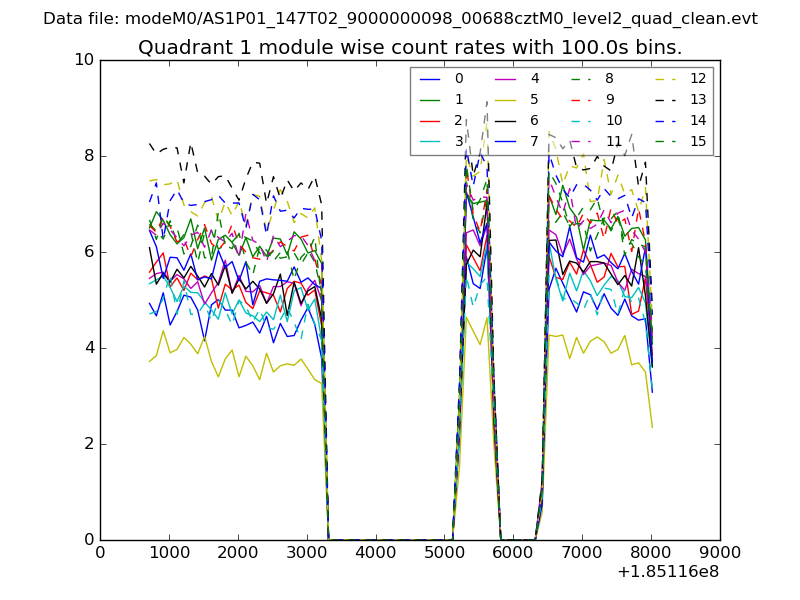
| Module-wise count rates for Quadrant A Data is divided into 100 sec bins |
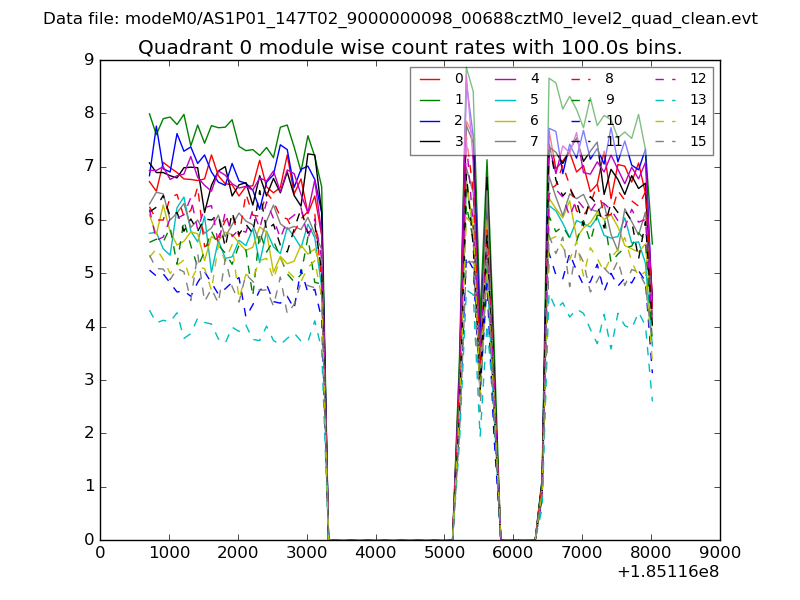 |
 |
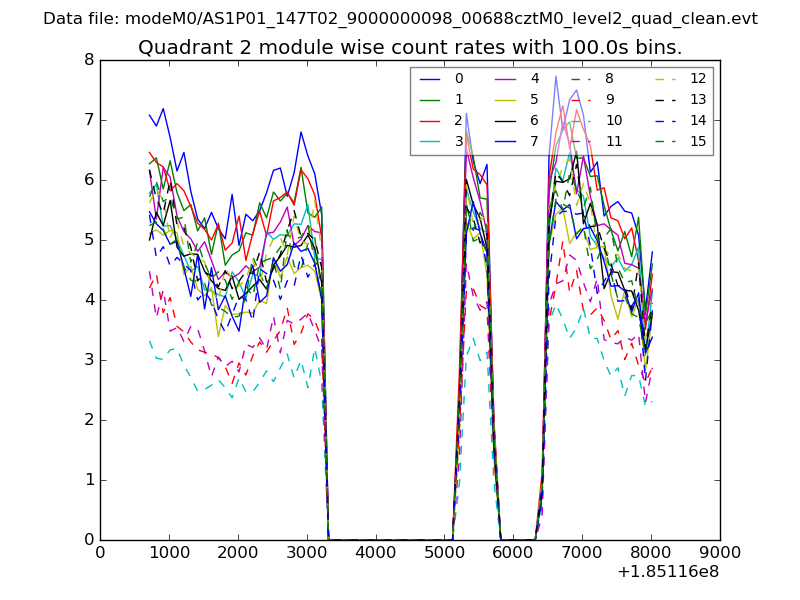
| Module-wise count rates for Quadrant B Data is divided into 100 sec bins |
 |
 |
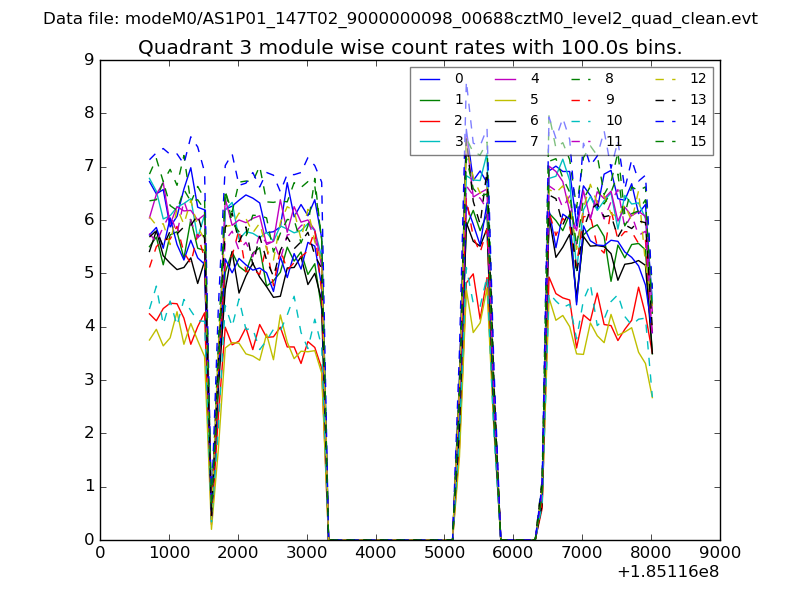
| Module-wise count rates for Quadrant C Data is divided into 100 sec bins |
 |
 |
| Module-wise count rates for Quadrant D Data is divided into 100 sec bins |
 |
 |
| Parameter | Plot |
|---|---|
| CZT HV Monitor | 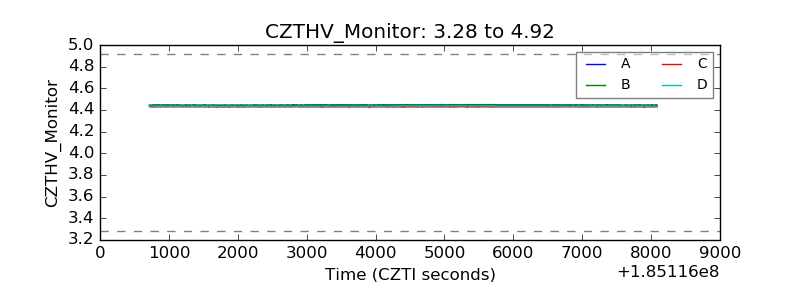 |
| D_VDD | 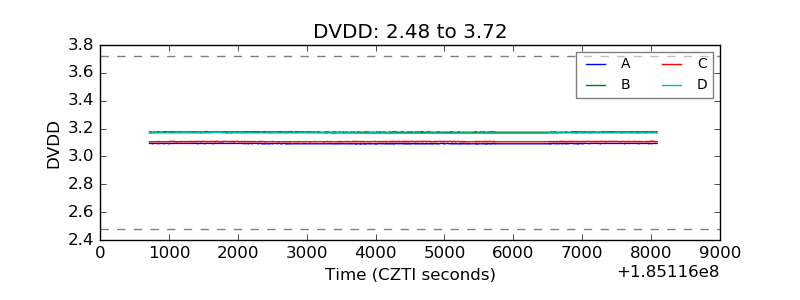 |
| Temperature 1 | 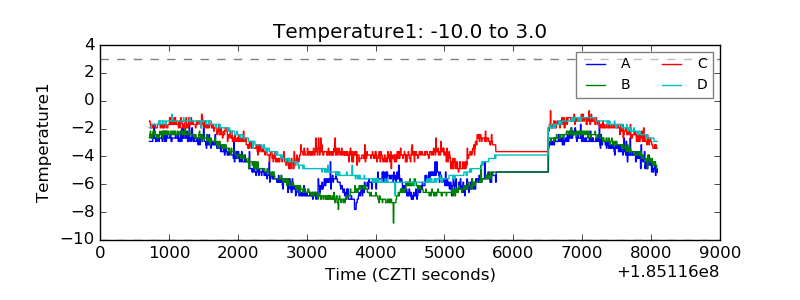 |
| Veto HV Monitor | 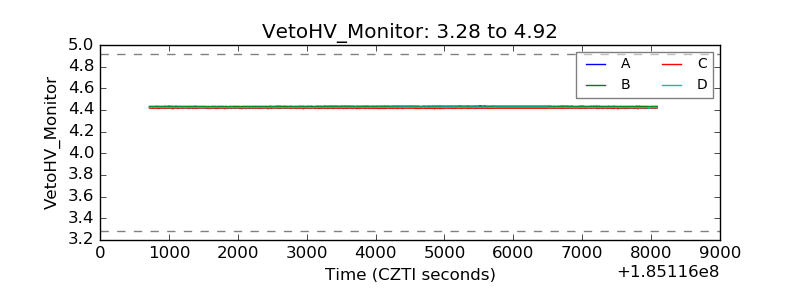 |
| Veto LLD | 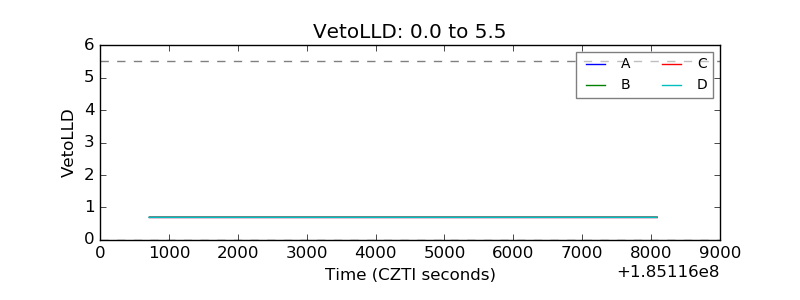 |
| Alpha Counter | 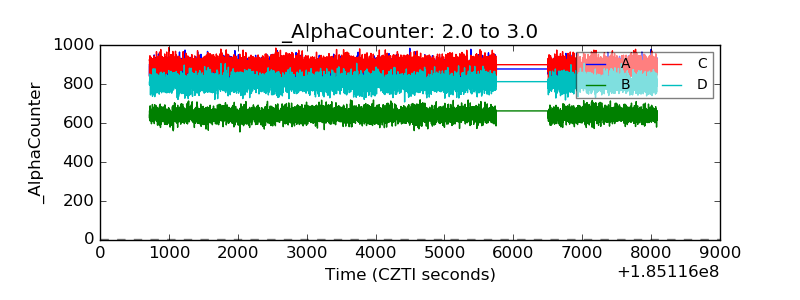 |
| _CPM_Rate | 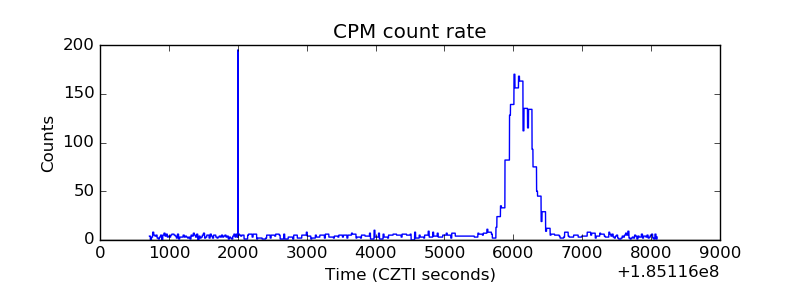 |
| CZT Counter | 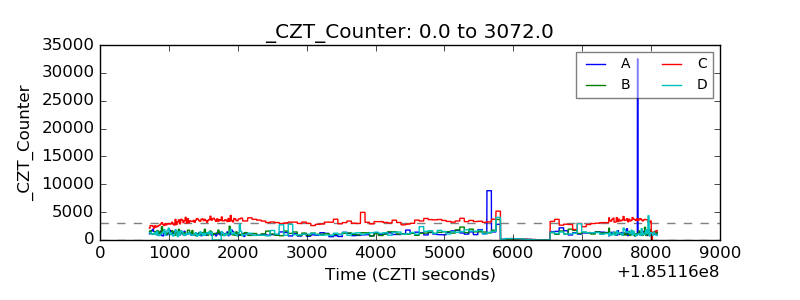 |
| +2.5 Volts monitor |  |
| +5 Volts monitor | 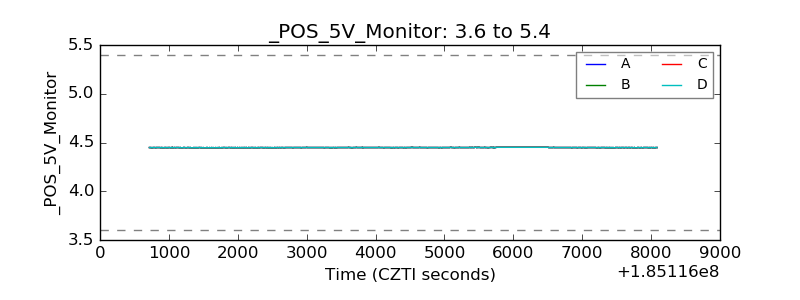 |
| _ROLL_ROT | 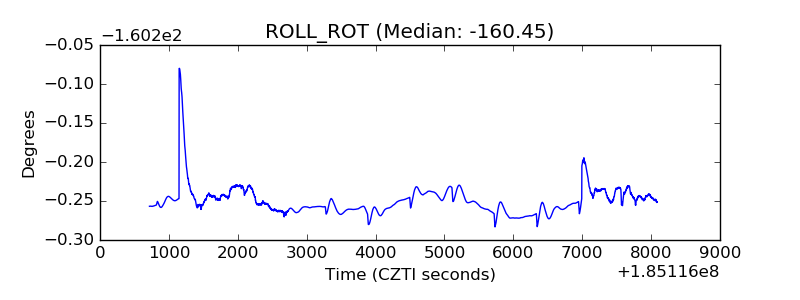 |
| _Roll_DEC | 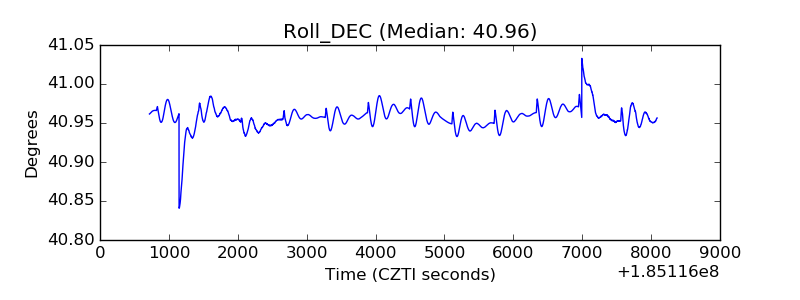 |
| _Roll_RA | 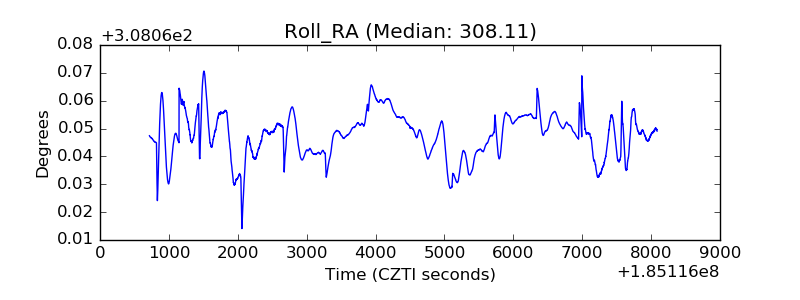 |
| Veto Counter | 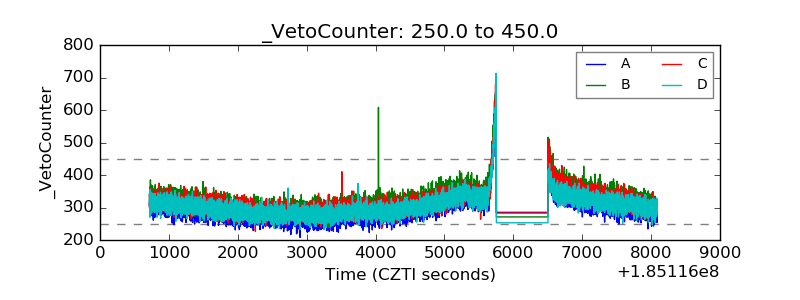 |