| Param | Original file | Final file |
|---|---|---|
| Filename | modeM0/AS1P01_147T02_9000000098_00689cztM0_level2.evt | modeM0/AS1P01_147T02_9000000098_00689cztM0_level2_quad_clean.evt |
| Size (bytes) | 1,113,935,040 | 66,018,240 |
| Size | 1.0 GB | 63.0 MB |
| Events in quadrant A | 6,977,723 | 412,359 |
| Events in quadrant B | 7,963,194 | 394,782 |
| Events in quadrant C | 10,624,094 | 373,408 |
| Events in quadrant D | 7,764,406 | 388,971 |
| Mode M9 | |||
|---|---|---|---|
| Quadrant | BADHDUFLAG | Total packets | Discarded packets |
| A | 0 | 9 | 0 |
| B | 0 | 9 | 0 |
| C | 0 | 9 | 0 |
| D | 0 | 9 | 0 |
| Mode SS | |||
|---|---|---|---|
| Quadrant | BADHDUFLAG | Total packets | Discarded packets |
| A | 0 | 126 | 0 |
| B | 0 | 126 | 0 |
| C | 0 | 126 | 0 |
| D | 0 | 126 | 0 |
| Mode M0 | |||
|---|---|---|---|
| Quadrant | BADHDUFLAG | Total packets | Discarded packets |
| A | 0 | 25130 | 1 |
| B | 0 | 28007 | 1 |
| C | 0 | 36002 | 4 |
| D | 0 | 27403 | 7 |
| Quadrant | Total seconds | Saturated seconds | Saturation percentage |
|---|---|---|---|
| A | 6146 | 7 | 0.113895% |
| B | 6146 | 193 | 3.140254% |
| C | 6123 | 803 | 13.114486% |
| D | 6145 | 55 | 0.895037% |
Noise dominated data is calculated using 1-second bins in cleaned event files. If a bin has >2000 counts, and if more than 50% of those come from <1% of pixels, then it is considered to be noise-dominated and hence unusable.
| Quadrant | # 1 sec bins | Bins with >0 counts | Bins with >2000 counts | High rate bins dominated by noise | Noise dominated (total time) | Noise dominated (detector-on time) | Marked lightcurve |
|---|---|---|---|---|---|---|---|
| A | 7036 | 6147 | 117 | 117 | 1.66% | 1.90% | 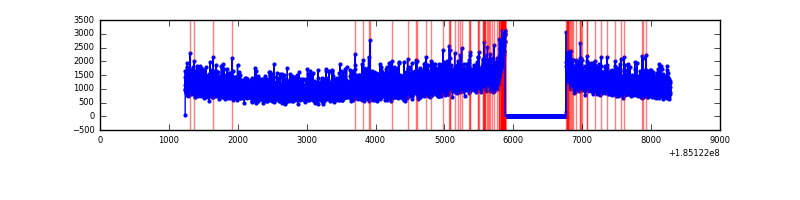 |
| B | 7036 | 6147 | 375 | 375 | 5.33% | 6.10% | 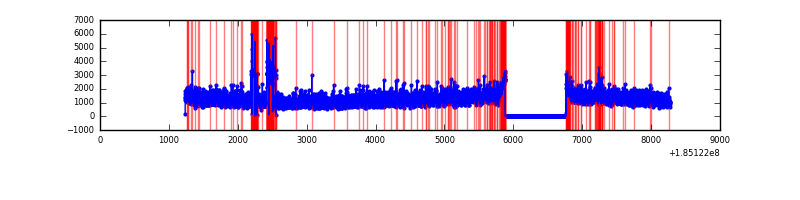 |
| C | 7036 | 6125 | 1186 | 1186 | 16.86% | 19.36% | 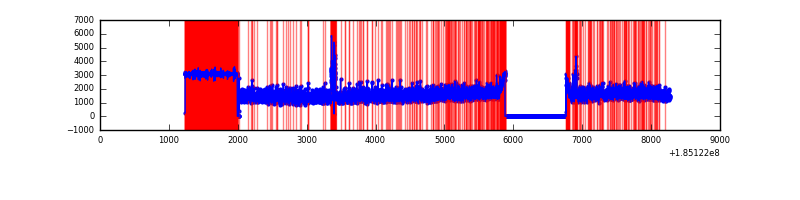 |
| D | 7036 | 6147 | 300 | 300 | 4.26% | 4.88% | 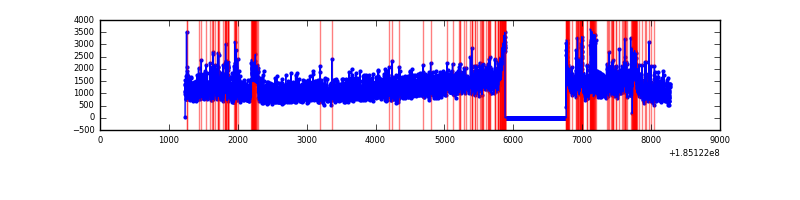 |
Top three noisy pixels from each quadrant. If the there are fewer than three noisy pixels in the level2.evt file, extra rows are filled as -1
| Pixel properties | Quadrant properties | ||||||
|---|---|---|---|---|---|---|---|
| Quadrant | DetID | PixID | Counts | Sigma | Mean | Median | Sigma |
| A | 15 | 171 | 24033 | 50.58 | 1811 | 1824 | 439.1 |
| A | 11 | 79 | 7764 | 13.53 | 1811 | 1824 | 439.1 |
| A | 14 | 79 | 6022 | 9.56 | 1811 | 1824 | 439.1 |
| B | 8 | 4 | 552645 | 1267.34 | 1849 | 1860 | 434.6 |
| B | 5 | 247 | 142189 | 322.89 | 1849 | 1860 | 434.6 |
| B | 0 | 220 | 88543 | 199.45 | 1849 | 1860 | 434.6 |
| C | 3 | 191 | 1281547 | 2713.31 | 1690 | 1754 | 471.7 |
| C | 3 | 127 | 1016493 | 2151.37 | 1690 | 1754 | 471.7 |
| C | 3 | 31 | 329898 | 695.7 | 1690 | 1754 | 471.7 |
| D | 0 | 25 | 694046 | 1327.1 | 1687 | 1751 | 521.7 |
| D | 14 | 52 | 418447 | 798.79 | 1687 | 1751 | 521.7 |
| D | 1 | 4 | 147107 | 278.64 | 1687 | 1751 | 521.7 |
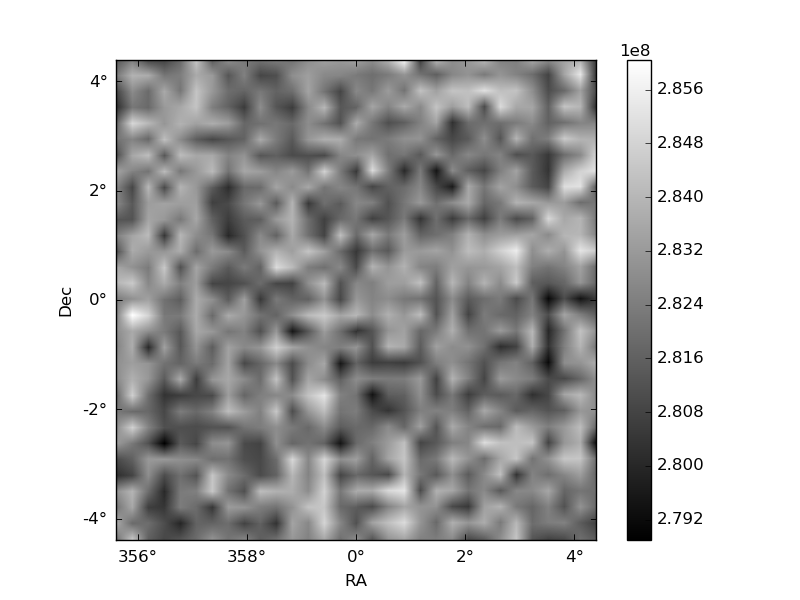
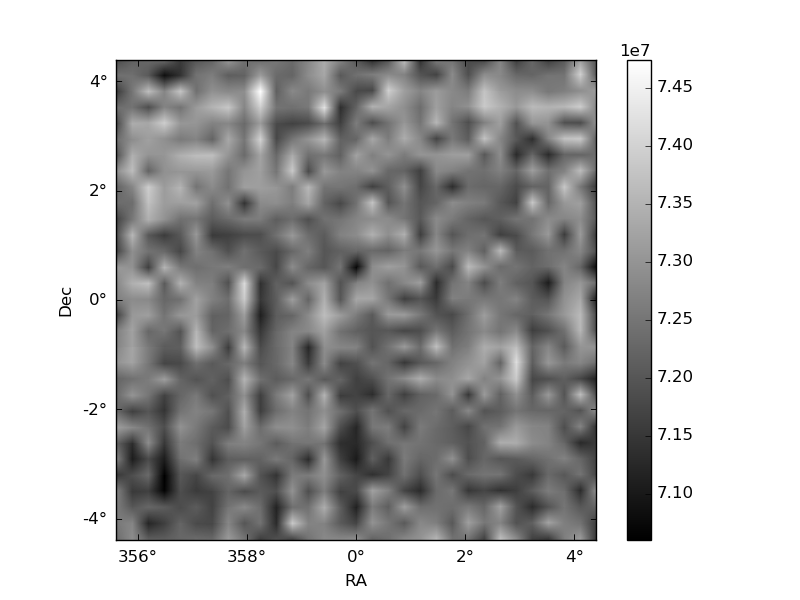
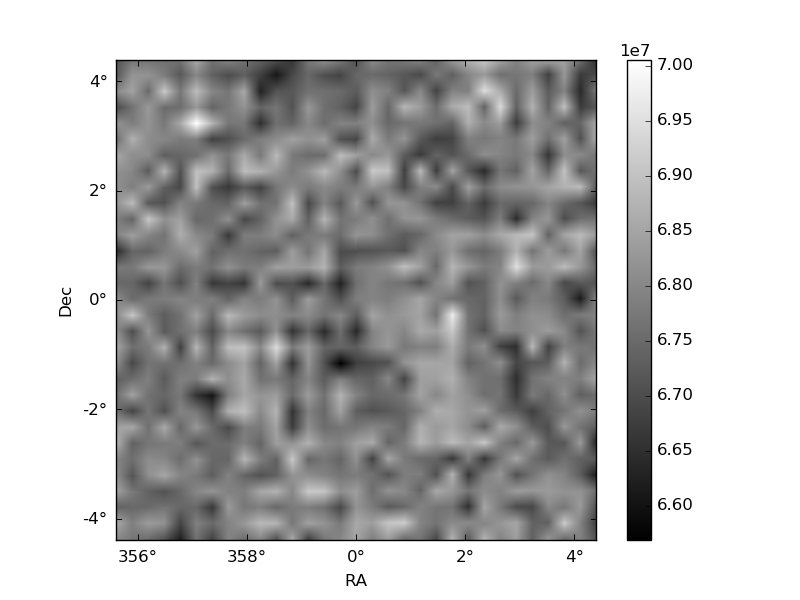
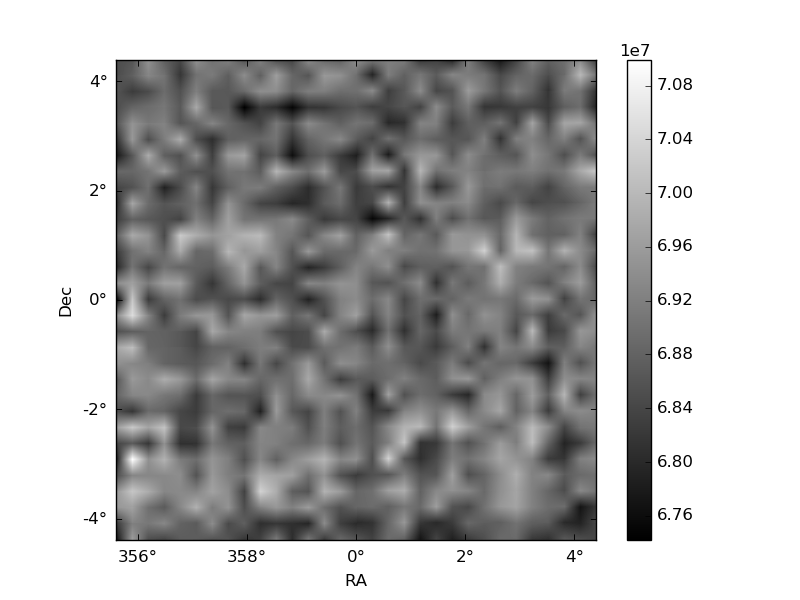
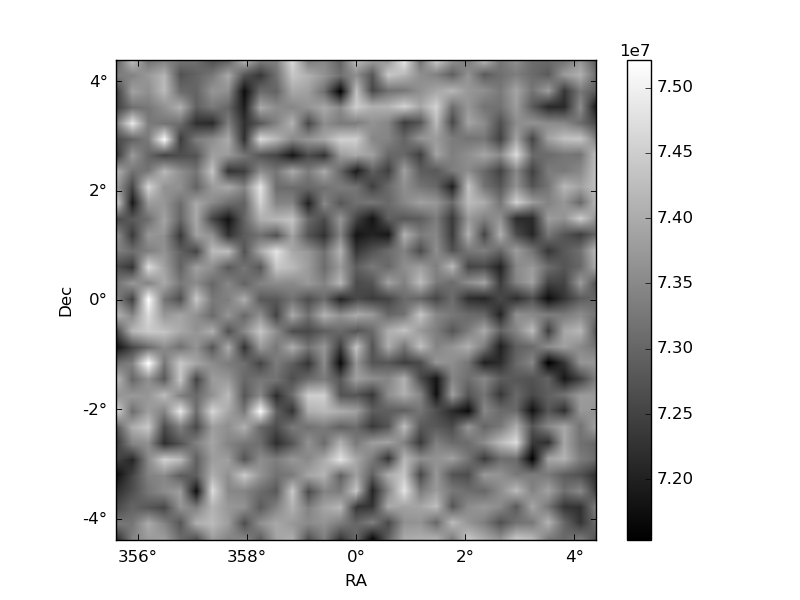
Histogram calculated using DETX and DETY for each event in the final _common_clean file
| Quadrant A | 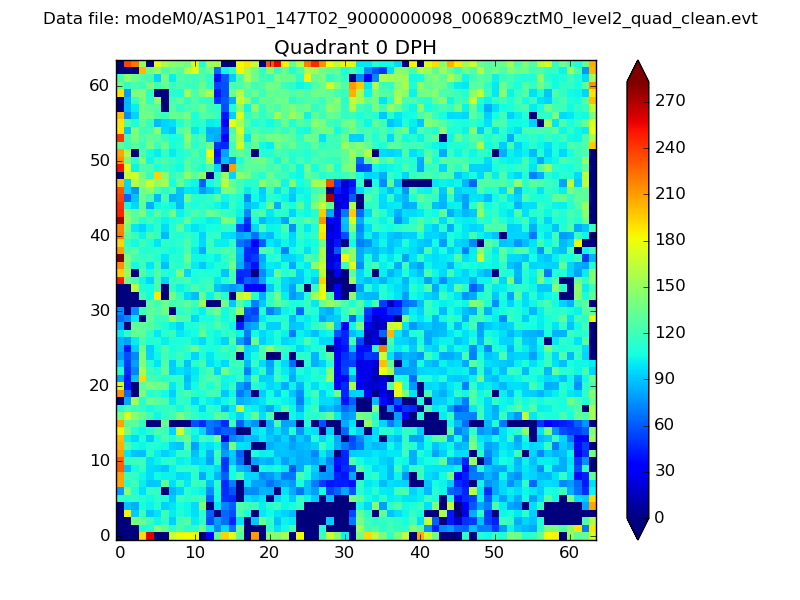 |
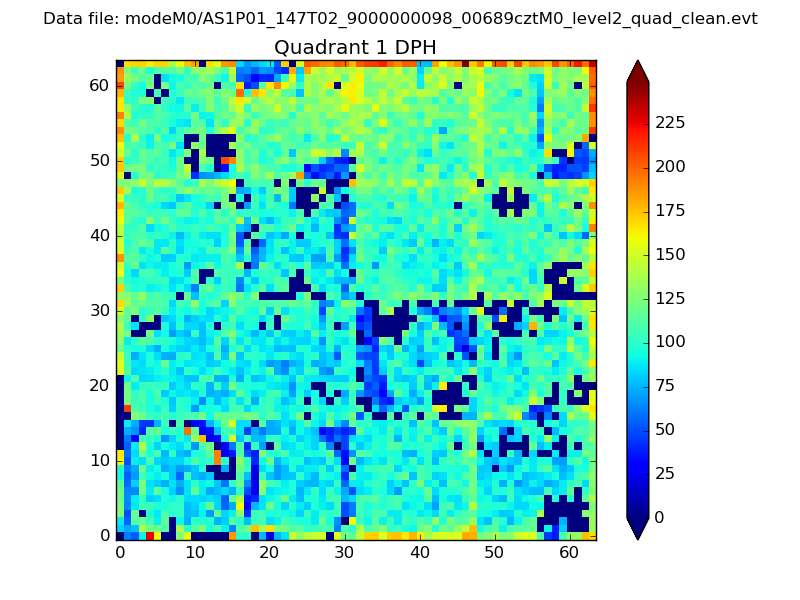 |
Quadrant B |
|---|---|---|---|
| Quadrant D | 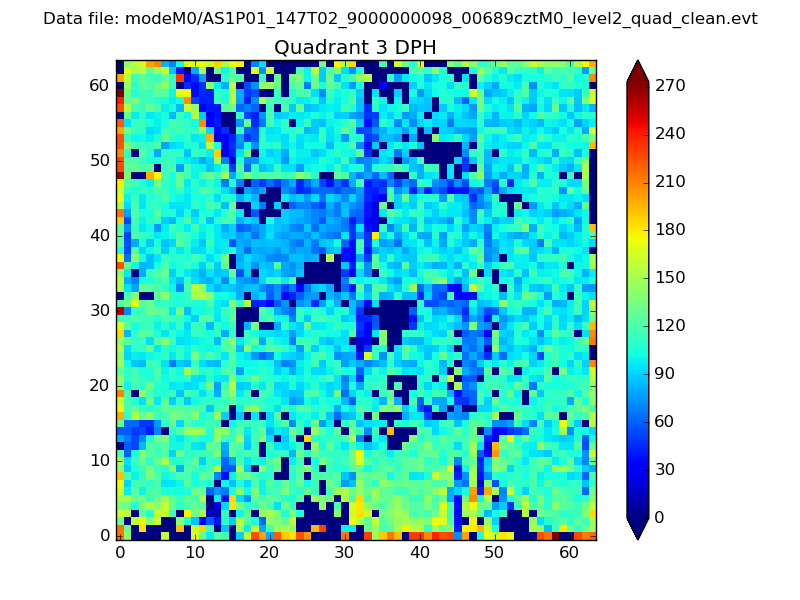 |
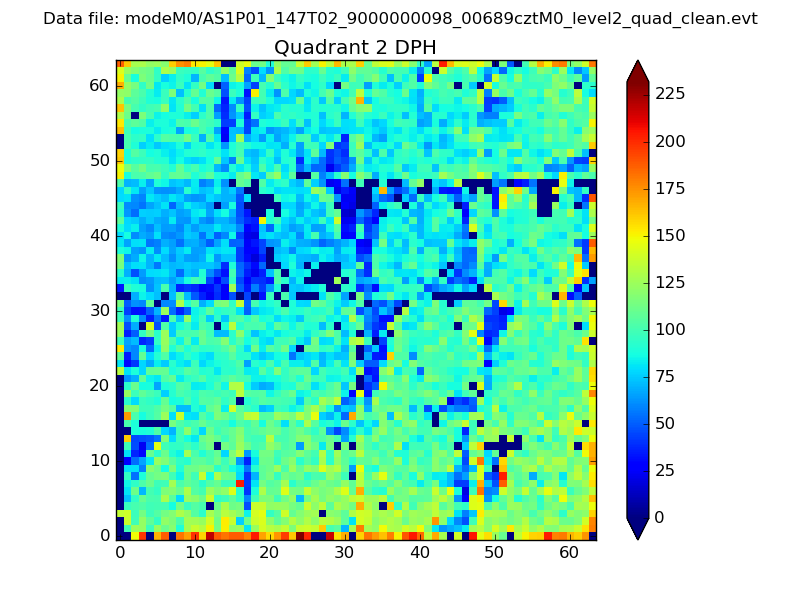 |
Quadrant C |
| Plot type | Count rate plots | Images |
|---|---|---|
| Comparison with Poisson distribution Blue bars denote a histogram of data divided into 1 sec bins. Red curve is a Poisson curve with rate = median count rate of data. |
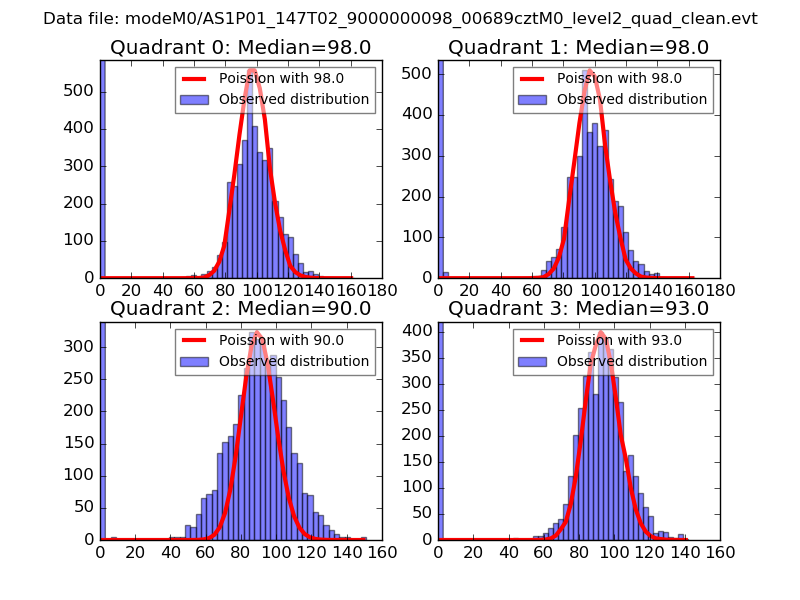 |
 |
| Quadrant-wise count rates Data is divided into 100 sec bins |
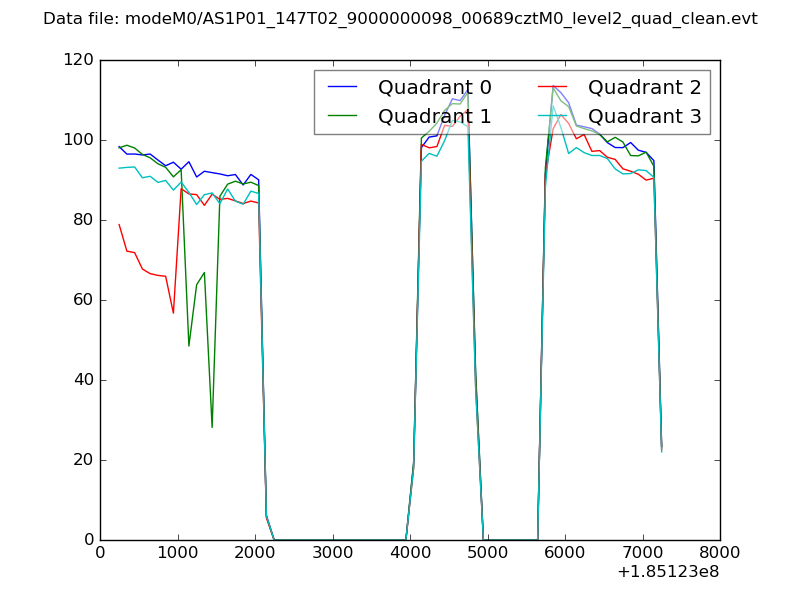 |
|
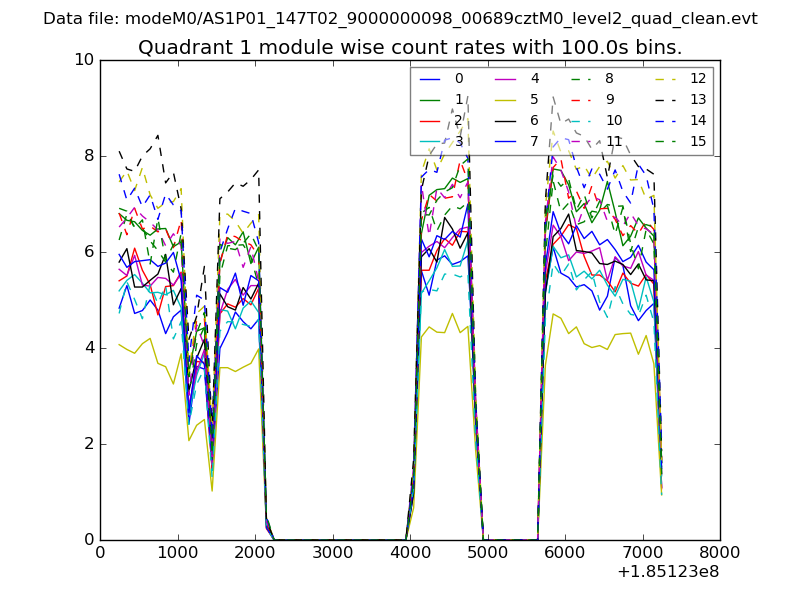
| Module-wise count rates for Quadrant A Data is divided into 100 sec bins |
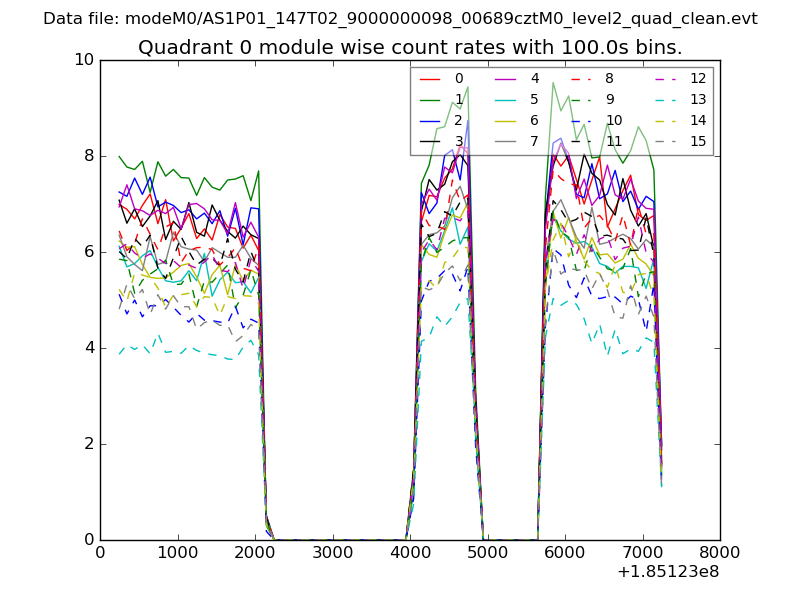 |
 |
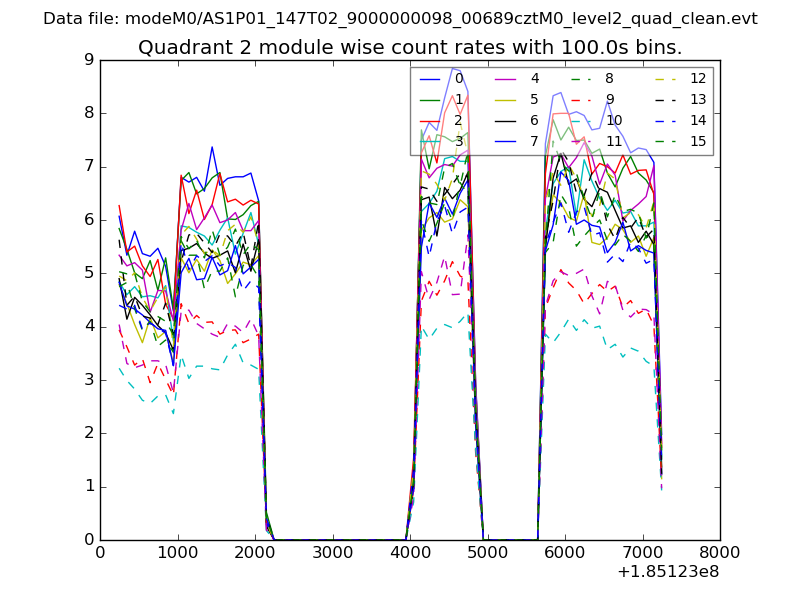
| Module-wise count rates for Quadrant B Data is divided into 100 sec bins |
 |
 |
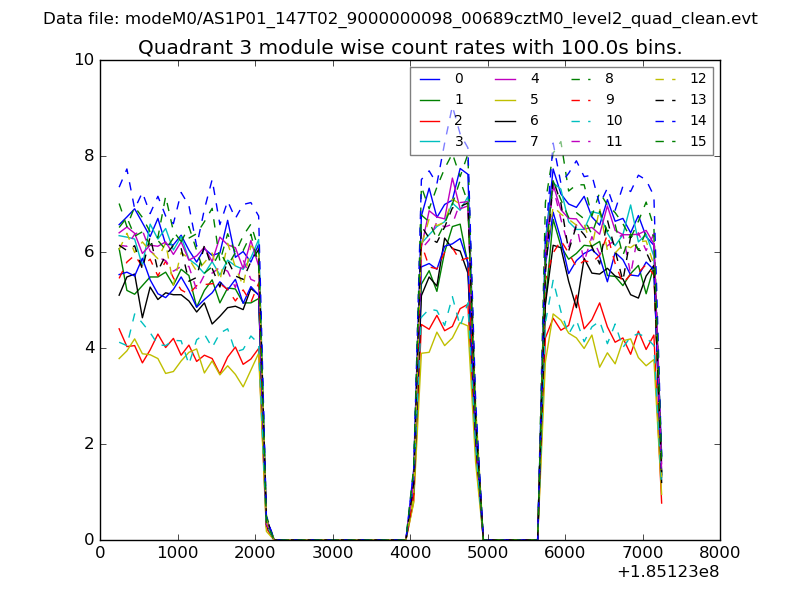
| Module-wise count rates for Quadrant C Data is divided into 100 sec bins |
 |
 |
| Module-wise count rates for Quadrant D Data is divided into 100 sec bins |
 |
 |
| Parameter | Plot |
|---|---|
| CZT HV Monitor | 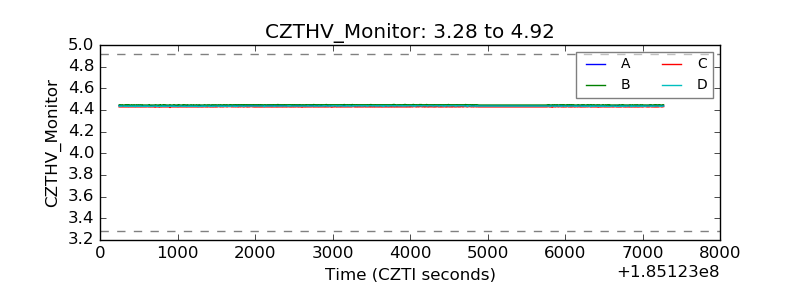 |
| D_VDD | 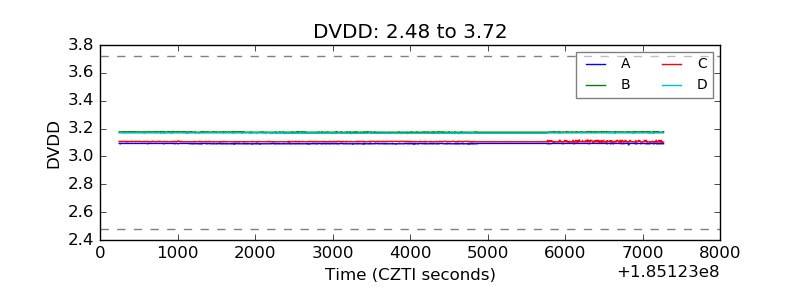 |
| Temperature 1 | 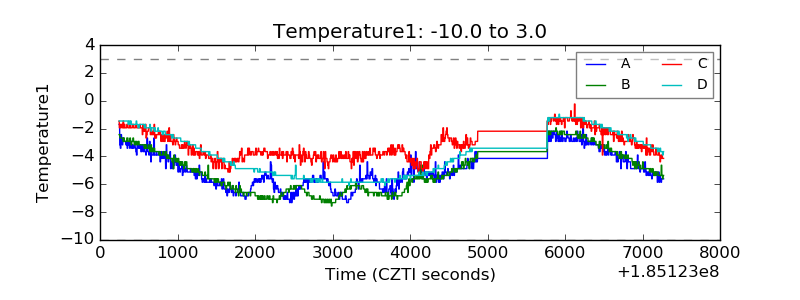 |
| Veto HV Monitor | 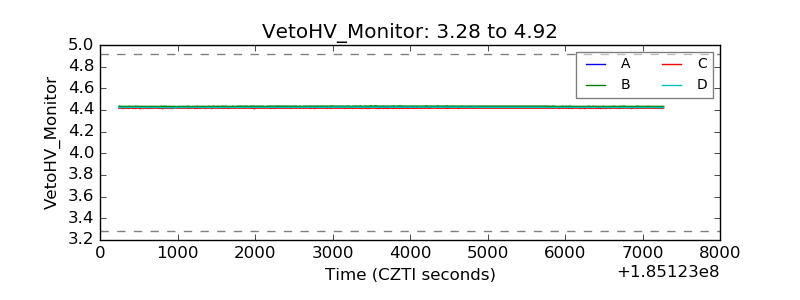 |
| Veto LLD | 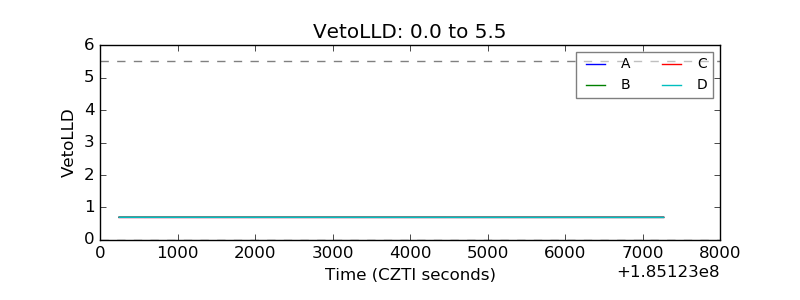 |
| Alpha Counter | 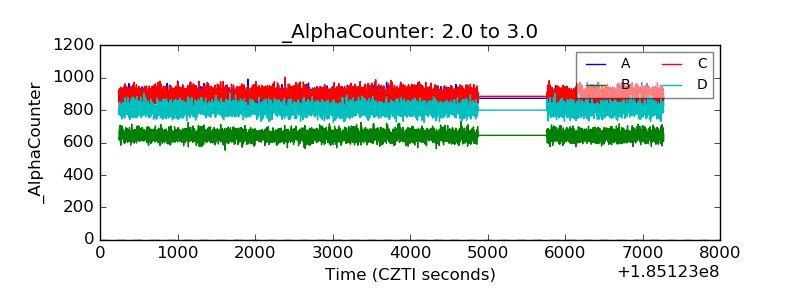 |
| _CPM_Rate | 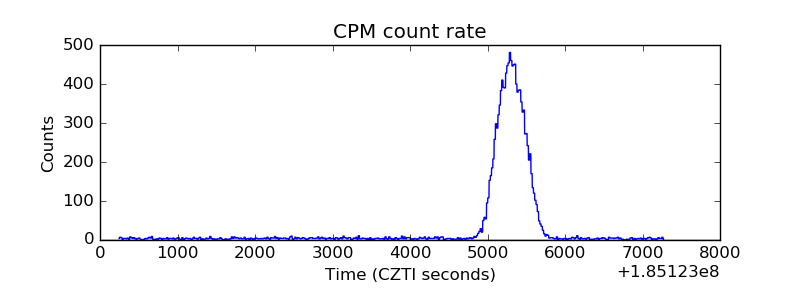 |
| CZT Counter | 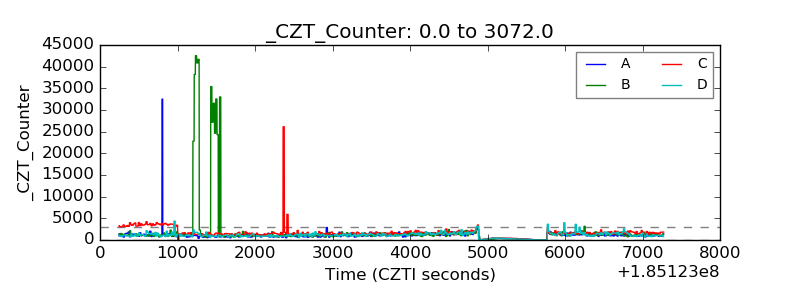 |
| +2.5 Volts monitor |  |
| +5 Volts monitor |  |
| _ROLL_ROT | 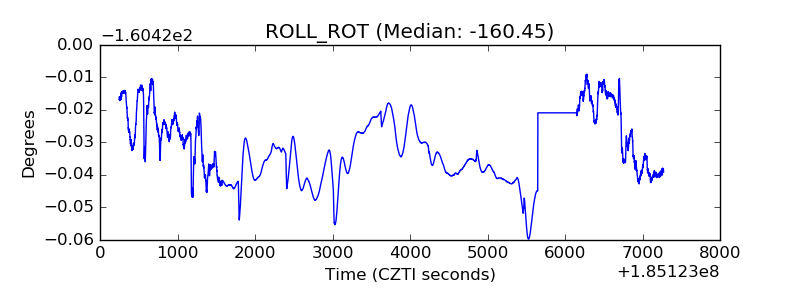 |
| _Roll_DEC | 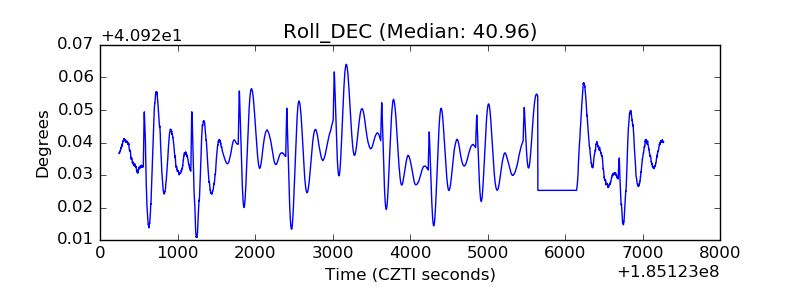 |
| _Roll_RA | 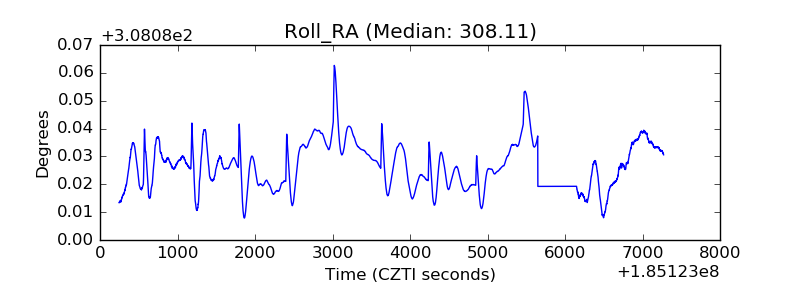 |
| Veto Counter | 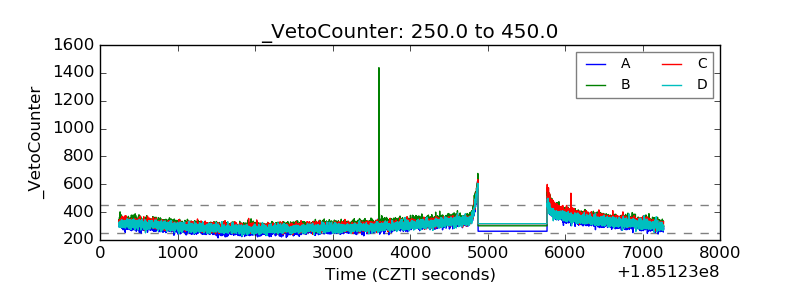 |