| Param | Original file | Final file |
|---|---|---|
| Filename | modeM0/AS1P01_147T02_9000000098_00692cztM0_level2.evt | modeM0/AS1P01_147T02_9000000098_00692cztM0_level2_quad_clean.evt |
| Size (bytes) | 1,030,959,360 | 72,970,560 |
| Size | 983.2 MB | 69.6 MB |
| Events in quadrant A | 7,006,923 | 450,844 |
| Events in quadrant B | 7,629,122 | 455,266 |
| Events in quadrant C | 9,294,936 | 435,715 |
| Events in quadrant D | 6,878,106 | 431,999 |
| Mode M9 | |||
|---|---|---|---|
| Quadrant | BADHDUFLAG | Total packets | Discarded packets |
| A | 0 | 11 | 0 |
| B | 0 | 11 | 0 |
| C | 0 | 11 | 0 |
| D | 0 | 11 | 0 |
| Mode SS | |||
|---|---|---|---|
| Quadrant | BADHDUFLAG | Total packets | Discarded packets |
| A | 0 | 128 | 0 |
| B | 0 | 128 | 0 |
| C | 0 | 128 | 0 |
| D | 0 | 128 | 0 |
| Mode M0 | |||
|---|---|---|---|
| Quadrant | BADHDUFLAG | Total packets | Discarded packets |
| A | 0 | 25248 | 1 |
| B | 0 | 27122 | 1 |
| C | 0 | 31974 | 1 |
| D | 0 | 24910 | 2 |
| Quadrant | Total seconds | Saturated seconds | Saturation percentage |
|---|---|---|---|
| A | 6238 | 10 | 0.160308% |
| B | 6238 | 10 | 0.160308% |
| C | 6238 | 27 | 0.432831% |
| D | 6237 | 14 | 0.224467% |
Noise dominated data is calculated using 1-second bins in cleaned event files. If a bin has >2000 counts, and if more than 50% of those come from <1% of pixels, then it is considered to be noise-dominated and hence unusable.
| Quadrant | # 1 sec bins | Bins with >0 counts | Bins with >2000 counts | High rate bins dominated by noise | Noise dominated (total time) | Noise dominated (detector-on time) | Marked lightcurve |
|---|---|---|---|---|---|---|---|
| A | 7373 | 6239 | 120 | 120 | 1.63% | 1.92% | 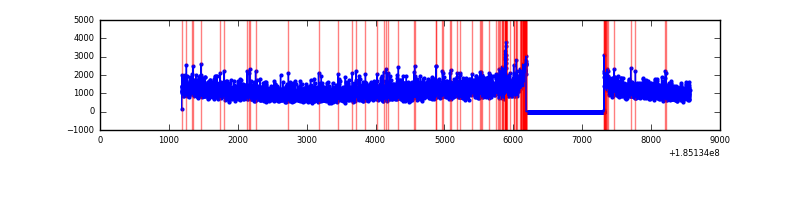 |
| B | 7373 | 6239 | 144 | 144 | 1.95% | 2.31% | 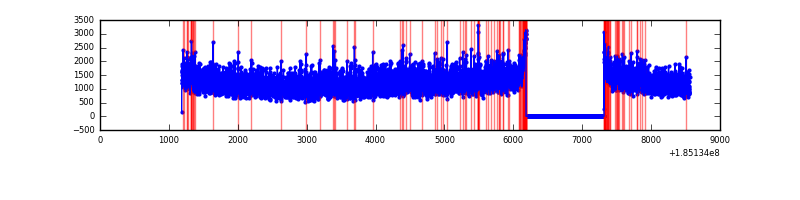 |
| C | 7373 | 6239 | 366 | 366 | 4.96% | 5.87% | 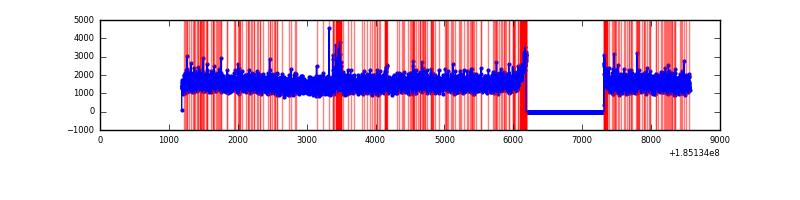 |
| D | 7372 | 6238 | 112 | 112 | 1.52% | 1.80% | 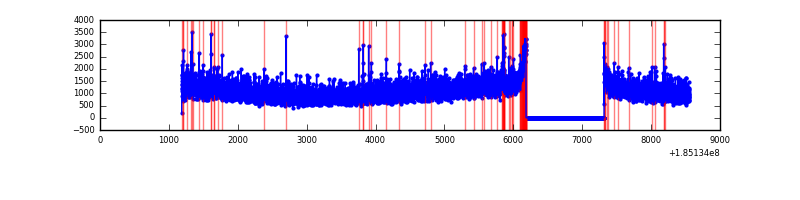 |
Top three noisy pixels from each quadrant. If the there are fewer than three noisy pixels in the level2.evt file, extra rows are filled as -1
| Pixel properties | Quadrant properties | ||||||
|---|---|---|---|---|---|---|---|
| Quadrant | DetID | PixID | Counts | Sigma | Mean | Median | Sigma |
| A | 12 | 133 | 27989 | 60.16 | 1816 | 1830 | 434.8 |
| A | 11 | 79 | 6956 | 11.79 | 1816 | 1830 | 434.8 |
| A | 3 | 111 | 5978 | 9.54 | 1816 | 1830 | 434.8 |
| B | 5 | 247 | 149771 | 329.07 | 1919 | 1930 | 449.3 |
| B | 7 | 221 | 62336 | 134.45 | 1919 | 1930 | 449.3 |
| B | 0 | 220 | 58856 | 126.71 | 1919 | 1930 | 449.3 |
| C | 3 | 127 | 1051957 | 2124.82 | 1779 | 1850 | 494.2 |
| C | 3 | 31 | 267720 | 537.97 | 1779 | 1850 | 494.2 |
| C | 3 | 15 | 238346 | 478.53 | 1779 | 1850 | 494.2 |
| D | 0 | 25 | 310912 | 589.24 | 1707 | 1769 | 524.6 |
| D | 1 | 4 | 111405 | 208.97 | 1707 | 1769 | 524.6 |
| D | 13 | 37 | 22238 | 39.01 | 1707 | 1769 | 524.6 |
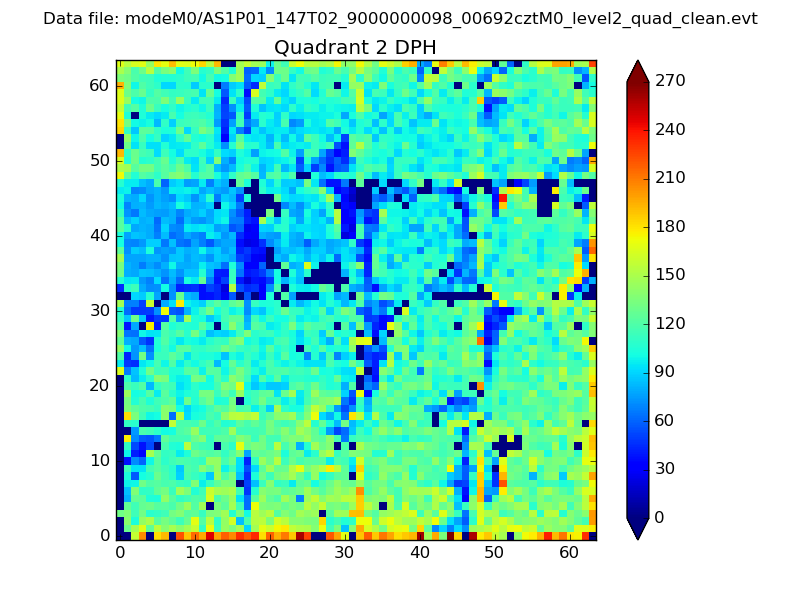
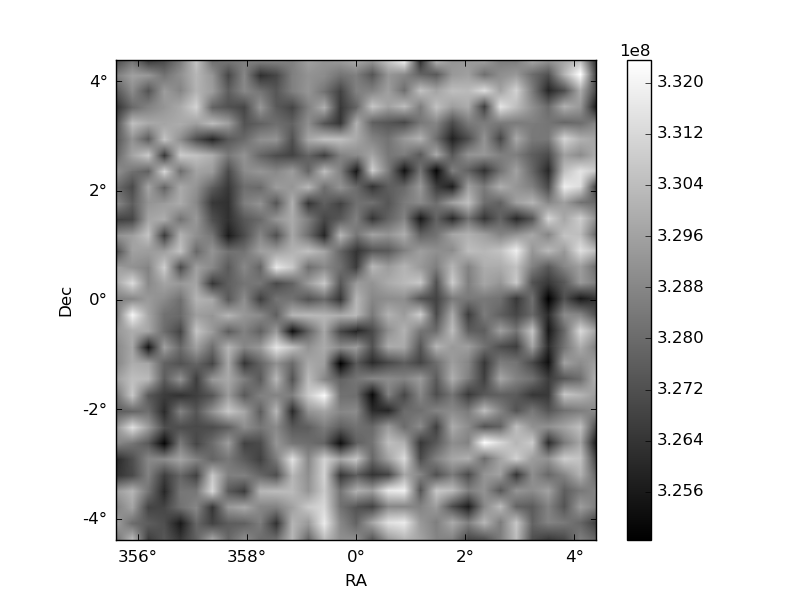
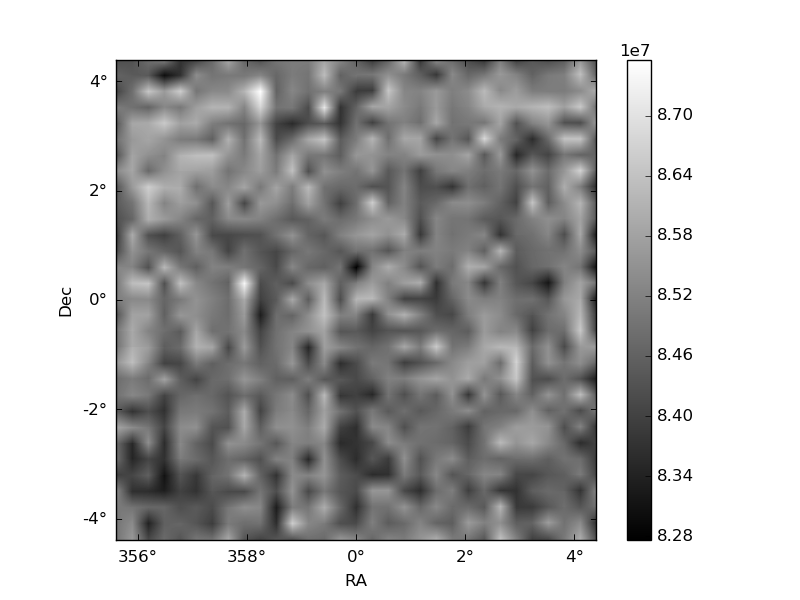
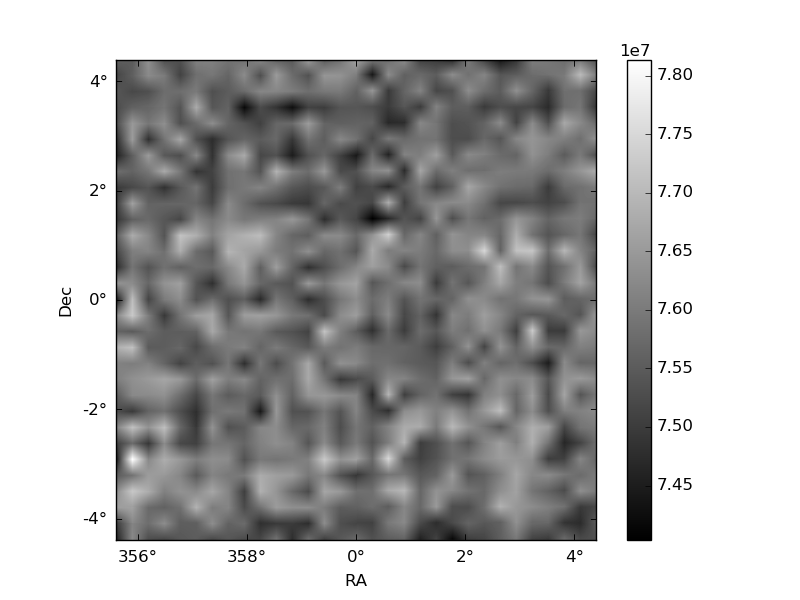
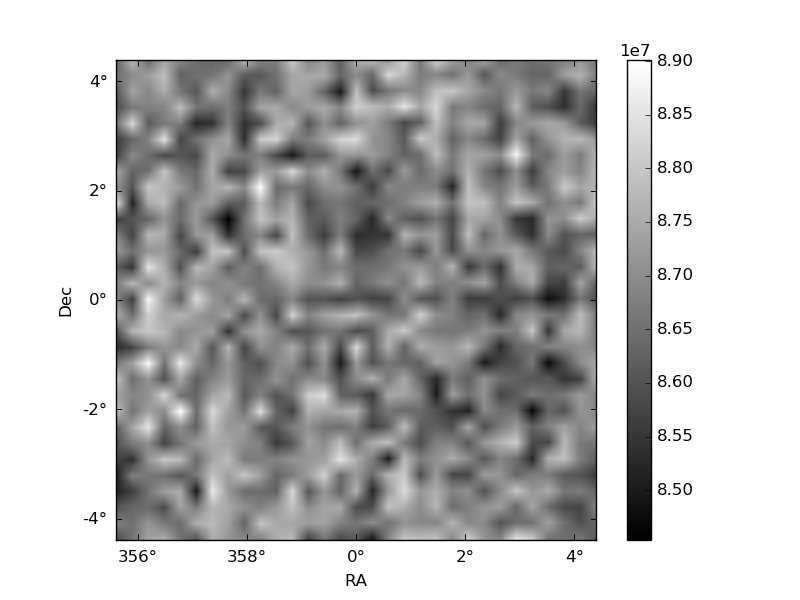
Histogram calculated using DETX and DETY for each event in the final _common_clean file
| Quadrant A | 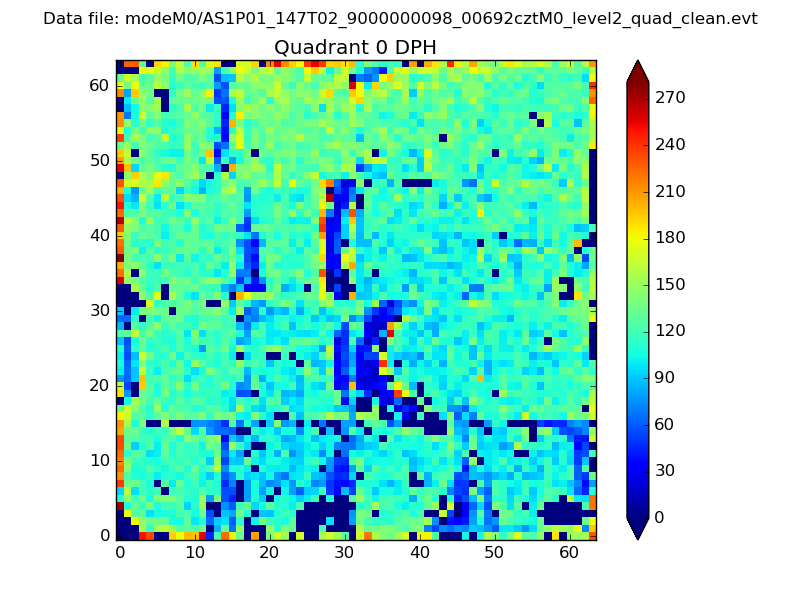 |
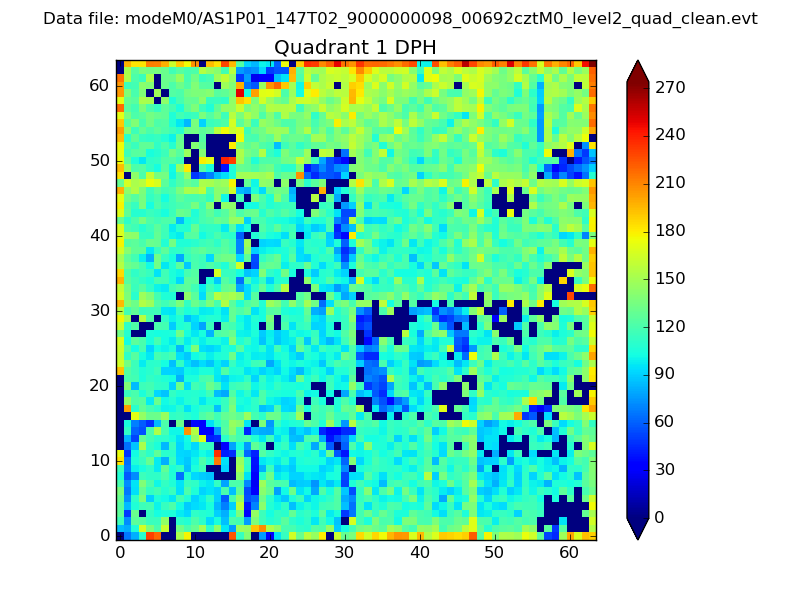 |
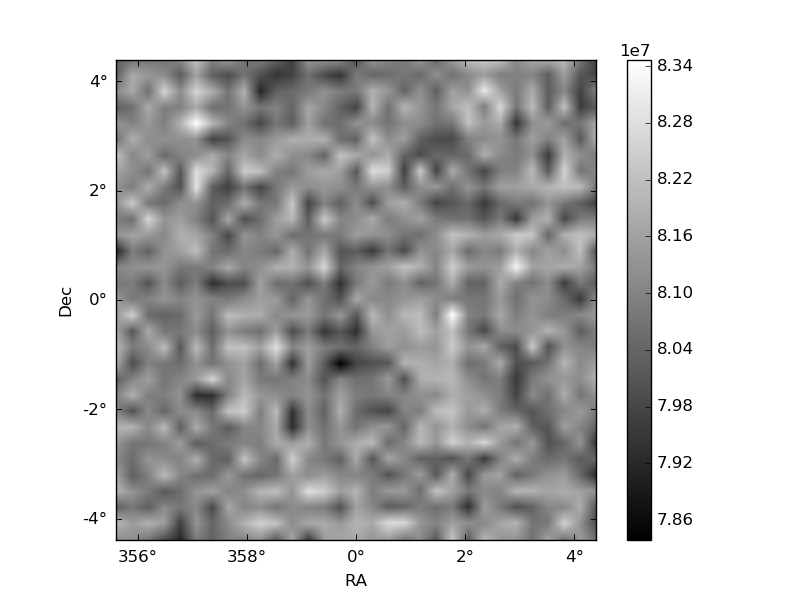
Quadrant B |
|---|---|---|---|
| Quadrant D | 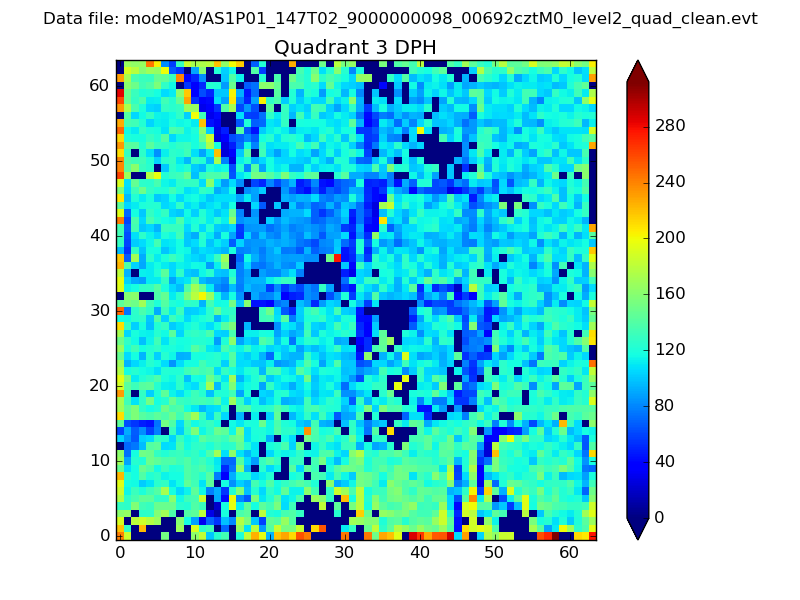 |
 |
Quadrant C |
| Plot type | Count rate plots | Images |
|---|---|---|
| Comparison with Poisson distribution Blue bars denote a histogram of data divided into 1 sec bins. Red curve is a Poisson curve with rate = median count rate of data. |
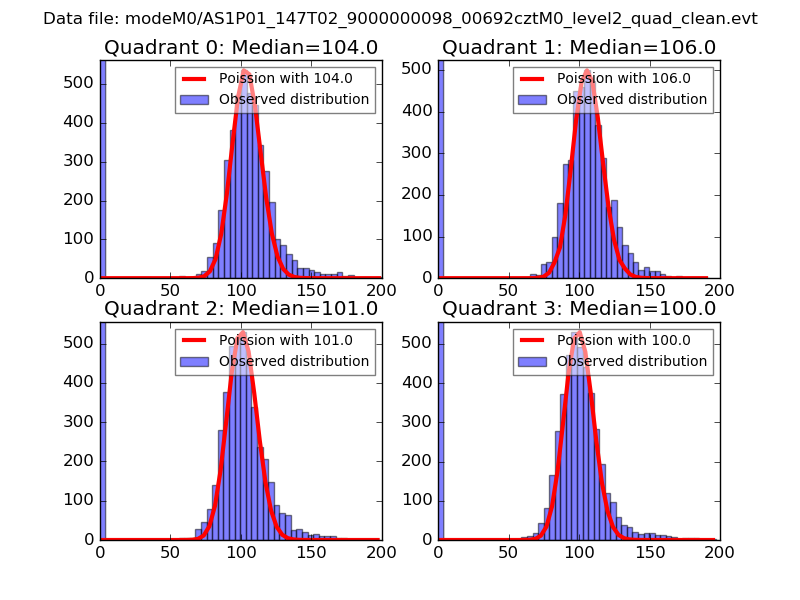 |
 |
| Quadrant-wise count rates Data is divided into 100 sec bins |
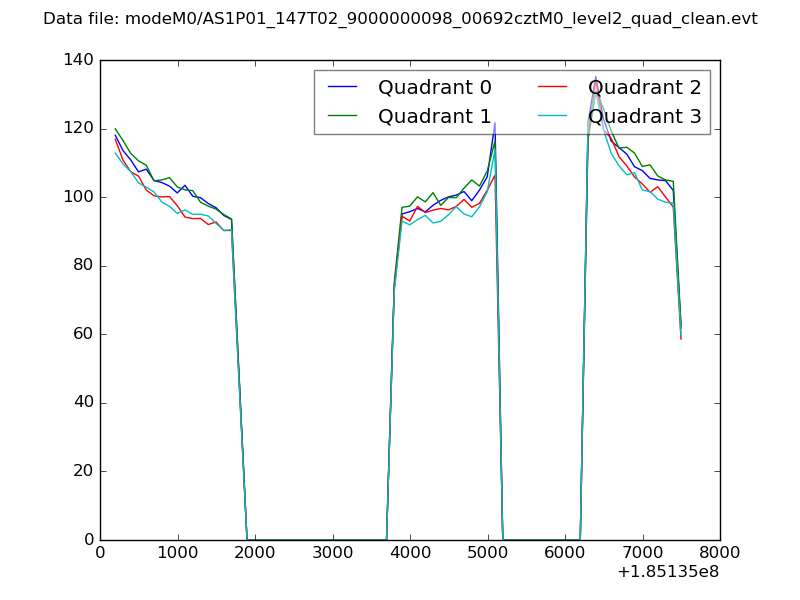 |
|
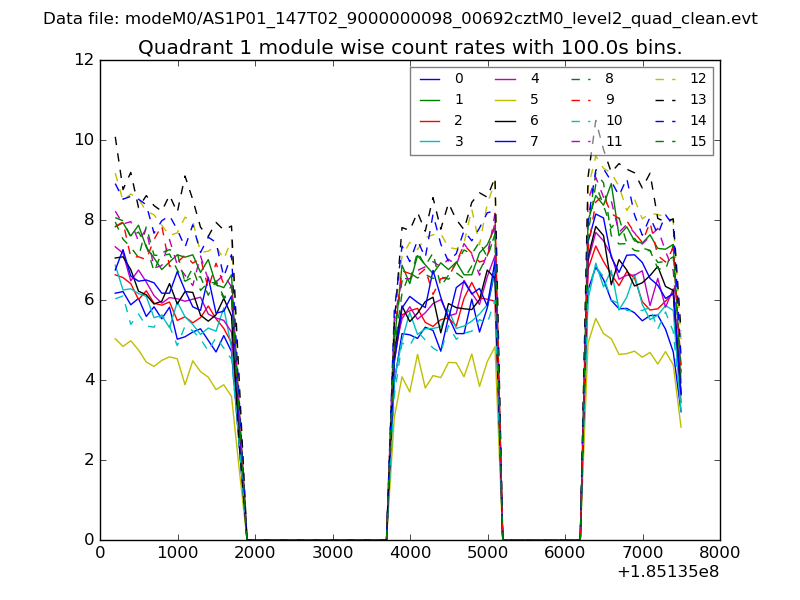
| Module-wise count rates for Quadrant A Data is divided into 100 sec bins |
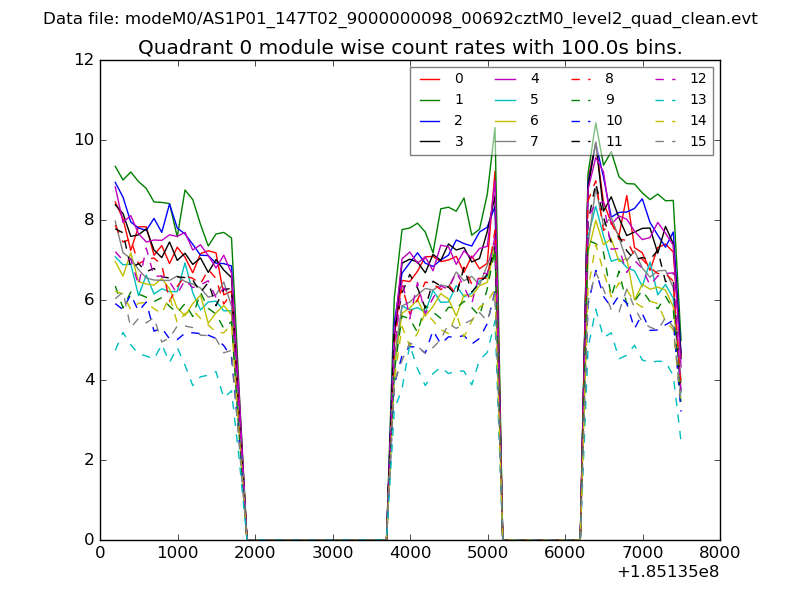 |
 |
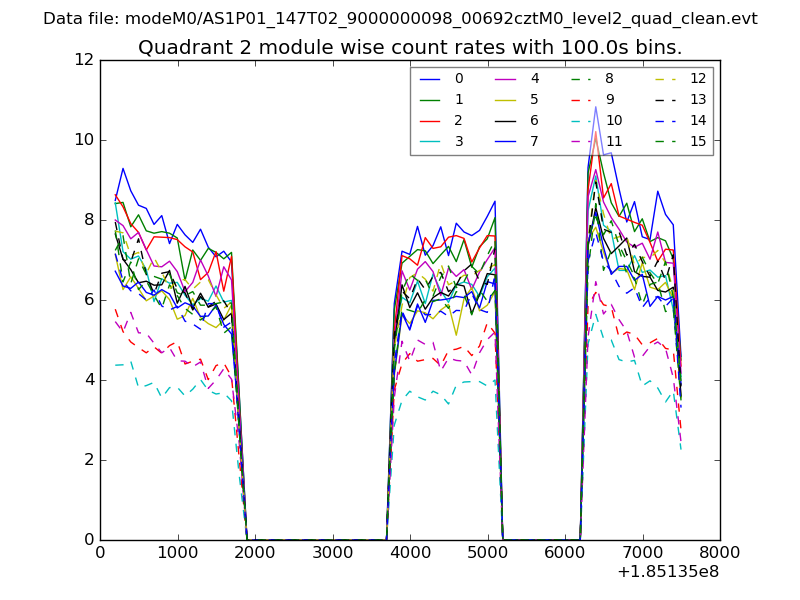
| Module-wise count rates for Quadrant B Data is divided into 100 sec bins |
 |
 |
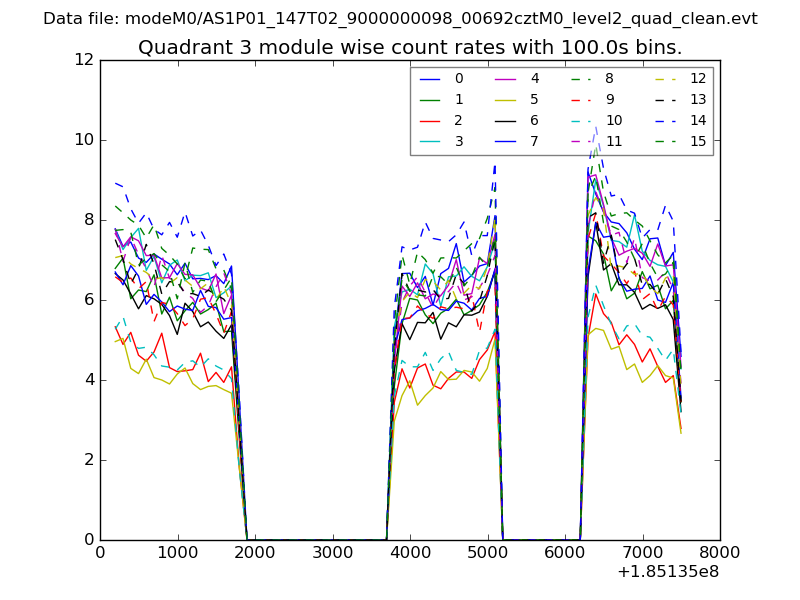
| Module-wise count rates for Quadrant C Data is divided into 100 sec bins |
 |
 |
| Module-wise count rates for Quadrant D Data is divided into 100 sec bins |
 |
 |
| Parameter | Plot |
|---|---|
| CZT HV Monitor | 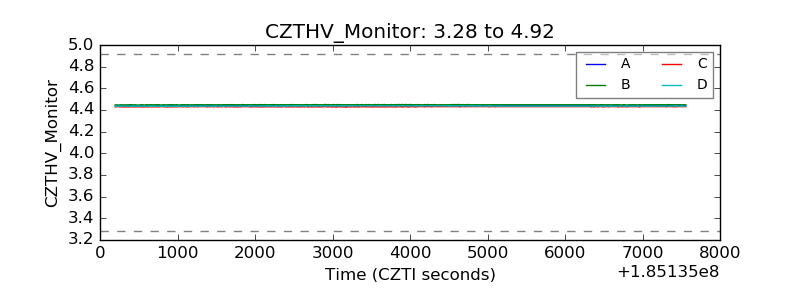 |
| D_VDD | 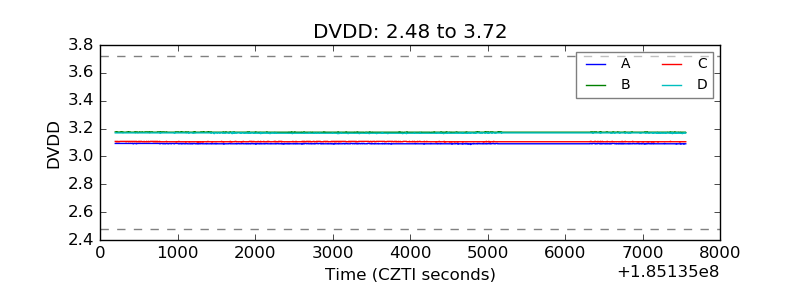 |
| Temperature 1 | 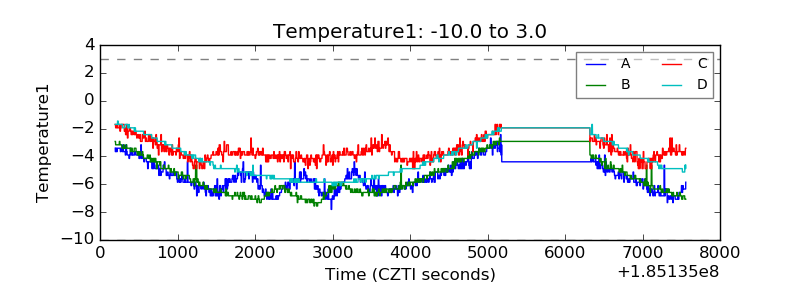 |
| Veto HV Monitor | 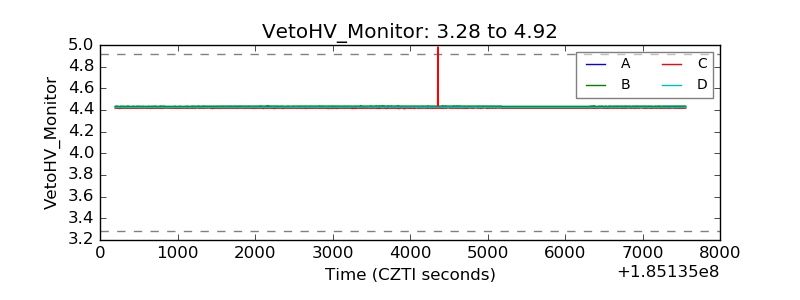 |
| Veto LLD | 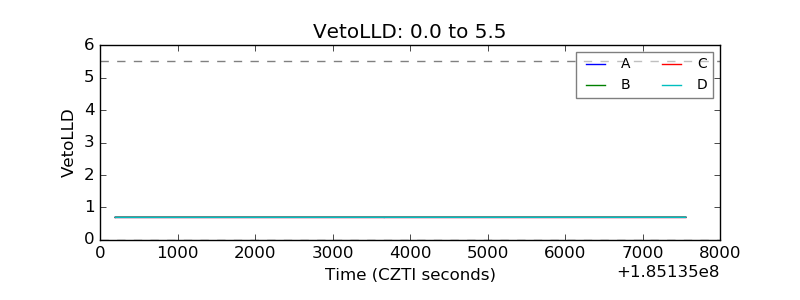 |
| Alpha Counter | 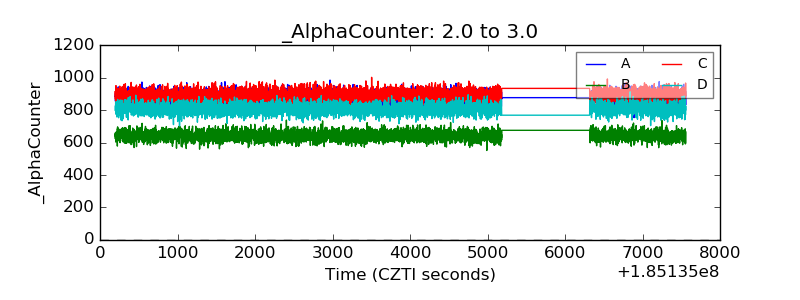 |
| _CPM_Rate | 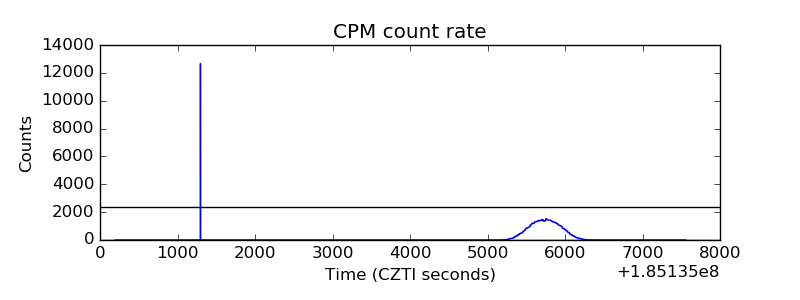 |
| CZT Counter | 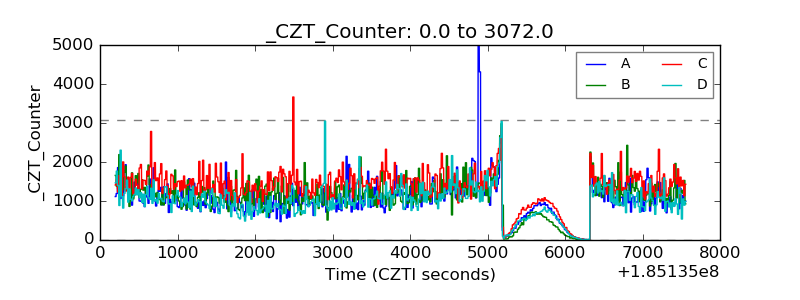 |
| +2.5 Volts monitor |  |
| +5 Volts monitor |  |
| _ROLL_ROT | 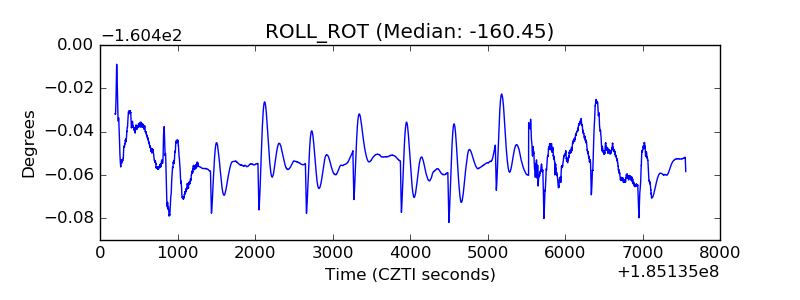 |
| _Roll_DEC | 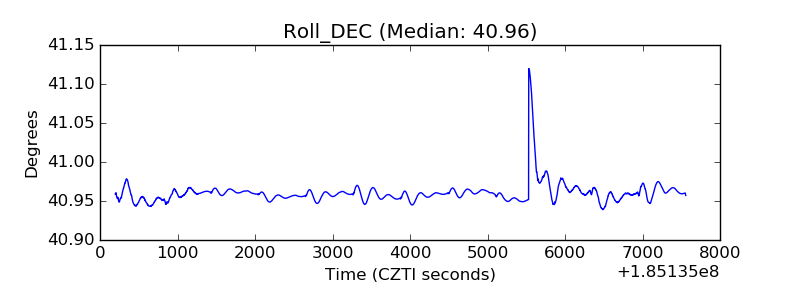 |
| _Roll_RA |  |
| Veto Counter | 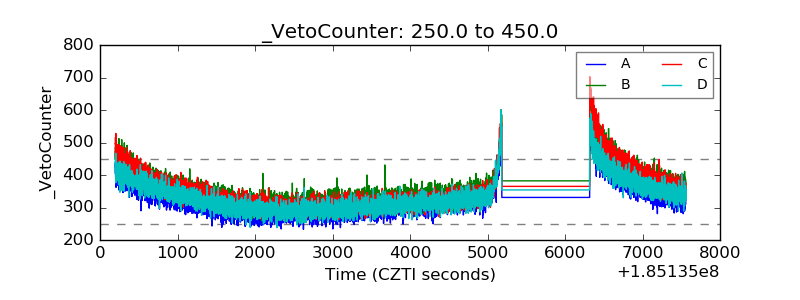 |