| Param | Original file | Final file |
|---|---|---|
| Filename | modeM0/AS1P01_147T02_9000000098_00693cztM0_level2.evt | modeM0/AS1P01_147T02_9000000098_00693cztM0_level2_quad_clean.evt |
| Size (bytes) | 1,072,241,280 | 71,040,960 |
| Size | 1022.6 MB | 67.7 MB |
| Events in quadrant A | 7,226,118 | 433,089 |
| Events in quadrant B | 7,798,769 | 441,871 |
| Events in quadrant C | 9,398,912 | 422,975 |
| Events in quadrant D | 7,629,835 | 410,832 |
| Mode M9 | |||
|---|---|---|---|
| Quadrant | BADHDUFLAG | Total packets | Discarded packets |
| A | 0 | 12 | 0 |
| B | 0 | 12 | 0 |
| C | 0 | 12 | 0 |
| D | 0 | 12 | 0 |
| Mode SS | |||
|---|---|---|---|
| Quadrant | BADHDUFLAG | Total packets | Discarded packets |
| A | 0 | 130 | 0 |
| B | 0 | 130 | 0 |
| C | 0 | 130 | 0 |
| D | 0 | 130 | 0 |
| Mode M0 | |||
|---|---|---|---|
| Quadrant | BADHDUFLAG | Total packets | Discarded packets |
| A | 0 | 25977 | 2 |
| B | 0 | 27654 | 2 |
| C | 0 | 32327 | 2 |
| D | 0 | 27200 | 6 |
| Quadrant | Total seconds | Saturated seconds | Saturation percentage |
|---|---|---|---|
| A | 6332 | 7 | 0.110550% |
| B | 6333 | 15 | 0.236855% |
| C | 6333 | 25 | 0.394758% |
| D | 6332 | 22 | 0.347442% |
Noise dominated data is calculated using 1-second bins in cleaned event files. If a bin has >2000 counts, and if more than 50% of those come from <1% of pixels, then it is considered to be noise-dominated and hence unusable.
| Quadrant | # 1 sec bins | Bins with >0 counts | Bins with >2000 counts | High rate bins dominated by noise | Noise dominated (total time) | Noise dominated (detector-on time) | Marked lightcurve |
|---|---|---|---|---|---|---|---|
| A | 7542 | 6333 | 145 | 145 | 1.92% | 2.29% |  |
| B | 7543 | 6334 | 202 | 202 | 2.68% | 3.19% |  |
| C | 7543 | 6334 | 351 | 351 | 4.65% | 5.54% | 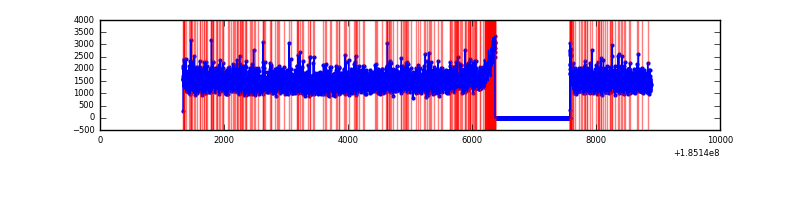 |
| D | 7542 | 6333 | 497 | 497 | 6.59% | 7.85% |  |
Top three noisy pixels from each quadrant. If the there are fewer than three noisy pixels in the level2.evt file, extra rows are filled as -1
| Pixel properties | Quadrant properties | ||||||
|---|---|---|---|---|---|---|---|
| Quadrant | DetID | PixID | Counts | Sigma | Mean | Median | Sigma |
| A | 12 | 133 | 55722 | 120.56 | 1866 | 1879 | 446.6 |
| A | 11 | 79 | 9060 | 16.08 | 1866 | 1879 | 446.6 |
| A | 3 | 111 | 5968 | 9.16 | 1866 | 1879 | 446.6 |
| B | 5 | 247 | 103432 | 219.6 | 1977 | 1985 | 462.0 |
| B | 0 | 220 | 70966 | 149.32 | 1977 | 1985 | 462.0 |
| B | 7 | 221 | 50441 | 104.89 | 1977 | 1985 | 462.0 |
| C | 3 | 127 | 1028185 | 2029.68 | 1821 | 1887 | 505.6 |
| C | 3 | 31 | 260689 | 511.83 | 1821 | 1887 | 505.6 |
| C | 3 | 15 | 240748 | 472.39 | 1821 | 1887 | 505.6 |
| D | 13 | 72 | 836295 | 1558.66 | 1743 | 1807 | 535.4 |
| D | 0 | 25 | 171683 | 317.29 | 1743 | 1807 | 535.4 |
| D | 1 | 4 | 56334 | 101.84 | 1743 | 1807 | 535.4 |
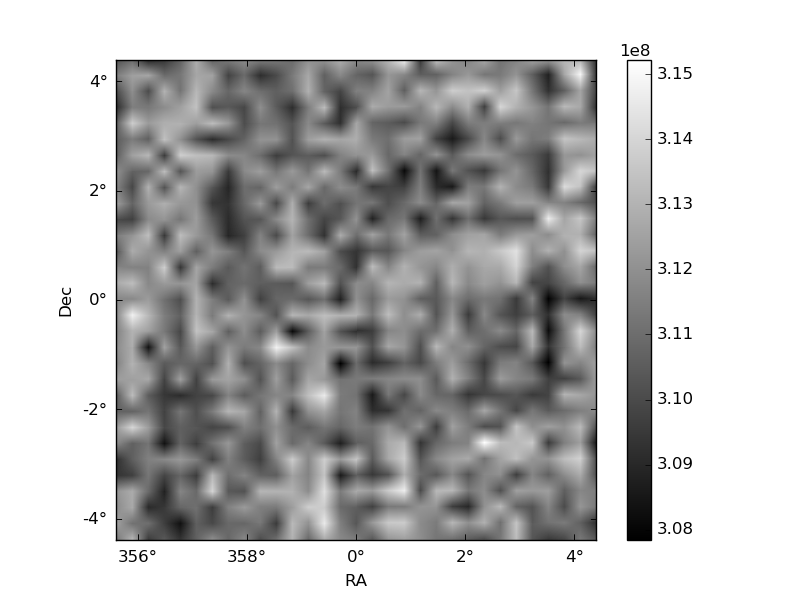
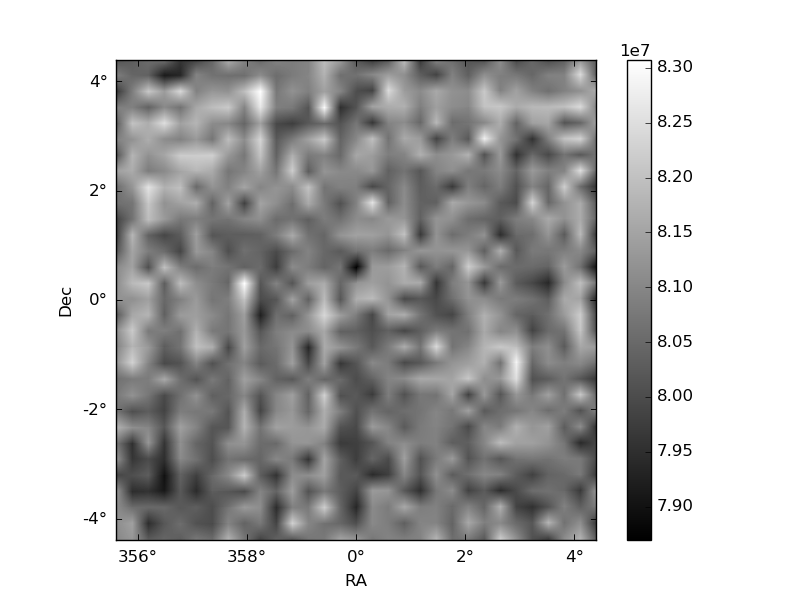
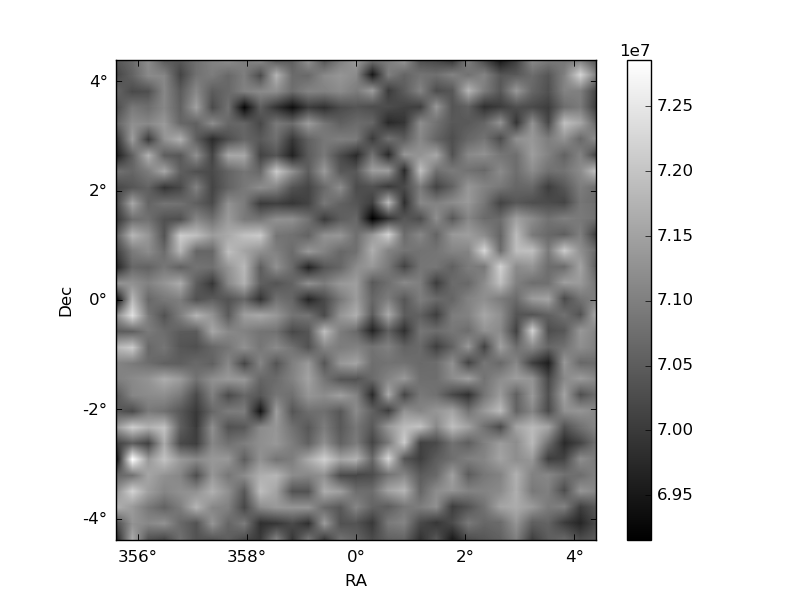
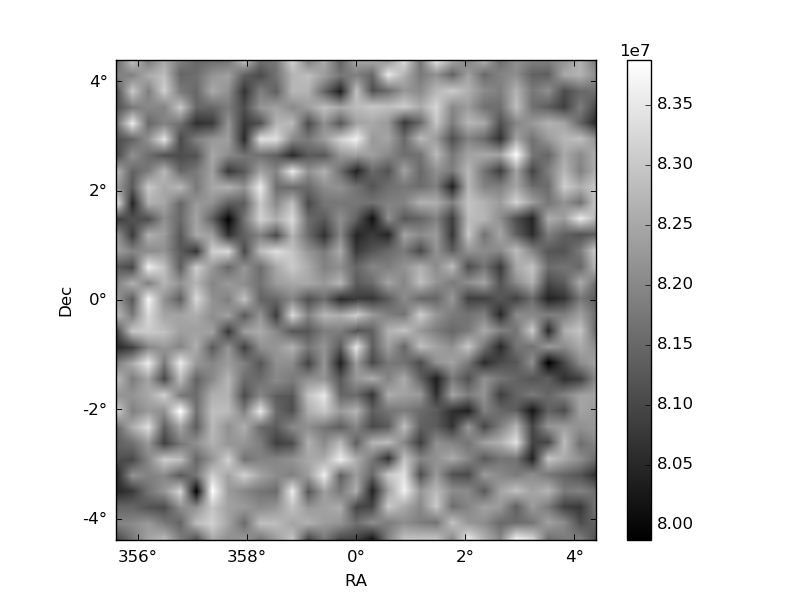
Histogram calculated using DETX and DETY for each event in the final _common_clean file
| Quadrant A | 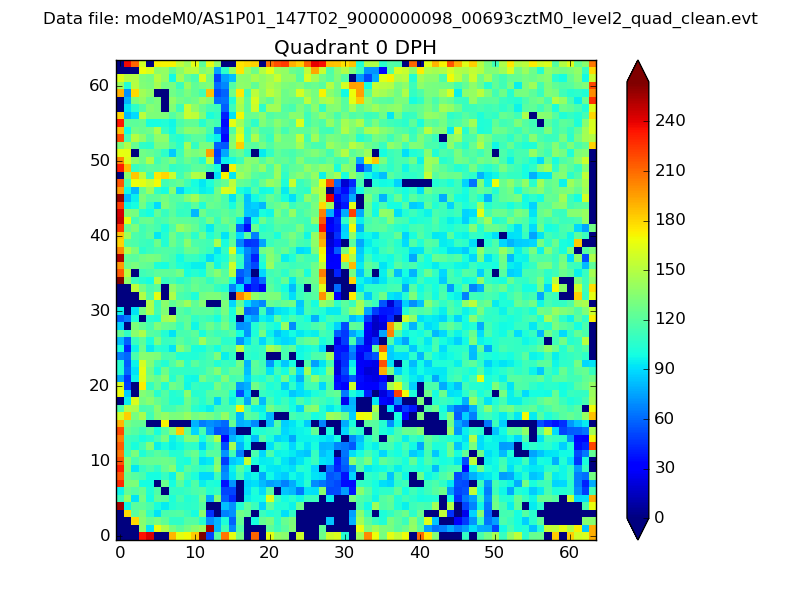 |
 |
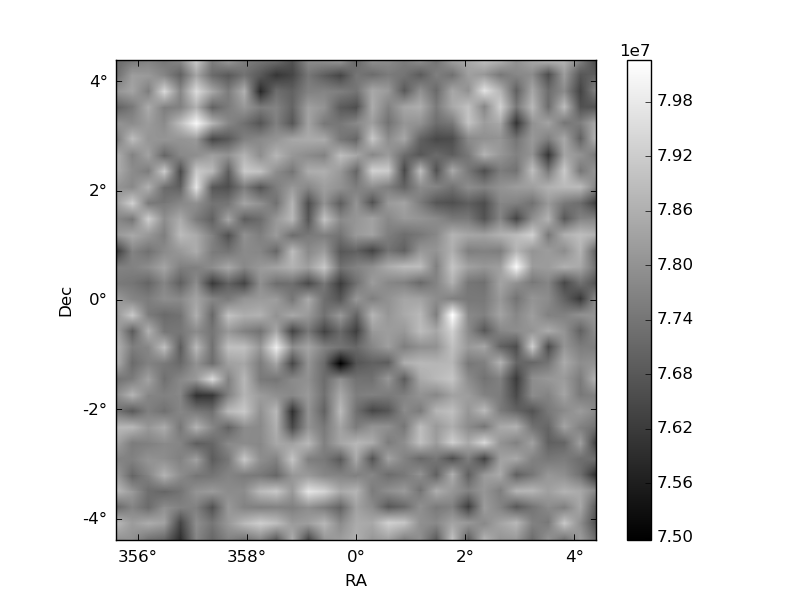
Quadrant B |
|---|---|---|---|
| Quadrant D | 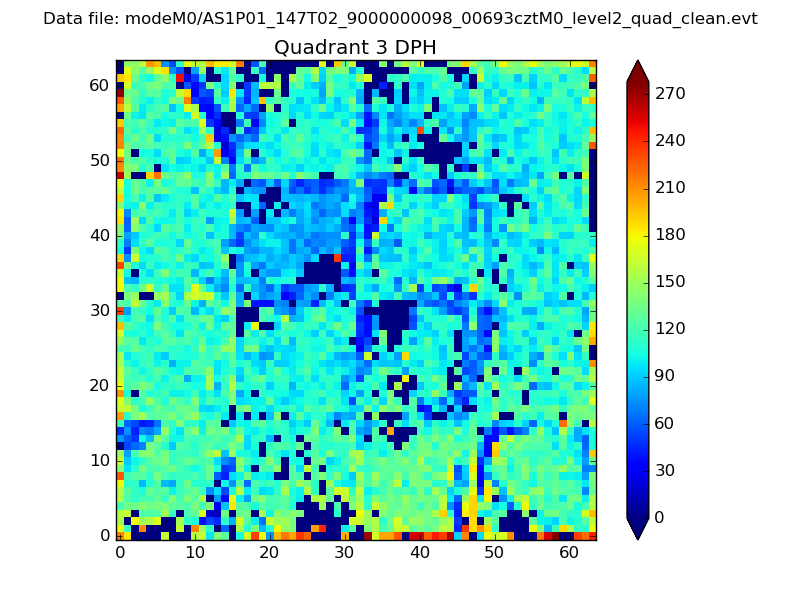 |
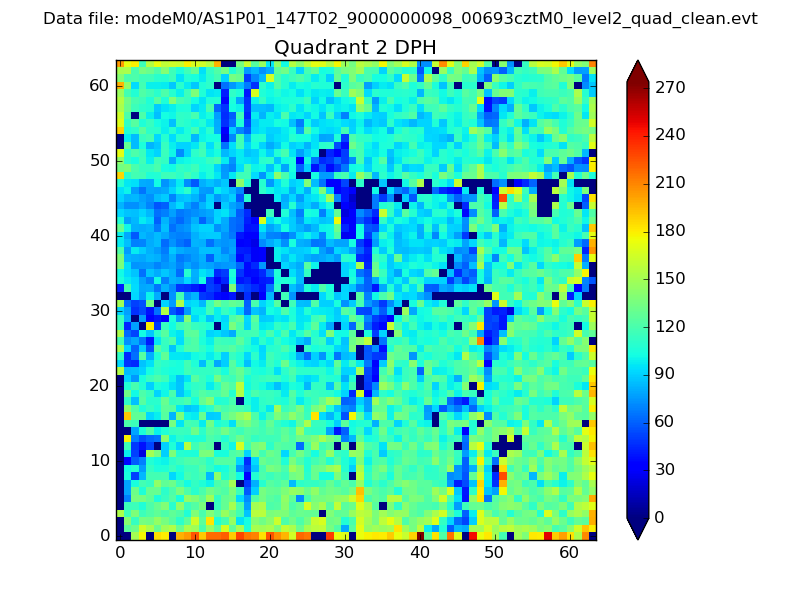 |
Quadrant C |
| Plot type | Count rate plots | Images |
|---|---|---|
| Comparison with Poisson distribution Blue bars denote a histogram of data divided into 1 sec bins. Red curve is a Poisson curve with rate = median count rate of data. |
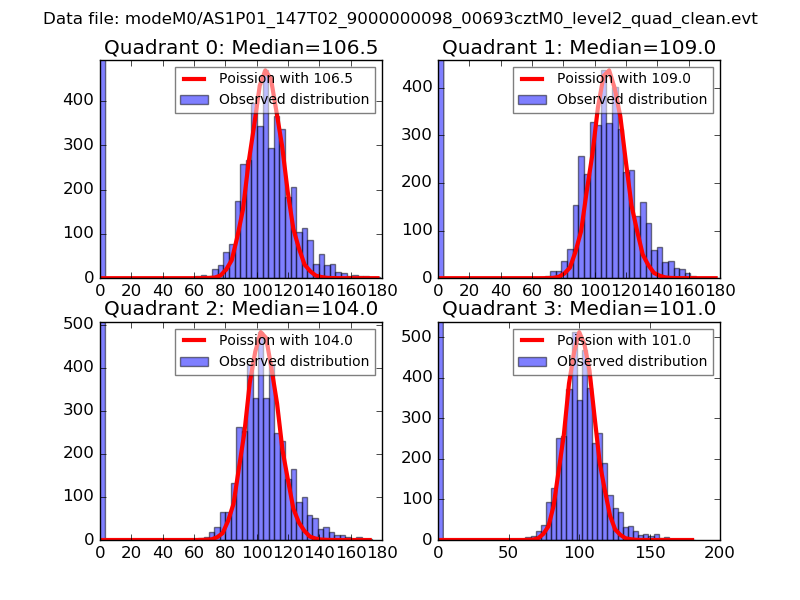 |
 |
| Quadrant-wise count rates Data is divided into 100 sec bins |
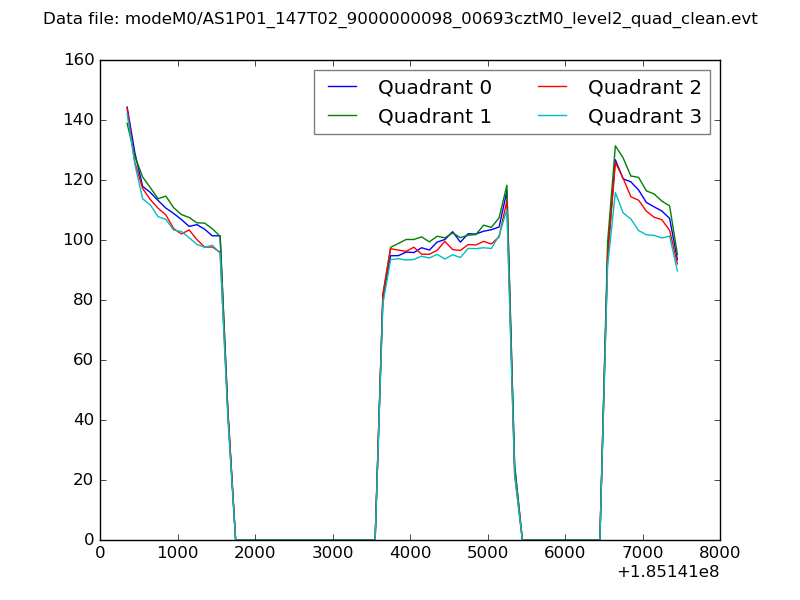 |
|
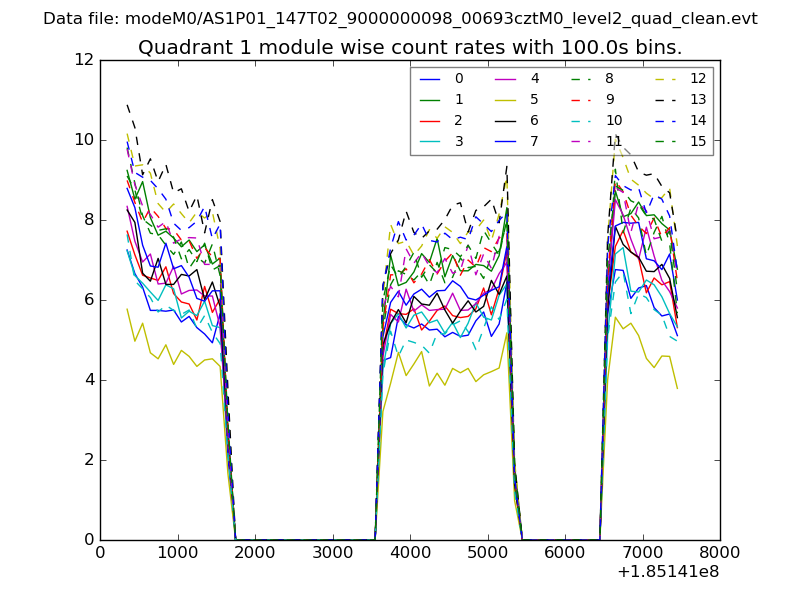
| Module-wise count rates for Quadrant A Data is divided into 100 sec bins |
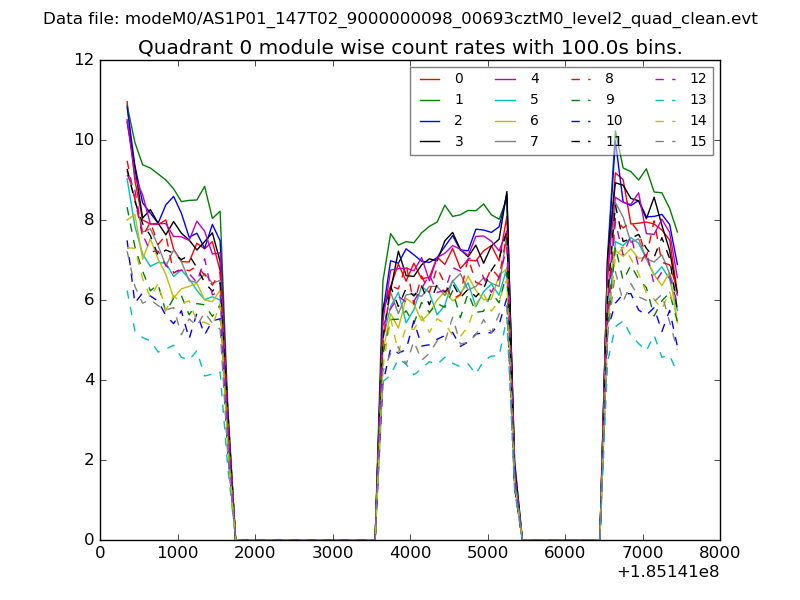 |
 |
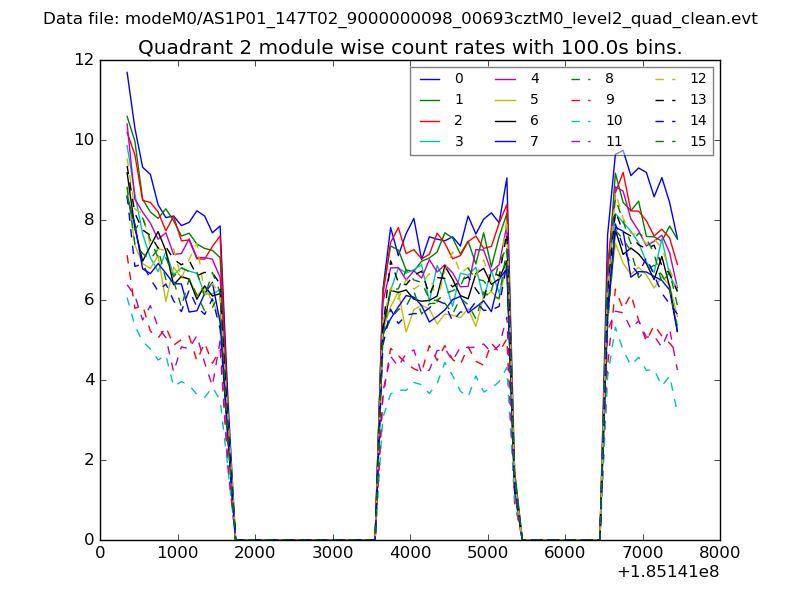
| Module-wise count rates for Quadrant B Data is divided into 100 sec bins |
 |
 |
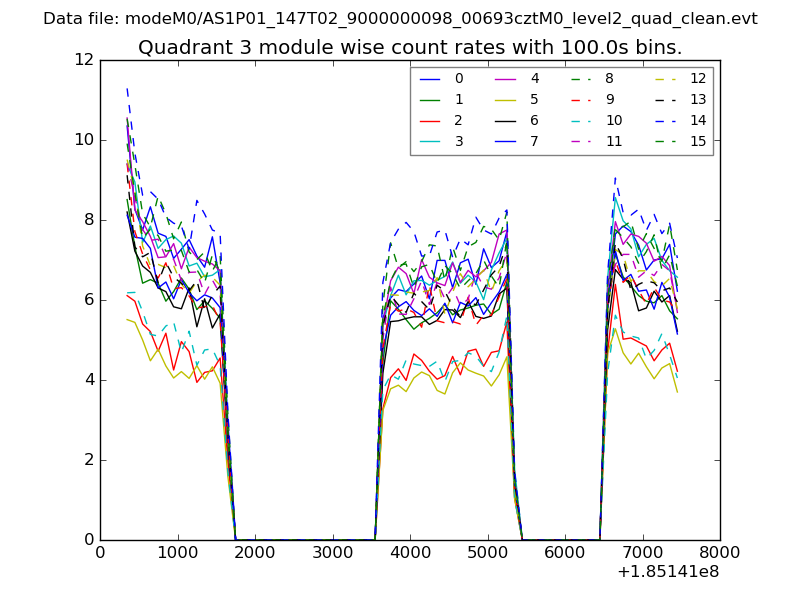
| Module-wise count rates for Quadrant C Data is divided into 100 sec bins |
 |
 |
| Module-wise count rates for Quadrant D Data is divided into 100 sec bins |
 |
 |
| Parameter | Plot |
|---|---|
| CZT HV Monitor | 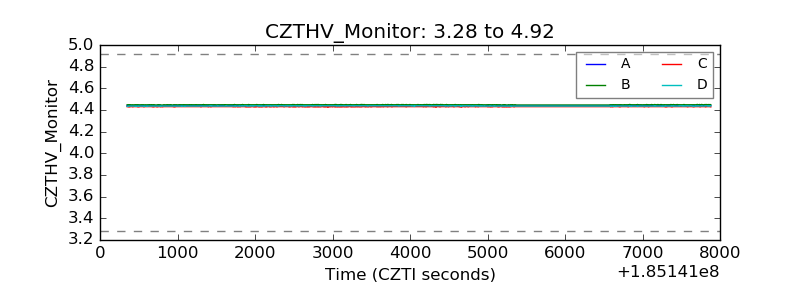 |
| D_VDD | 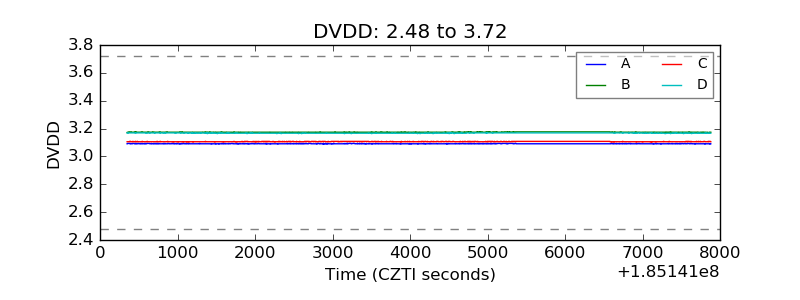 |
| Temperature 1 | 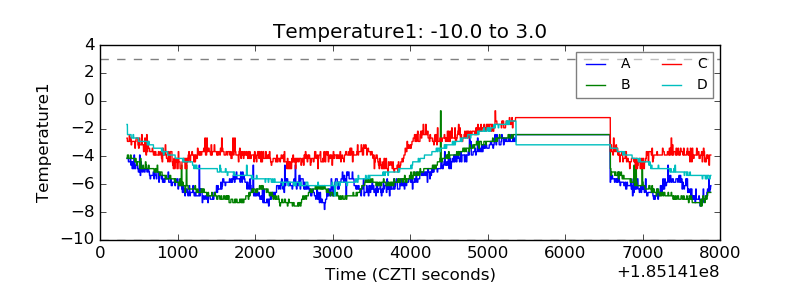 |
| Veto HV Monitor | 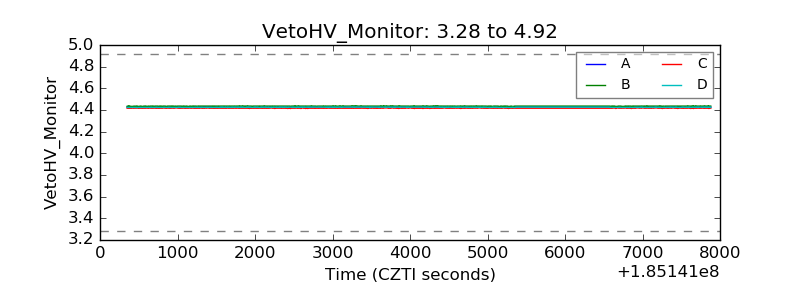 |
| Veto LLD | 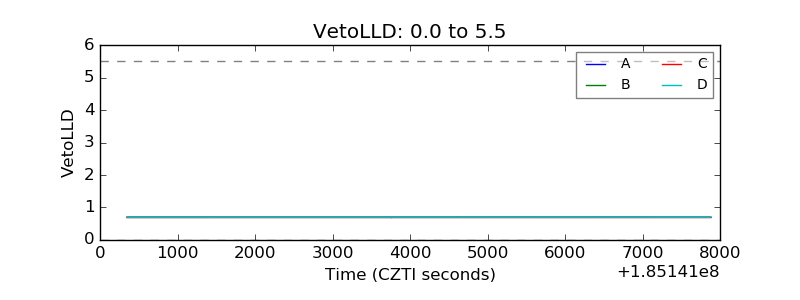 |
| Alpha Counter | 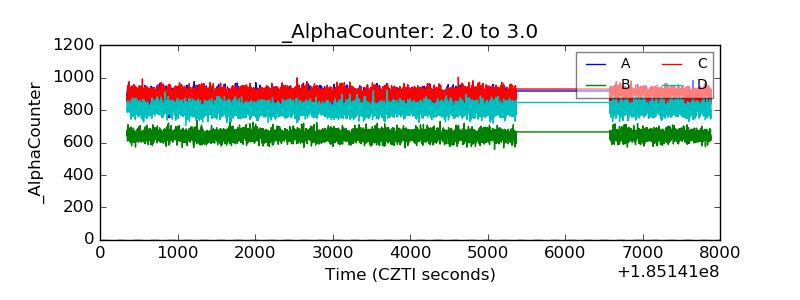 |
| _CPM_Rate | 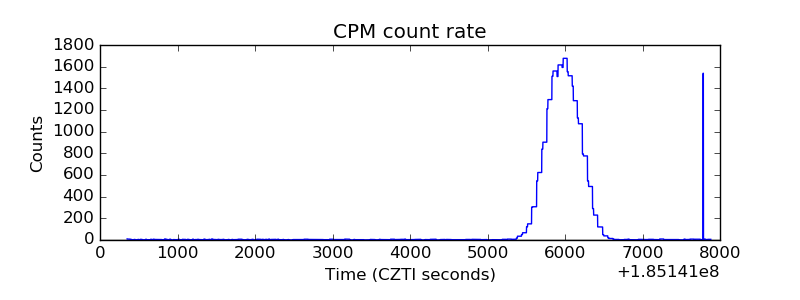 |
| CZT Counter | 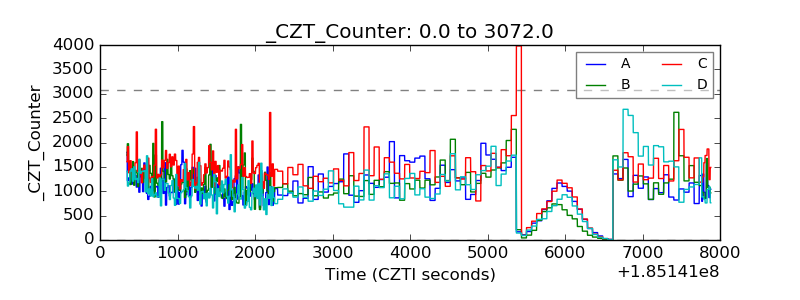 |
| +2.5 Volts monitor | 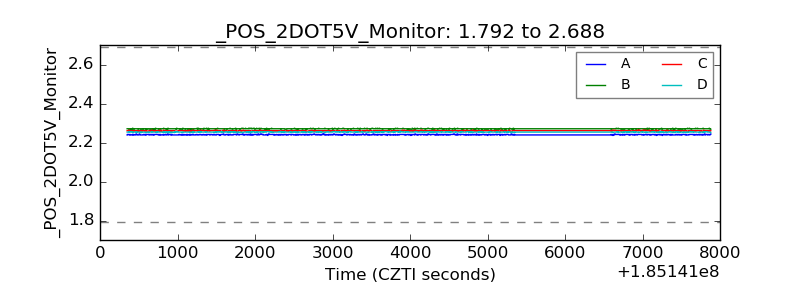 |
| +5 Volts monitor |  |
| _ROLL_ROT | 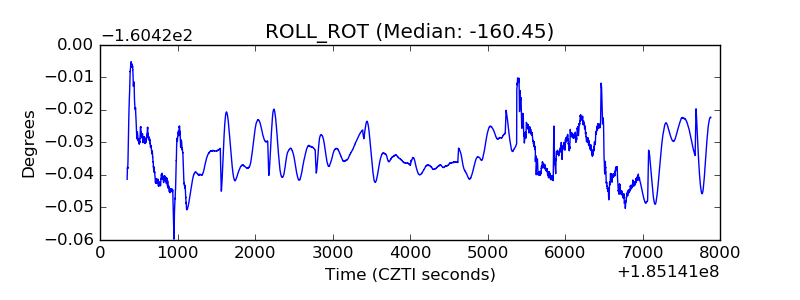 |
| _Roll_DEC | 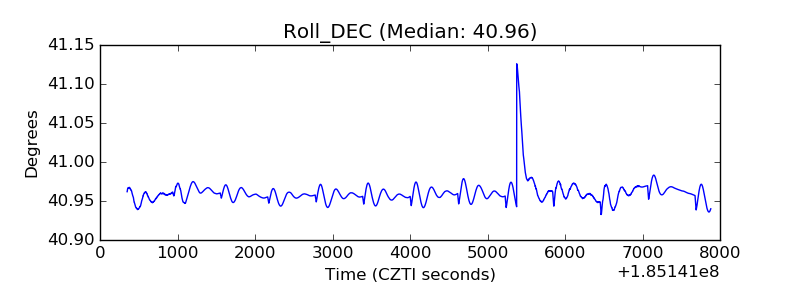 |
| _Roll_RA | 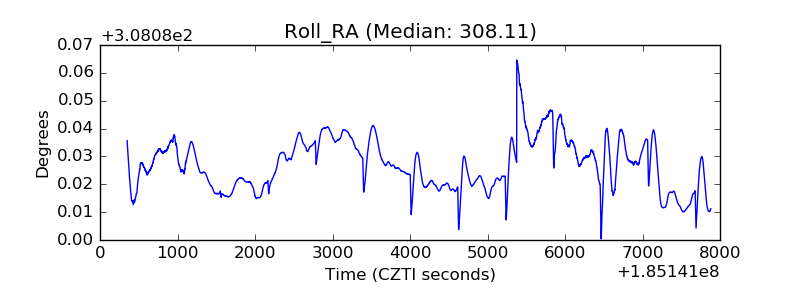 |
| Veto Counter | 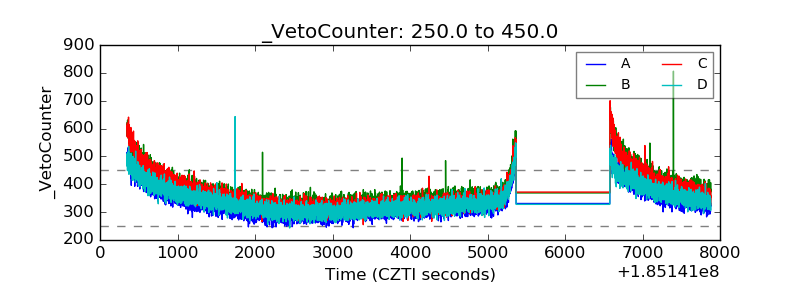 |