| Param | Original file | Final file |
|---|---|---|
| Filename | modeM0/AS1P01_147T02_9000000098_00694cztM0_level2.evt | modeM0/AS1P01_147T02_9000000098_00694cztM0_level2_quad_clean.evt |
| Size (bytes) | 1,079,320,320 | 62,268,480 |
| Size | 1.0 GB | 59.4 MB |
| Events in quadrant A | 7,421,376 | 362,677 |
| Events in quadrant B | 7,787,089 | 372,702 |
| Events in quadrant C | 9,514,664 | 354,616 |
| Events in quadrant D | 7,536,431 | 344,459 |
| Mode M9 | |||
|---|---|---|---|
| Quadrant | BADHDUFLAG | Total packets | Discarded packets |
| A | 0 | 13 | 0 |
| B | 0 | 13 | 0 |
| C | 0 | 13 | 0 |
| D | 0 | 13 | 0 |
| Mode SS | |||
|---|---|---|---|
| Quadrant | BADHDUFLAG | Total packets | Discarded packets |
| A | 0 | 132 | 0 |
| B | 0 | 132 | 0 |
| C | 0 | 132 | 0 |
| D | 0 | 132 | 0 |
| Mode M0 | |||
|---|---|---|---|
| Quadrant | BADHDUFLAG | Total packets | Discarded packets |
| A | 0 | 26611 | 1 |
| B | 0 | 27714 | 1 |
| C | 0 | 32768 | 1 |
| D | 0 | 26989 | 8 |
| Quadrant | Total seconds | Saturated seconds | Saturation percentage |
|---|---|---|---|
| A | 6458 | 10 | 0.154847% |
| B | 6458 | 7 | 0.108393% |
| C | 6459 | 10 | 0.154823% |
| D | 6458 | 11 | 0.170331% |
Noise dominated data is calculated using 1-second bins in cleaned event files. If a bin has >2000 counts, and if more than 50% of those come from <1% of pixels, then it is considered to be noise-dominated and hence unusable.
| Quadrant | # 1 sec bins | Bins with >0 counts | Bins with >2000 counts | High rate bins dominated by noise | Noise dominated (total time) | Noise dominated (detector-on time) | Marked lightcurve |
|---|---|---|---|---|---|---|---|
| A | 7743 | 6459 | 141 | 141 | 1.82% | 2.18% |  |
| B | 7743 | 6459 | 134 | 134 | 1.73% | 2.07% |  |
| C | 7744 | 6460 | 346 | 346 | 4.47% | 5.36% | 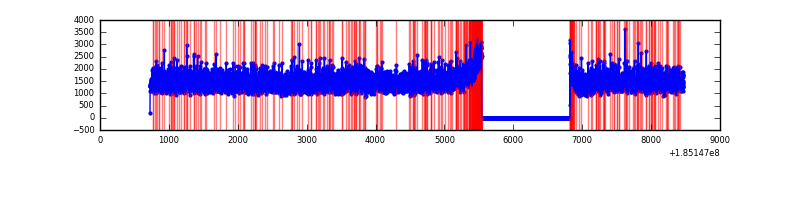 |
| D | 7743 | 6459 | 465 | 465 | 6.01% | 7.20% | 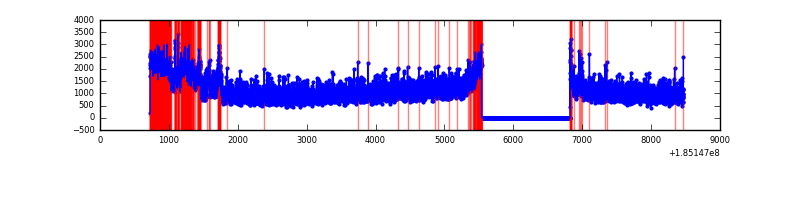 |
Top three noisy pixels from each quadrant. If the there are fewer than three noisy pixels in the level2.evt file, extra rows are filled as -1
| Pixel properties | Quadrant properties | ||||||
|---|---|---|---|---|---|---|---|
| Quadrant | DetID | PixID | Counts | Sigma | Mean | Median | Sigma |
| A | 13 | 17 | 63242 | 133.62 | 1907 | 1925 | 458.9 |
| A | 15 | 171 | 33333 | 68.44 | 1907 | 1925 | 458.9 |
| A | 11 | 79 | 7650 | 12.48 | 1907 | 1925 | 458.9 |
| B | 0 | 220 | 41650 | 84.17 | 2017 | 2028 | 470.8 |
| B | 5 | 191 | 35735 | 71.6 | 2017 | 2028 | 470.8 |
| B | 7 | 221 | 27902 | 54.96 | 2017 | 2028 | 470.8 |
| C | 3 | 127 | 1075674 | 2107.39 | 1838 | 1903 | 509.5 |
| C | 3 | 31 | 264583 | 515.54 | 1838 | 1903 | 509.5 |
| C | 3 | 15 | 247405 | 481.82 | 1838 | 1903 | 509.5 |
| D | 13 | 72 | 787187 | 1460.43 | 1750 | 1815 | 537.8 |
| D | 0 | 25 | 116466 | 213.2 | 1750 | 1815 | 537.8 |
| D | 1 | 4 | 49566 | 88.79 | 1750 | 1815 | 537.8 |
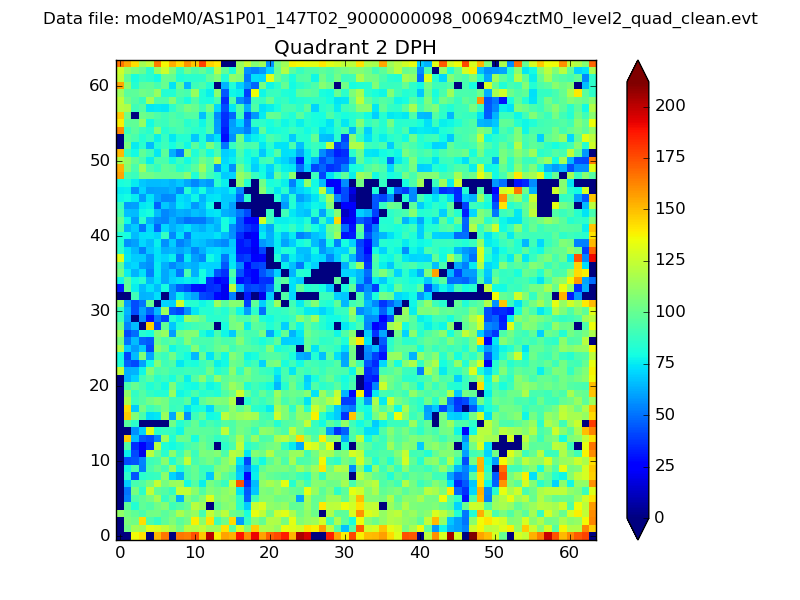
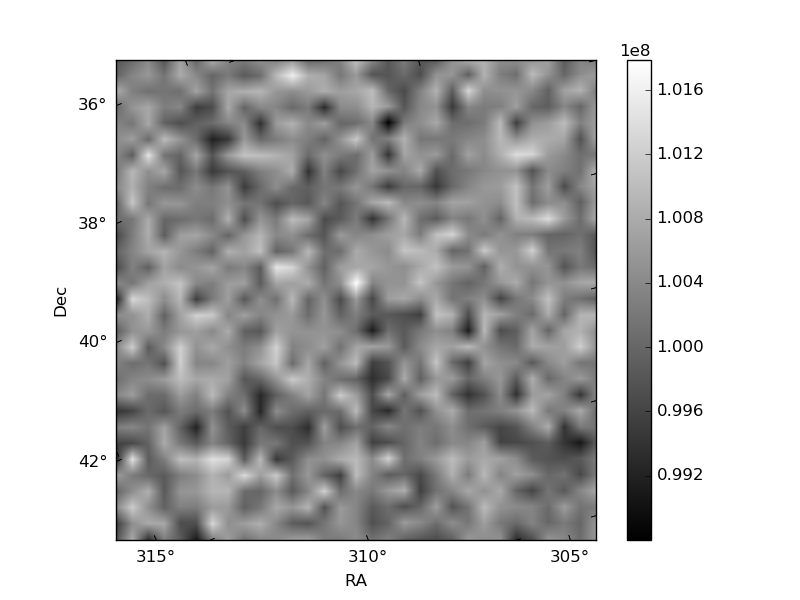
Histogram calculated using DETX and DETY for each event in the final _common_clean file
| Quadrant A | 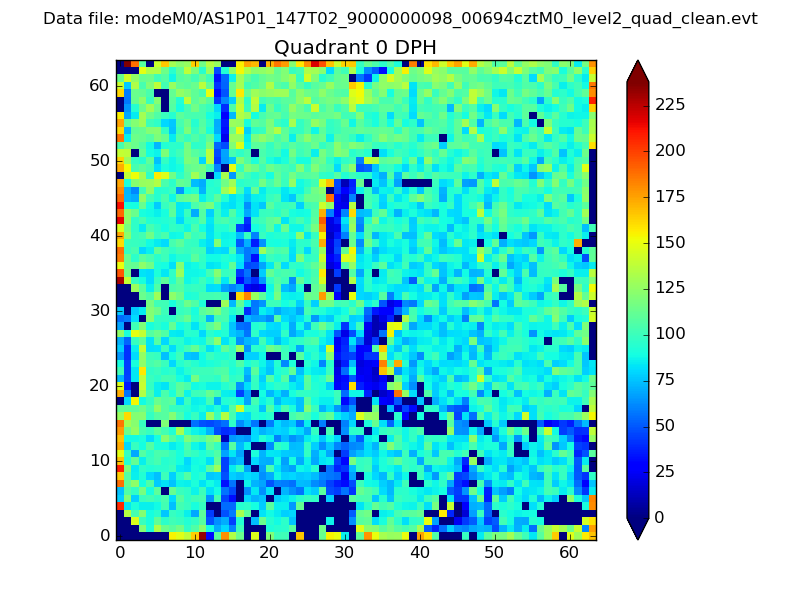 |
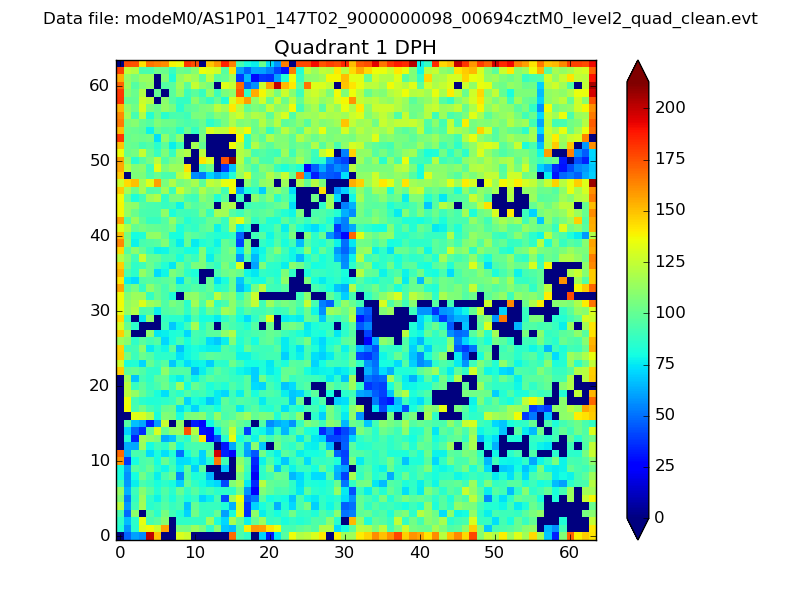 |
Quadrant B |
|---|---|---|---|
| Quadrant D | 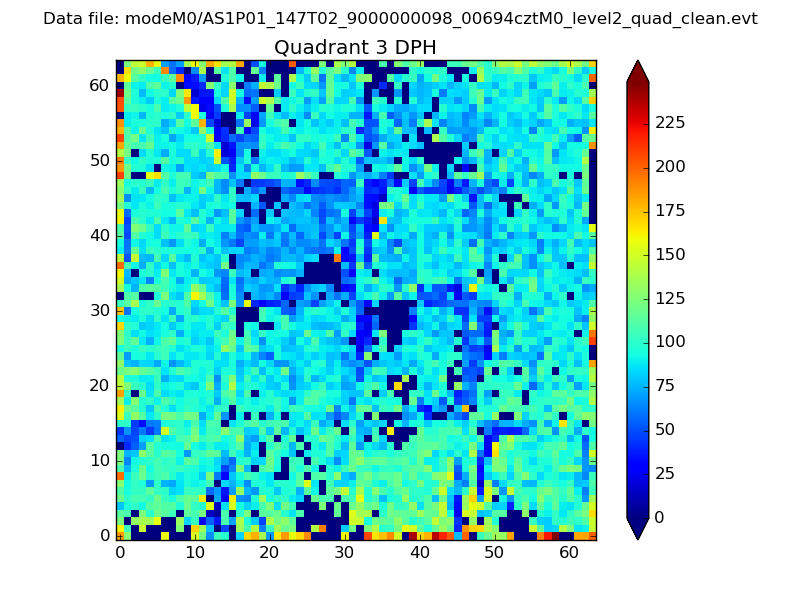 |
 |
Quadrant C |
| Plot type | Count rate plots | Images |
|---|---|---|
| Comparison with Poisson distribution Blue bars denote a histogram of data divided into 1 sec bins. Red curve is a Poisson curve with rate = median count rate of data. |
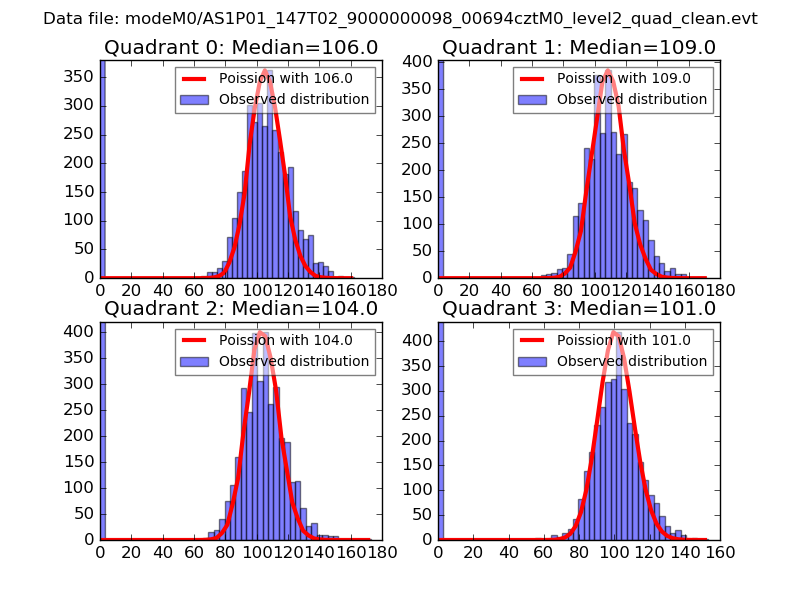 |
 |
| Quadrant-wise count rates Data is divided into 100 sec bins |
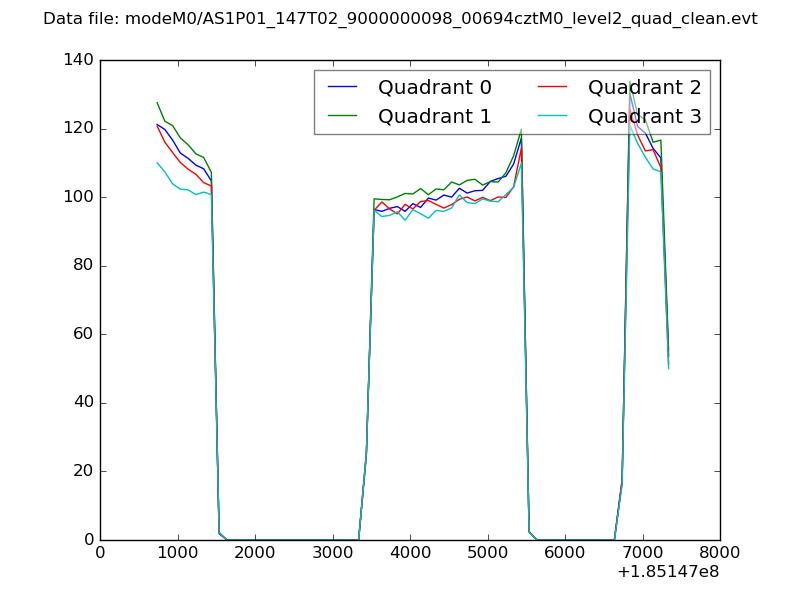 |
|
| Module-wise count rates for Quadrant A Data is divided into 100 sec bins |
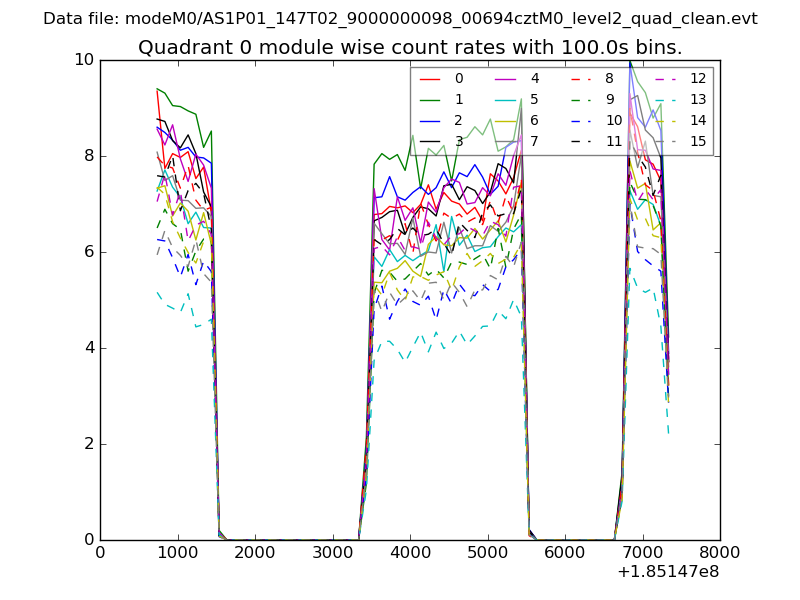 |
 |
| Module-wise count rates for Quadrant B Data is divided into 100 sec bins |
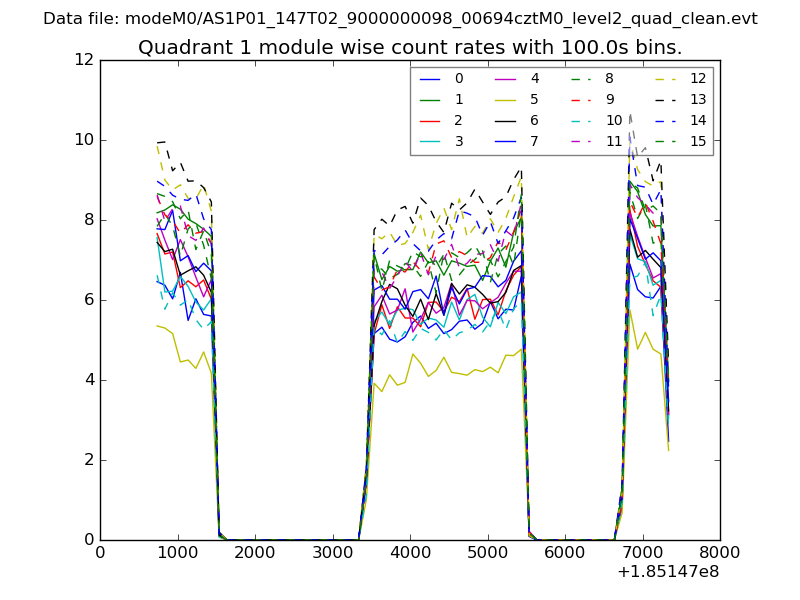 |
 |
| Module-wise count rates for Quadrant C Data is divided into 100 sec bins |
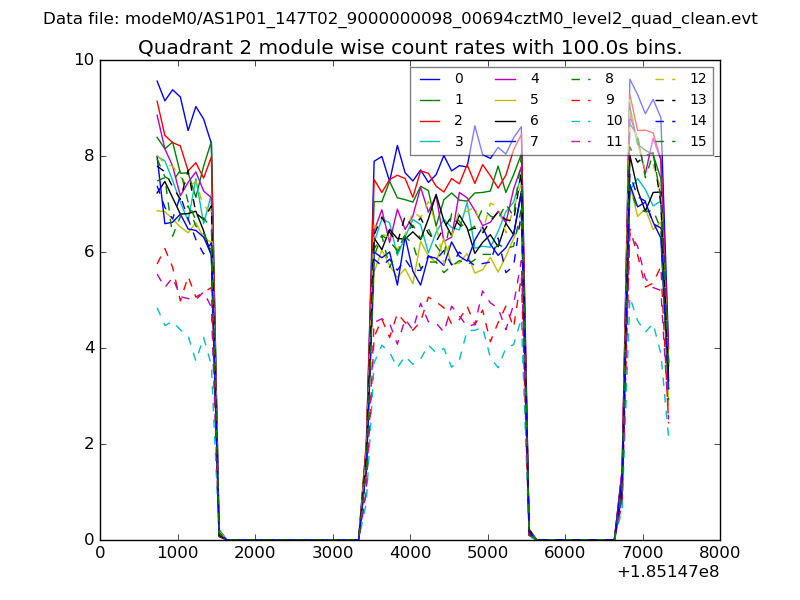 |
 |
| Module-wise count rates for Quadrant D Data is divided into 100 sec bins |
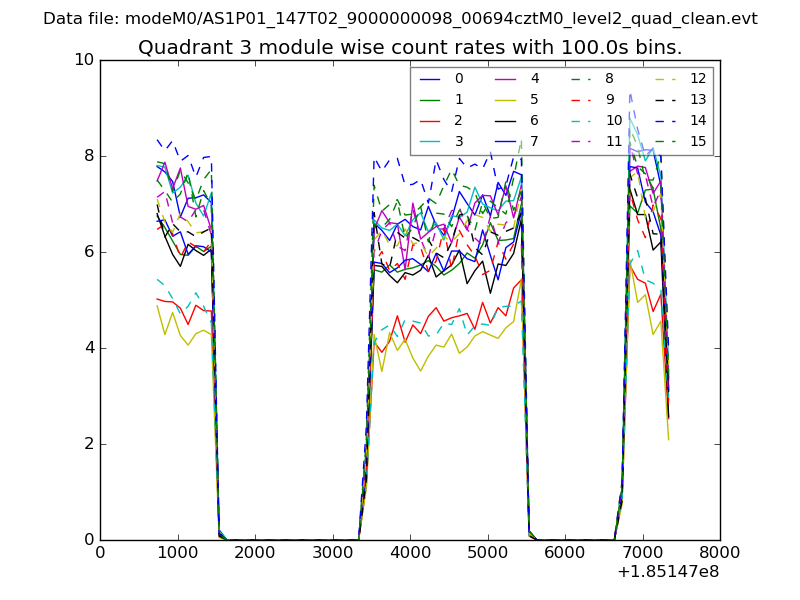 |
 |
| Parameter | Plot |
|---|---|
| CZT HV Monitor | 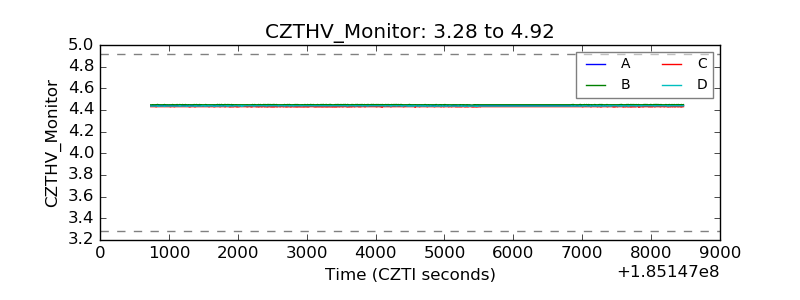 |
| D_VDD | 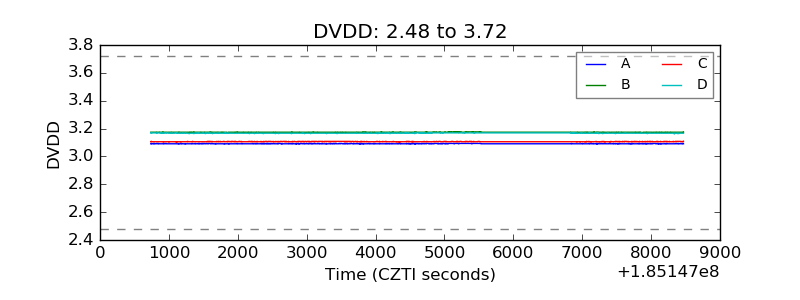 |
| Temperature 1 | 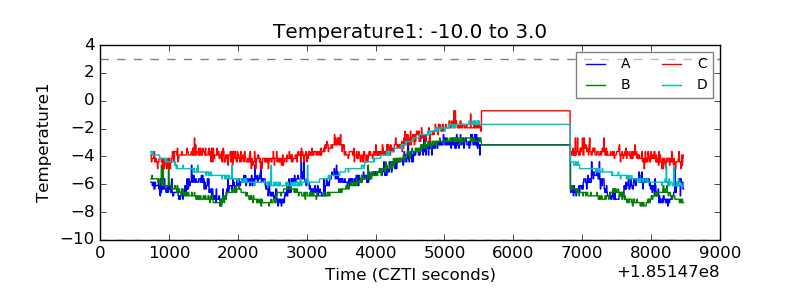 |
| Veto HV Monitor | 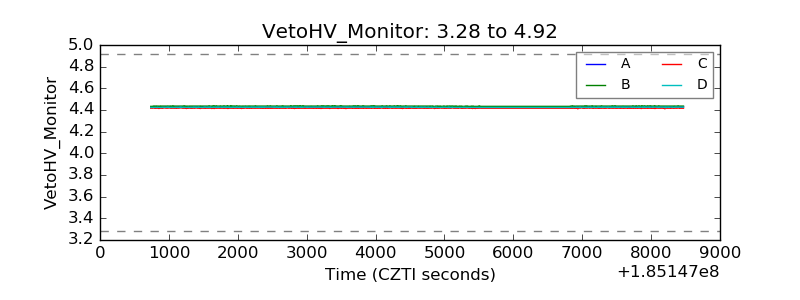 |
| Veto LLD | 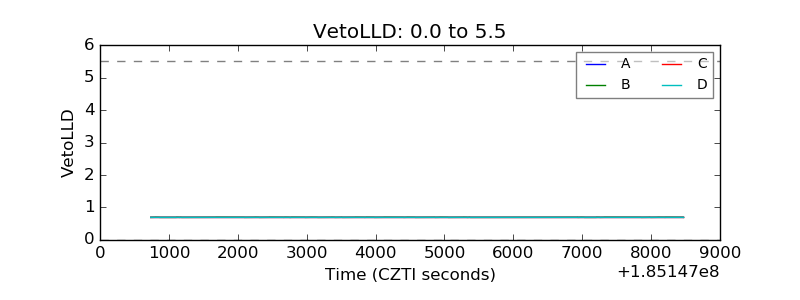 |
| Alpha Counter | 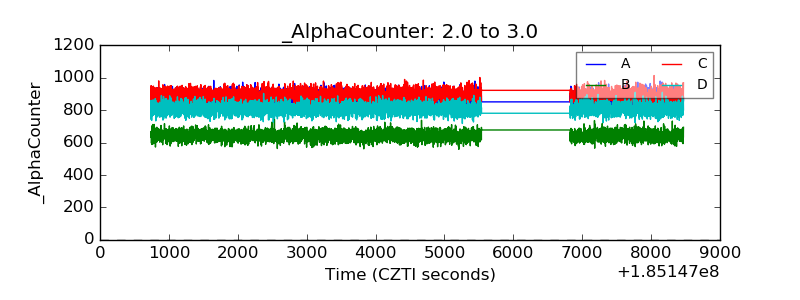 |
| _CPM_Rate | 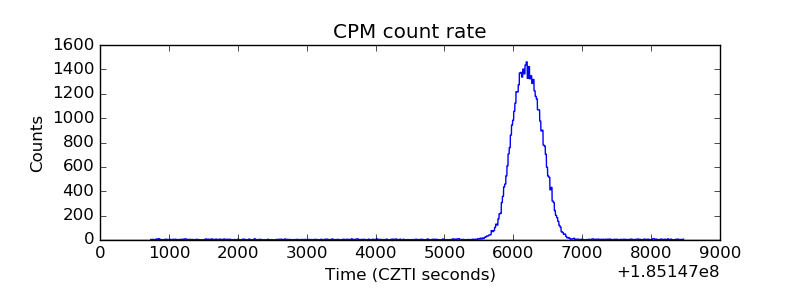 |
| CZT Counter | 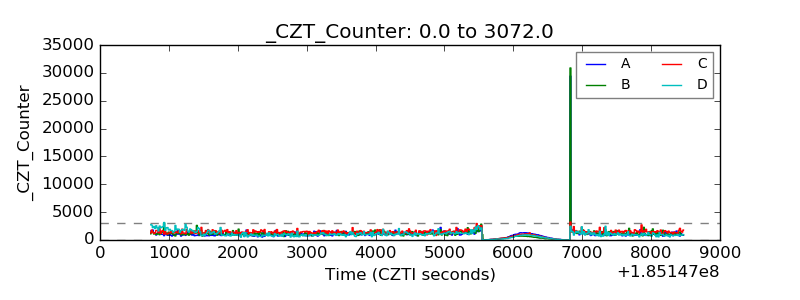 |
| +2.5 Volts monitor |  |
| +5 Volts monitor | 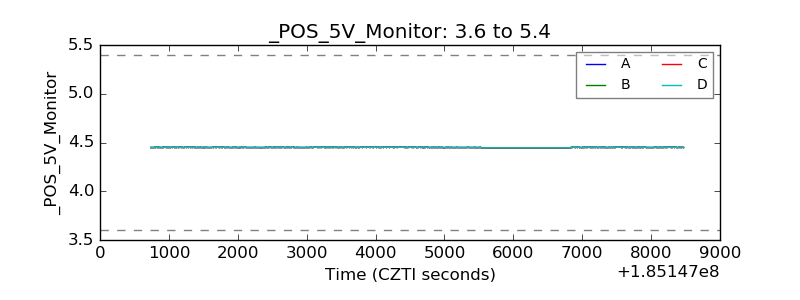 |
| _ROLL_ROT | 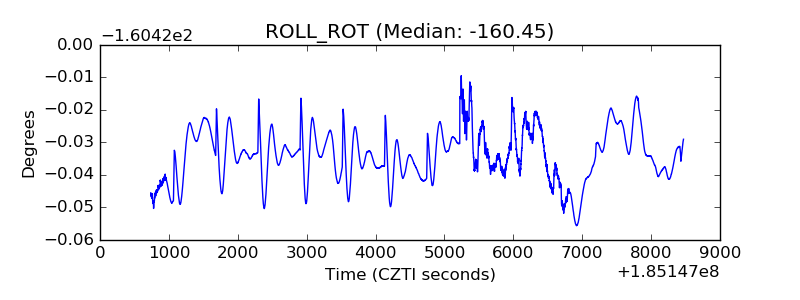 |
| _Roll_DEC | 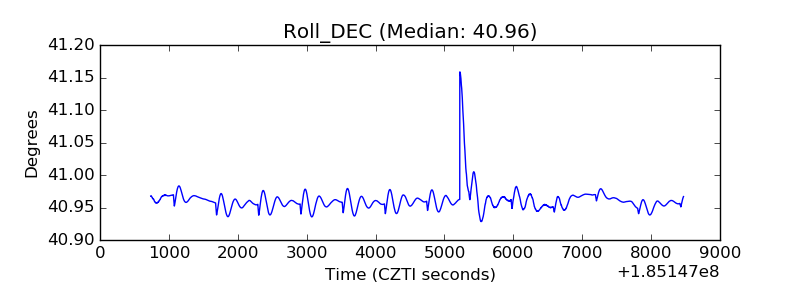 |
| _Roll_RA | 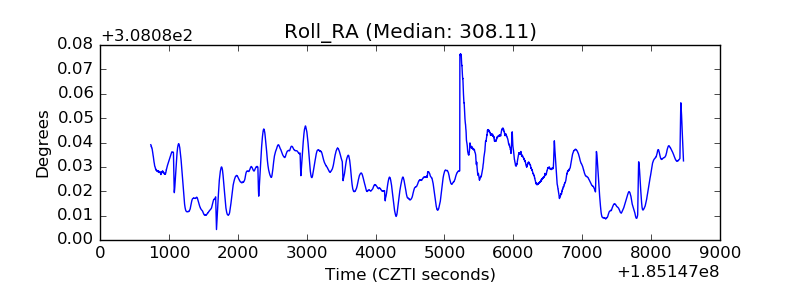 |
| Veto Counter | 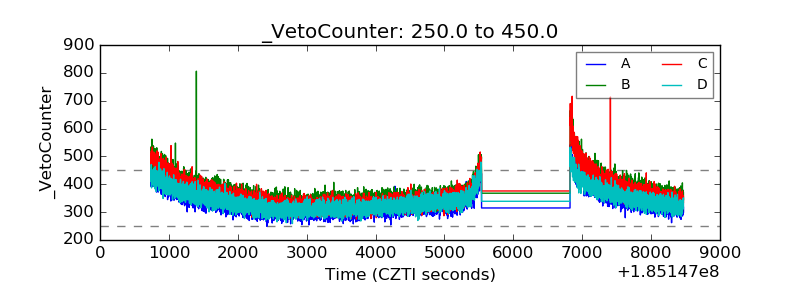 |