| Param | Original file | Final file |
|---|---|---|
| Filename | modeM0/AS1P01_147T02_9000000098_00695cztM0_level2.evt | modeM0/AS1P01_147T02_9000000098_00695cztM0_level2_quad_clean.evt |
| Size (bytes) | 1,074,890,880 | 57,144,960 |
| Size | 1.0 GB | 54.5 MB |
| Events in quadrant A | 7,465,847 | 323,828 |
| Events in quadrant B | 8,052,651 | 331,784 |
| Events in quadrant C | 9,577,259 | 314,829 |
| Events in quadrant D | 7,030,134 | 309,286 |
| Mode M9 | |||
|---|---|---|---|
| Quadrant | BADHDUFLAG | Total packets | Discarded packets |
| A | 0 | 13 | 0 |
| B | 0 | 13 | 0 |
| C | 0 | 13 | 0 |
| D | 0 | 13 | 0 |
| Mode SS | |||
|---|---|---|---|
| Quadrant | BADHDUFLAG | Total packets | Discarded packets |
| A | 0 | 130 | 0 |
| B | 0 | 130 | 0 |
| C | 0 | 130 | 0 |
| D | 0 | 130 | 0 |
| Mode M0 | |||
|---|---|---|---|
| Quadrant | BADHDUFLAG | Total packets | Discarded packets |
| A | 0 | 26757 | 5 |
| B | 0 | 28512 | 1 |
| C | 0 | 33002 | 1 |
| D | 0 | 25512 | 1 |
| Quadrant | Total seconds | Saturated seconds | Saturation percentage |
|---|---|---|---|
| A | 6458 | 10 | 0.154847% |
| B | 6458 | 10 | 0.154847% |
| C | 6458 | 14 | 0.216785% |
| D | 6458 | 39 | 0.603902% |
Noise dominated data is calculated using 1-second bins in cleaned event files. If a bin has >2000 counts, and if more than 50% of those come from <1% of pixels, then it is considered to be noise-dominated and hence unusable.
| Quadrant | # 1 sec bins | Bins with >0 counts | Bins with >2000 counts | High rate bins dominated by noise | Noise dominated (total time) | Noise dominated (detector-on time) | Marked lightcurve |
|---|---|---|---|---|---|---|---|
| A | 7713 | 6459 | 126 | 126 | 1.63% | 1.95% | 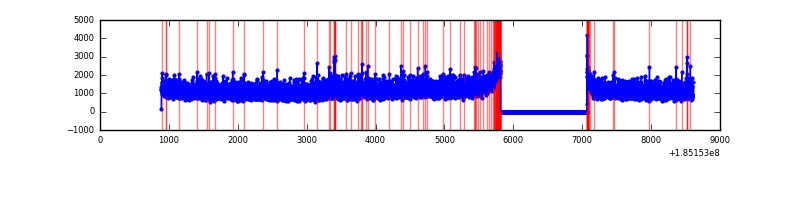 |
| B | 7713 | 6459 | 218 | 218 | 2.83% | 3.38% |  |
| C | 7713 | 6459 | 400 | 400 | 5.19% | 6.19% | 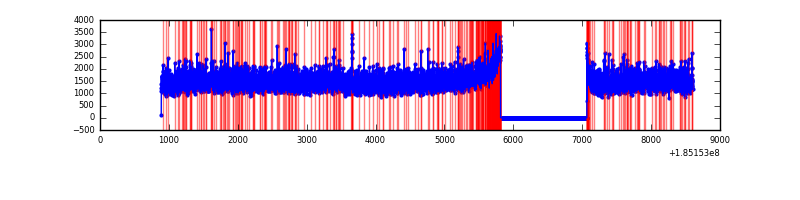 |
| D | 7713 | 6459 | 161 | 161 | 2.09% | 2.49% |  |
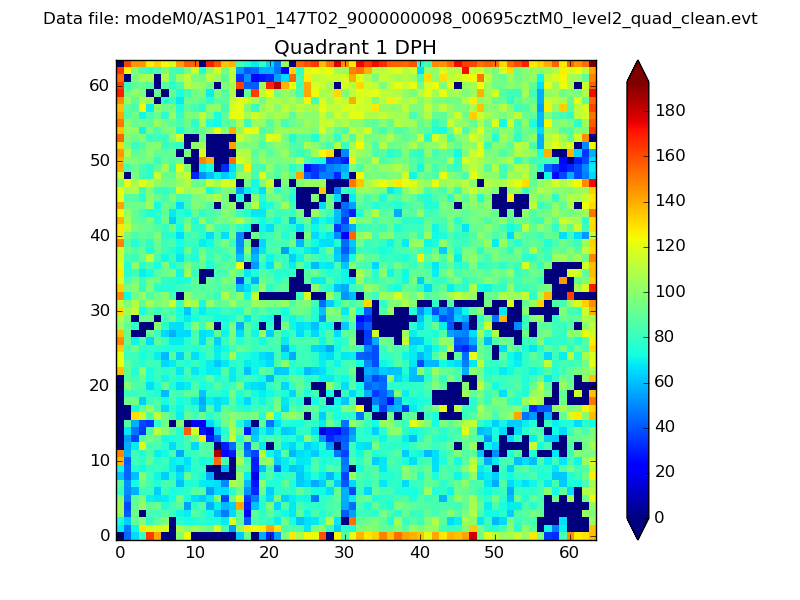
Top three noisy pixels from each quadrant. If the there are fewer than three noisy pixels in the level2.evt file, extra rows are filled as -1
| Pixel properties | Quadrant properties | ||||||
|---|---|---|---|---|---|---|---|
| Quadrant | DetID | PixID | Counts | Sigma | Mean | Median | Sigma |
| A | 15 | 171 | 26685 | 53.24 | 1928 | 1944 | 464.7 |
| A | 15 | 69 | 16086 | 30.43 | 1928 | 1944 | 464.7 |
| A | 13 | 17 | 16028 | 30.3 | 1928 | 1944 | 464.7 |
| B | 7 | 221 | 209645 | 427.64 | 2039 | 2047 | 485.5 |
| B | 0 | 220 | 57166 | 113.54 | 2039 | 2047 | 485.5 |
| B | 5 | 191 | 35985 | 69.91 | 2039 | 2047 | 485.5 |
| C | 3 | 127 | 1056852 | 2054.87 | 1848 | 1916 | 513.4 |
| C | 3 | 31 | 259557 | 501.85 | 1848 | 1916 | 513.4 |
| C | 3 | 15 | 244030 | 471.6 | 1848 | 1916 | 513.4 |
| D | 6 | 226 | 168611 | 307.92 | 1757 | 1816 | 541.7 |
| D | 1 | 4 | 115003 | 208.95 | 1757 | 1816 | 541.7 |
| D | 0 | 25 | 98919 | 179.26 | 1757 | 1816 | 541.7 |
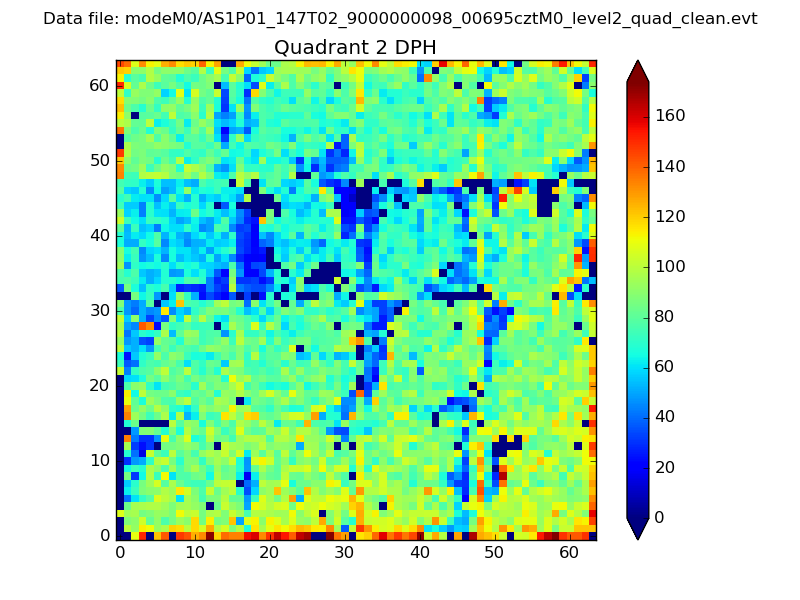
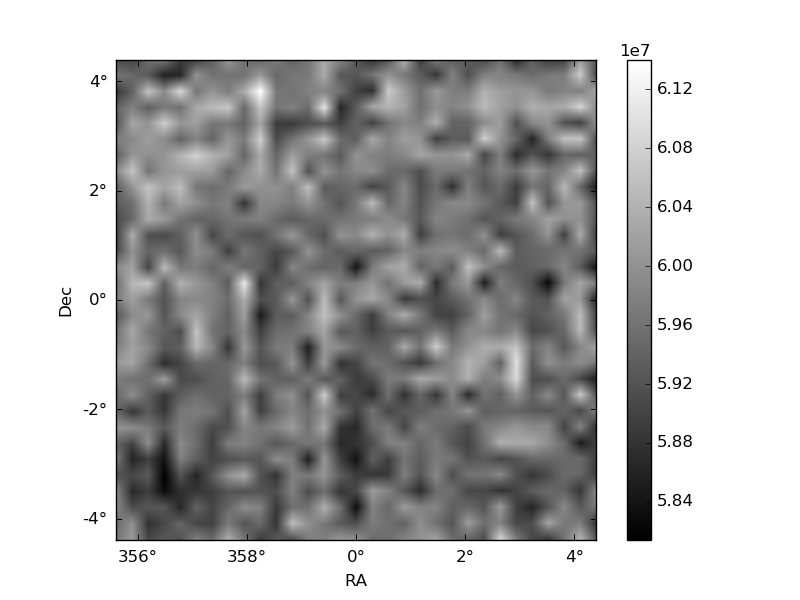
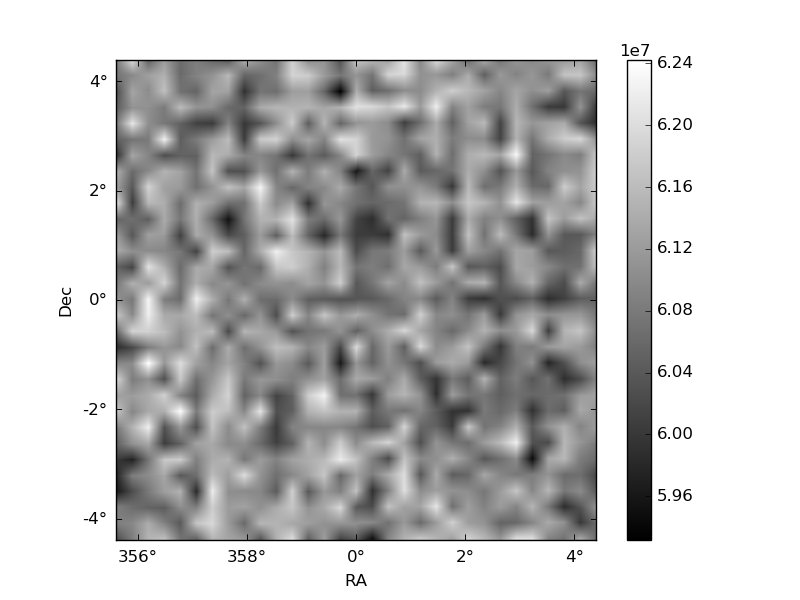
Histogram calculated using DETX and DETY for each event in the final _common_clean file
| Quadrant A | 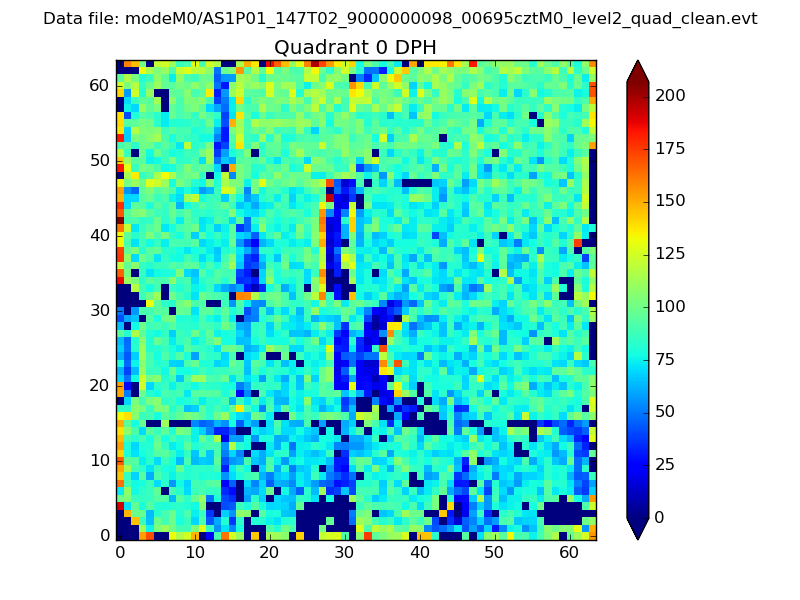 |
 |
Quadrant B |
|---|---|---|---|
| Quadrant D | 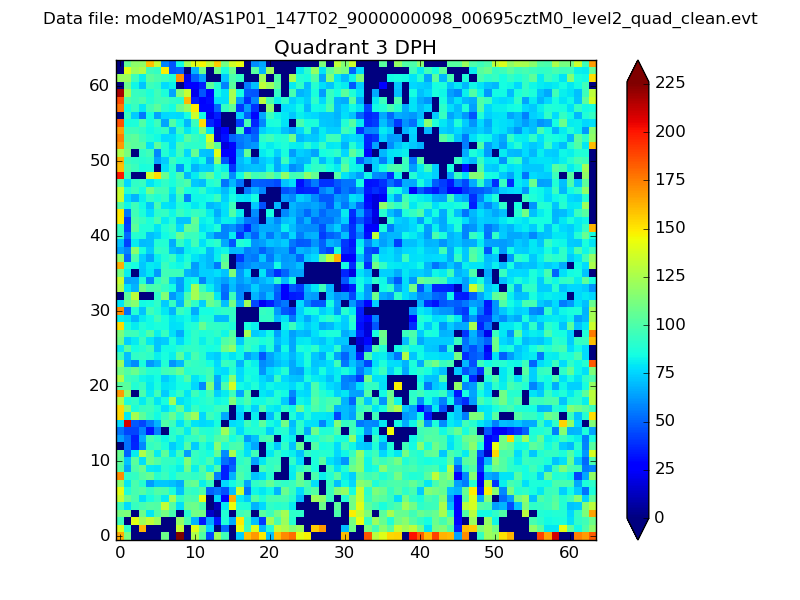 |
 |
Quadrant C |
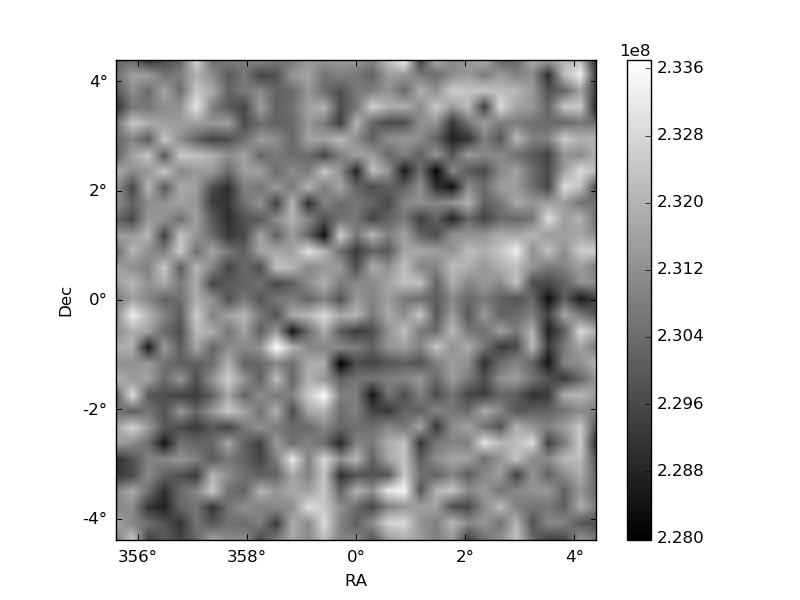
| Plot type | Count rate plots | Images |
|---|---|---|
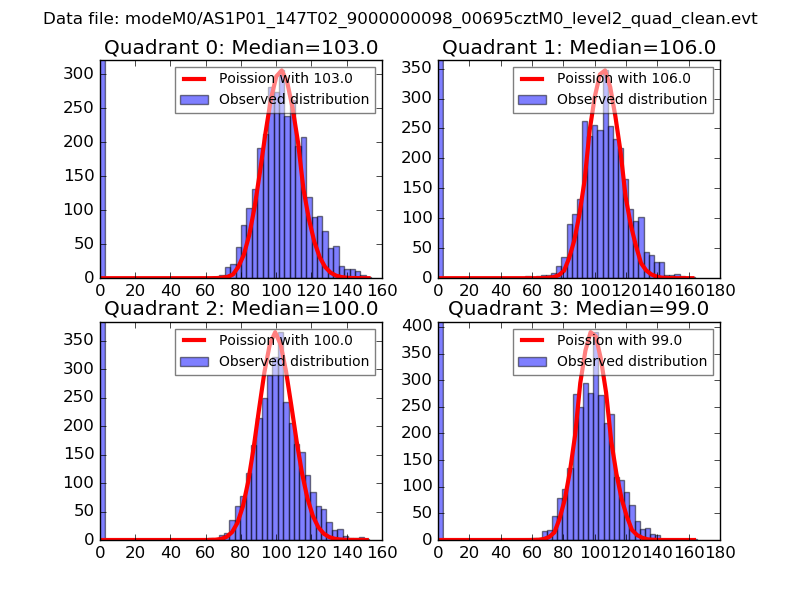
| Comparison with Poisson distribution Blue bars denote a histogram of data divided into 1 sec bins. Red curve is a Poisson curve with rate = median count rate of data. |
 |
 |
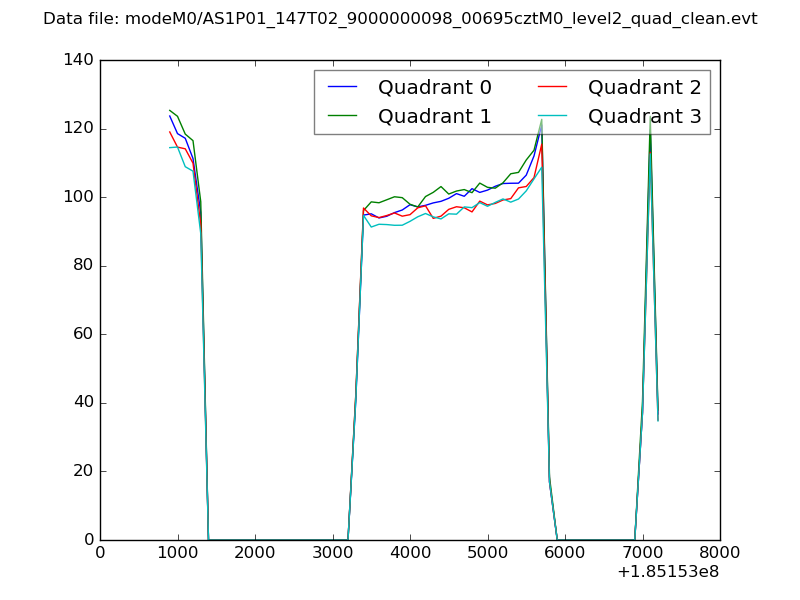
| Quadrant-wise count rates Data is divided into 100 sec bins |
 |
|
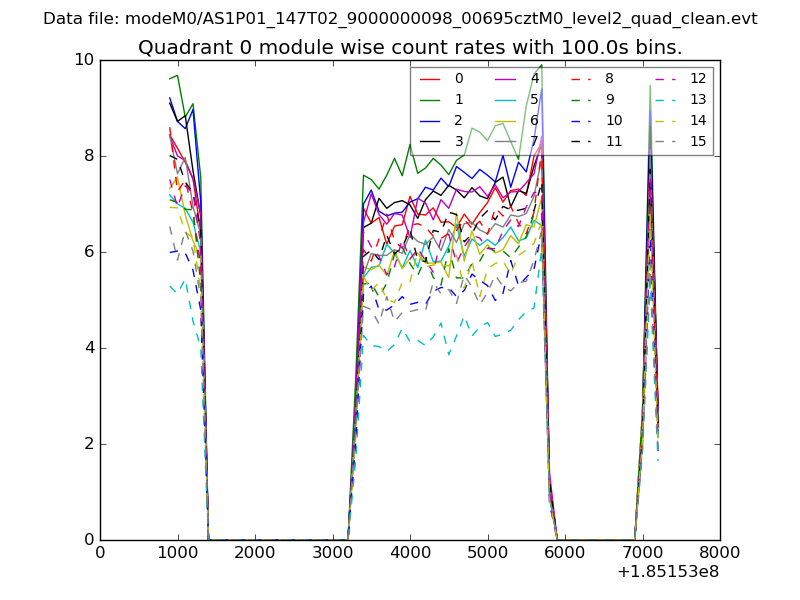
| Module-wise count rates for Quadrant A Data is divided into 100 sec bins |
 |
 |
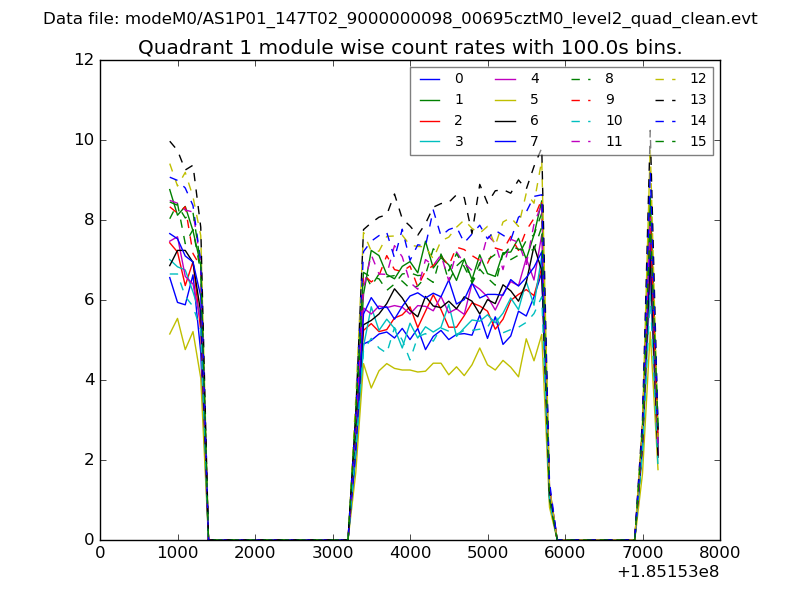
| Module-wise count rates for Quadrant B Data is divided into 100 sec bins |
 |
 |
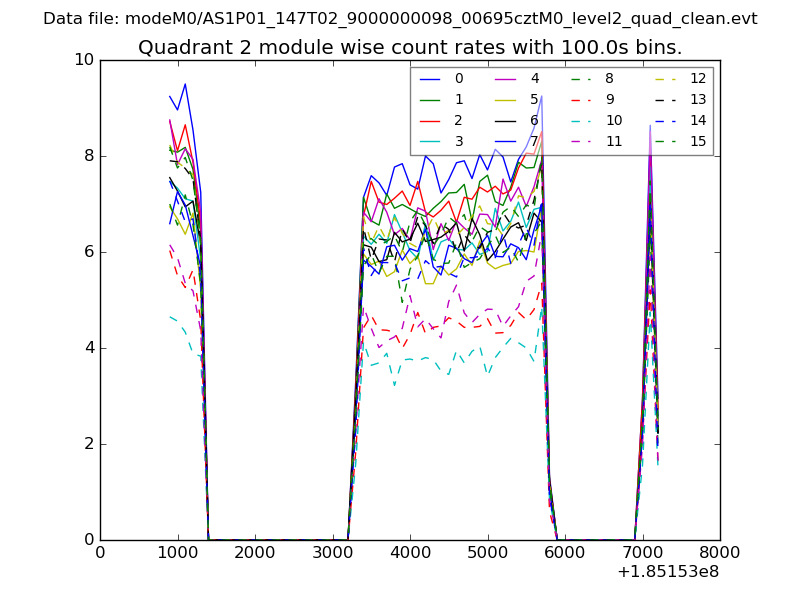
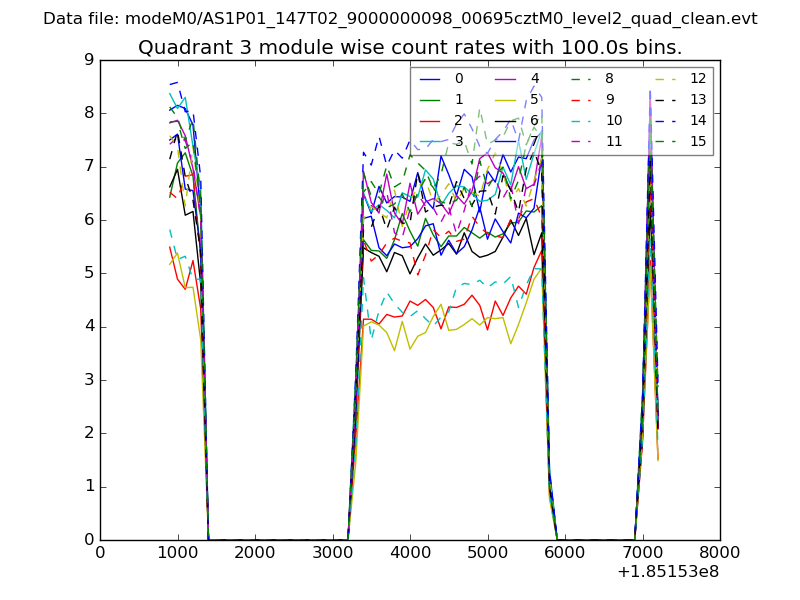
| Module-wise count rates for Quadrant C Data is divided into 100 sec bins |
 |
 |
| Module-wise count rates for Quadrant D Data is divided into 100 sec bins |
 |
 |
| Parameter | Plot |
|---|---|
| CZT HV Monitor | 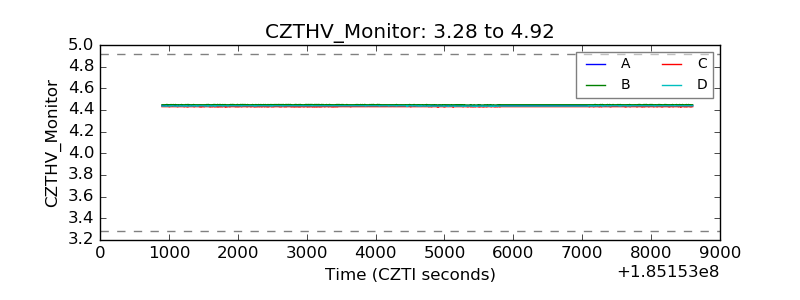 |
| D_VDD | 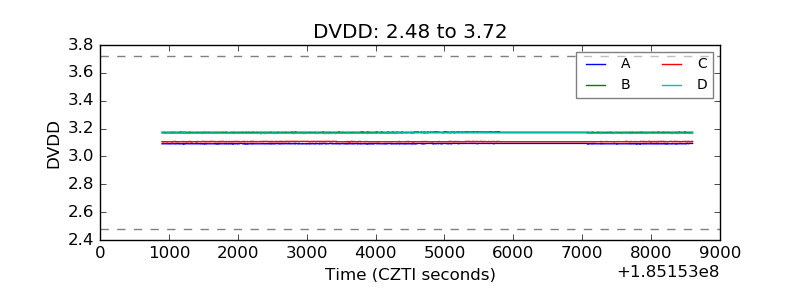 |
| Temperature 1 |  |
| Veto HV Monitor | 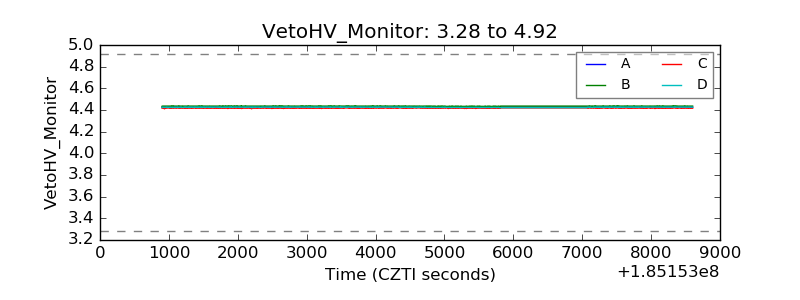 |
| Veto LLD | 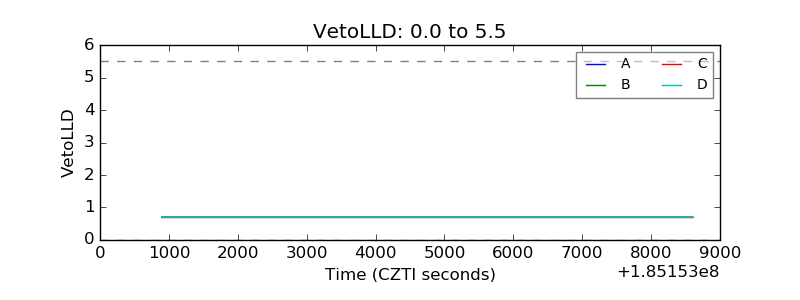 |
| Alpha Counter | 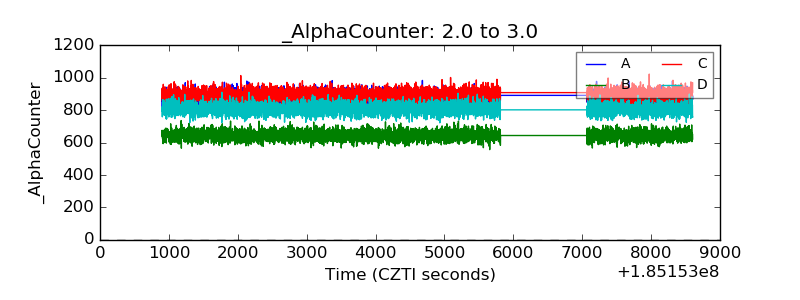 |
| _CPM_Rate | 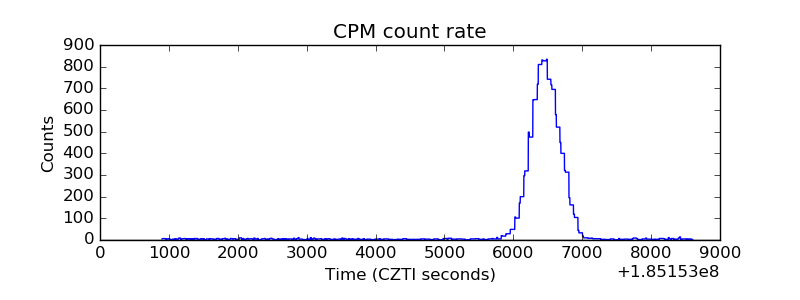 |
| CZT Counter | 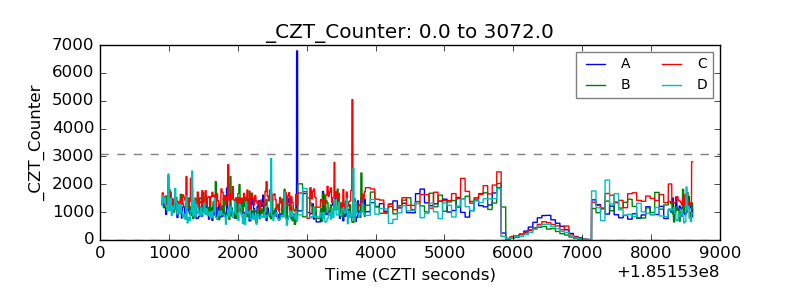 |
| +2.5 Volts monitor |  |
| +5 Volts monitor |  |
| _ROLL_ROT | 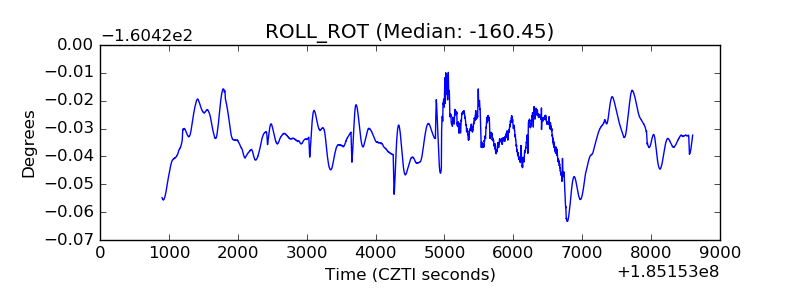 |
| _Roll_DEC | 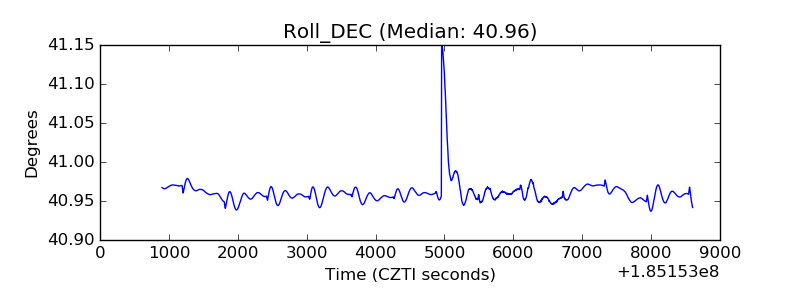 |
| _Roll_RA | 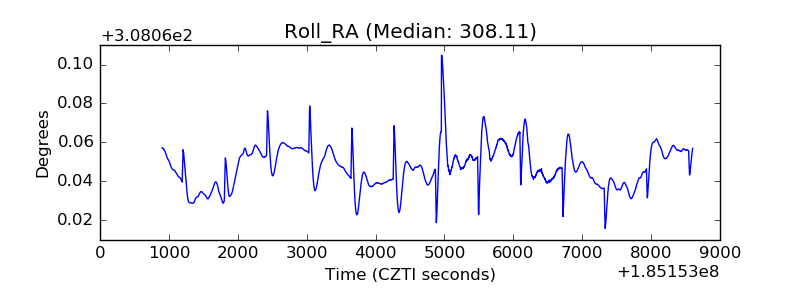 |
| Veto Counter | 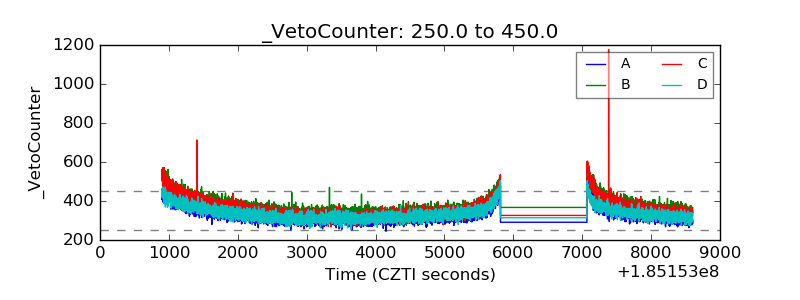 |