| Param | Original file | Final file |
|---|---|---|
| Filename | modeM0/AS1P01_147T02_9000000098_00697cztM0_level2.evt | modeM0/AS1P01_147T02_9000000098_00697cztM0_level2_quad_clean.evt |
| Size (bytes) | 645,212,160 | 37,981,440 |
| Size | 615.3 MB | 36.2 MB |
| Events in quadrant A | 4,440,082 | 219,817 |
| Events in quadrant B | 4,692,925 | 222,926 |
| Events in quadrant C | 5,528,383 | 214,543 |
| Events in quadrant D | 4,614,361 | 212,332 |
| Mode SS | |||
|---|---|---|---|
| Quadrant | BADHDUFLAG | Total packets | Discarded packets |
| A | 0 | 80 | 0 |
| B | 0 | 80 | 0 |
| C | 0 | 80 | 0 |
| D | 0 | 80 | 0 |
| Mode M0 | |||
|---|---|---|---|
| Quadrant | BADHDUFLAG | Total packets | Discarded packets |
| A | 0 | 15998 | 0 |
| B | 0 | 16776 | 0 |
| C | 0 | 19180 | 0 |
| D | 0 | 16598 | 0 |
| Quadrant | Total seconds | Saturated seconds | Saturation percentage |
|---|---|---|---|
| A | 3964 | 5 | 0.126135% |
| B | 3965 | 2 | 0.050441% |
| C | 3965 | 3 | 0.075662% |
| D | 3965 | 306 | 7.717528% |
Noise dominated data is calculated using 1-second bins in cleaned event files. If a bin has >2000 counts, and if more than 50% of those come from <1% of pixels, then it is considered to be noise-dominated and hence unusable.
| Quadrant | # 1 sec bins | Bins with >0 counts | Bins with >2000 counts | High rate bins dominated by noise | Noise dominated (total time) | Noise dominated (detector-on time) | Marked lightcurve |
|---|---|---|---|---|---|---|---|
| A | 3964 | 3964 | 37 | 37 | 0.93% | 0.93% | 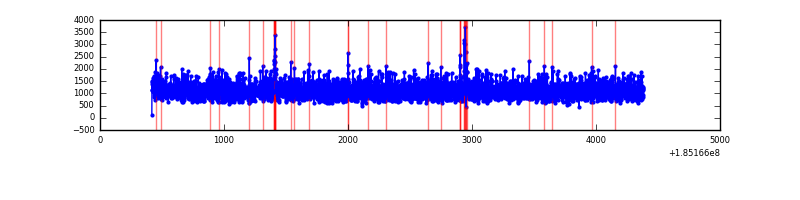 |
| B | 3965 | 3965 | 53 | 53 | 1.34% | 1.34% | 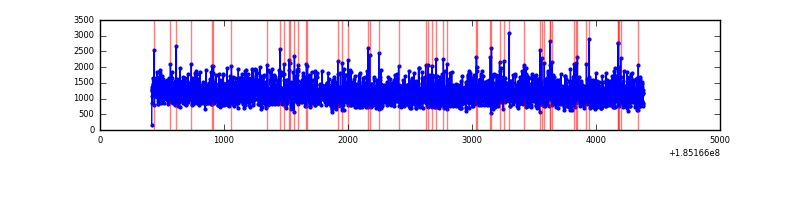 |
| C | 3965 | 3965 | 115 | 115 | 2.90% | 2.90% | 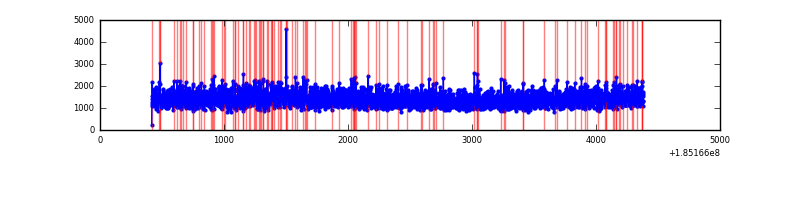 |
| D | 3965 | 3965 | 308 | 308 | 7.77% | 7.77% |  |
Top three noisy pixels from each quadrant. If the there are fewer than three noisy pixels in the level2.evt file, extra rows are filled as -1
| Pixel properties | Quadrant properties | ||||||
|---|---|---|---|---|---|---|---|
| Quadrant | DetID | PixID | Counts | Sigma | Mean | Median | Sigma |
| A | 15 | 171 | 57526 | 203.36 | 1142 | 1150 | 277.2 |
| A | 11 | 79 | 3849 | 9.74 | 1142 | 1150 | 277.2 |
| A | 3 | 111 | 3580 | 8.77 | 1142 | 1150 | 277.2 |
| B | 7 | 221 | 101775 | 357.51 | 1189 | 1199 | 281.3 |
| B | 0 | 220 | 50630 | 175.71 | 1189 | 1199 | 281.3 |
| B | 15 | 85 | 16292 | 53.65 | 1189 | 1199 | 281.3 |
| C | 3 | 127 | 659260 | 2209.05 | 1063 | 1097 | 297.9 |
| C | 3 | 31 | 161079 | 536.96 | 1063 | 1097 | 297.9 |
| C | 3 | 15 | 149469 | 497.99 | 1063 | 1097 | 297.9 |
| D | 9 | 64 | 881120 | 2939.0 | 973 | 1006 | 299.5 |
| D | 1 | 4 | 29735 | 95.94 | 973 | 1006 | 299.5 |
| D | 0 | 25 | 22510 | 71.81 | 973 | 1006 | 299.5 |
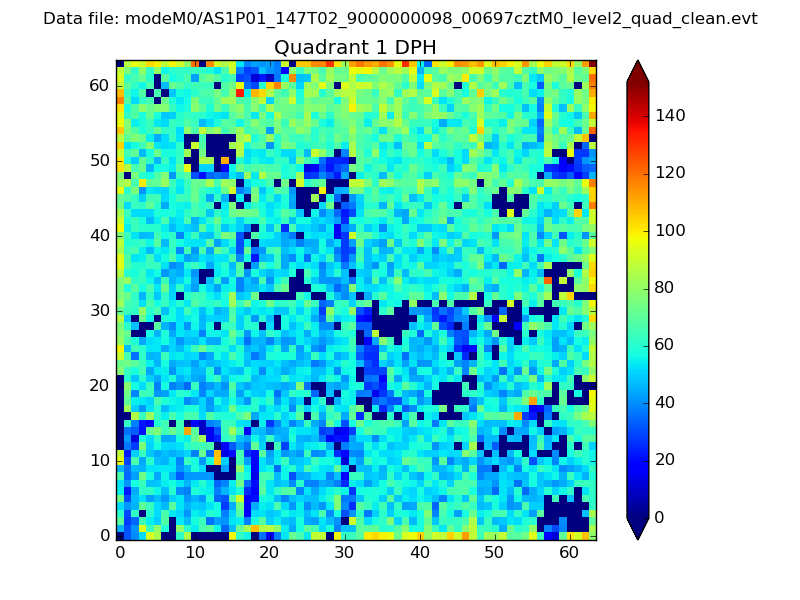
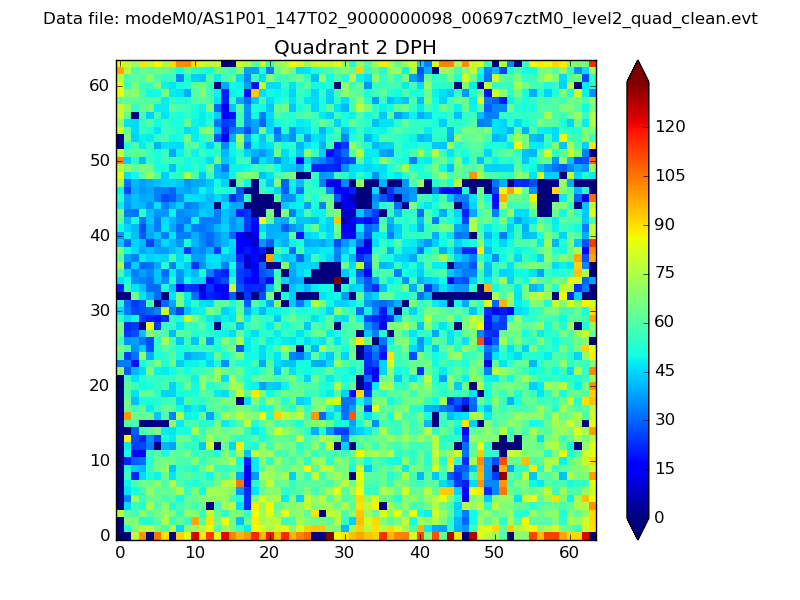
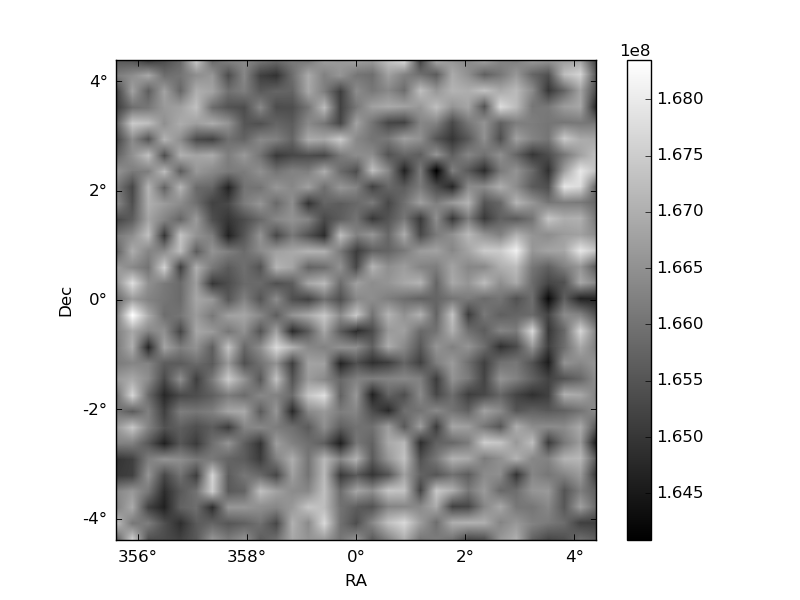
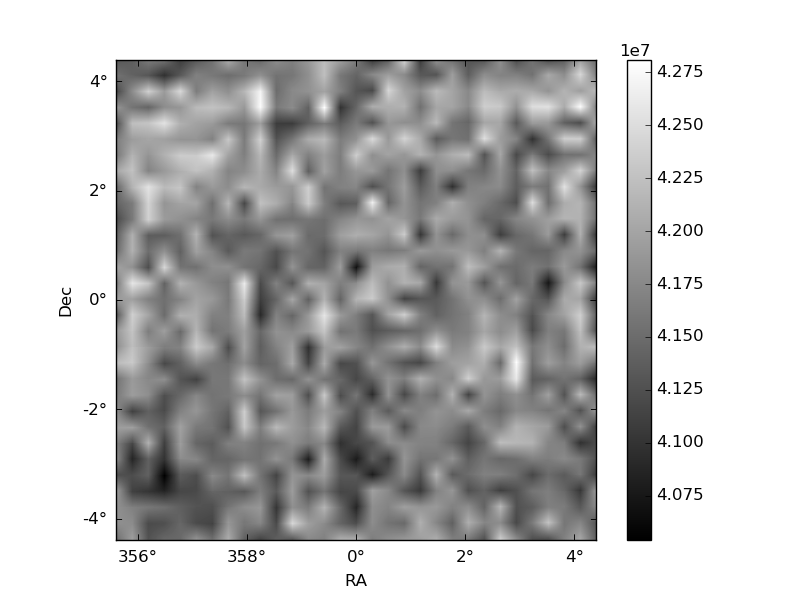
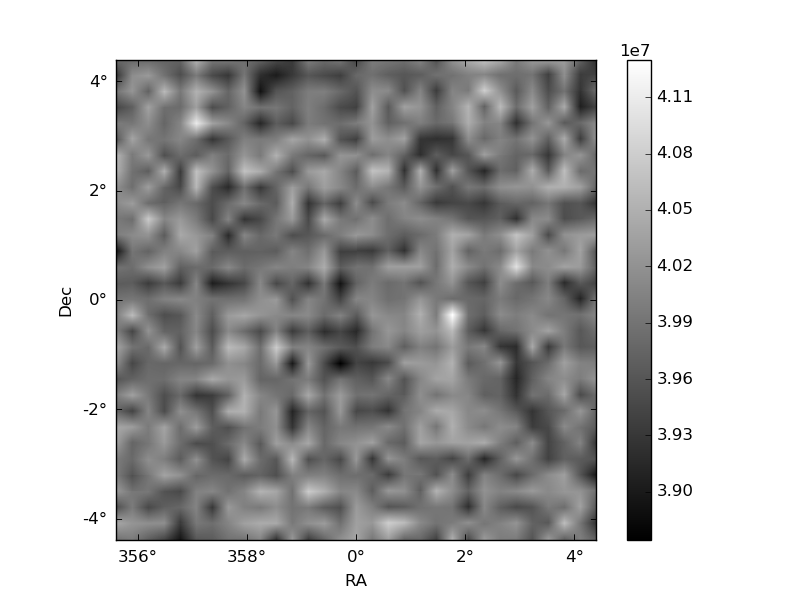
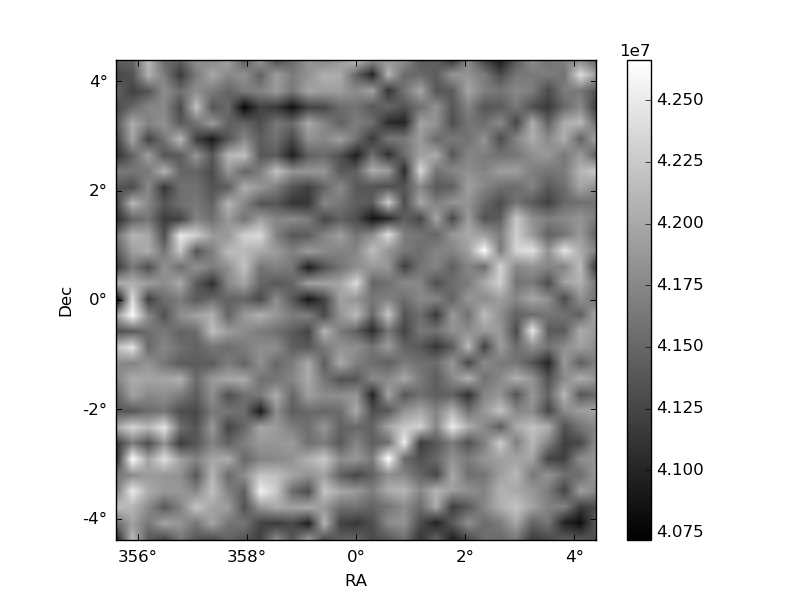
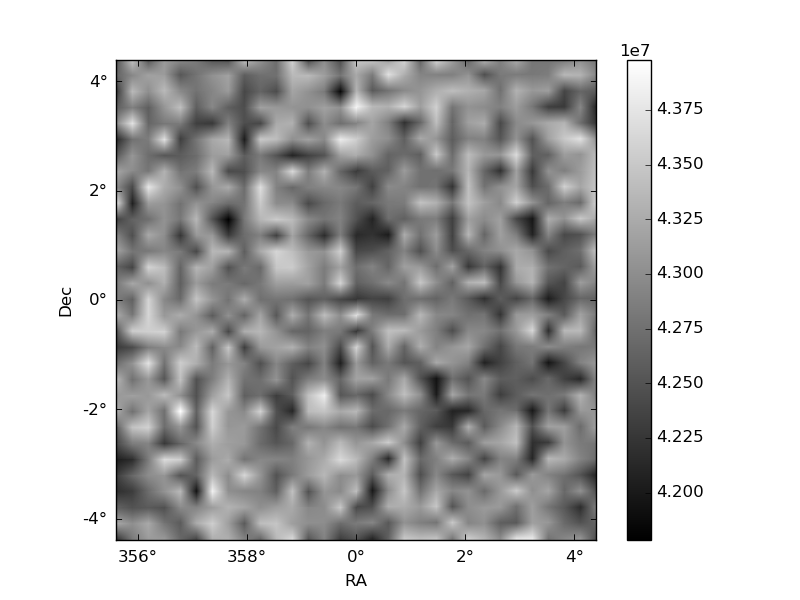
Histogram calculated using DETX and DETY for each event in the final _common_clean file
| Quadrant A | 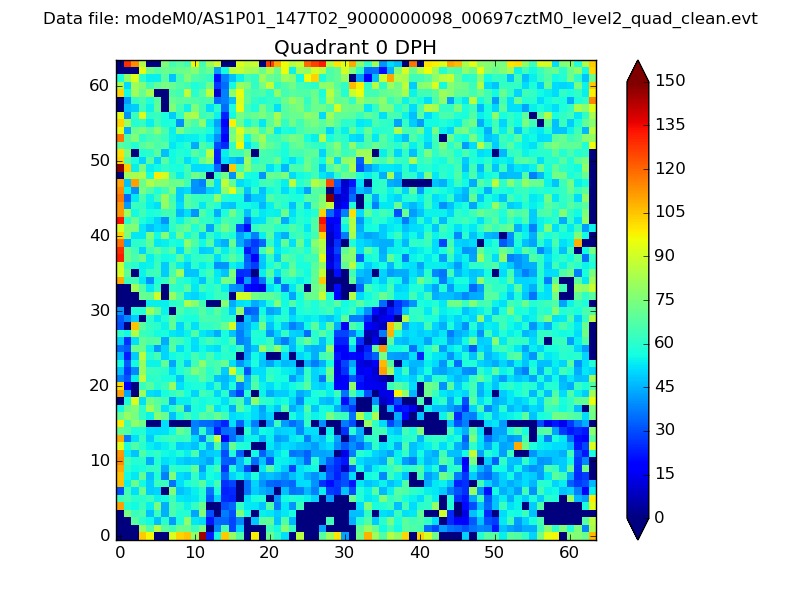 |
 |
Quadrant B |
|---|---|---|---|
| Quadrant D | 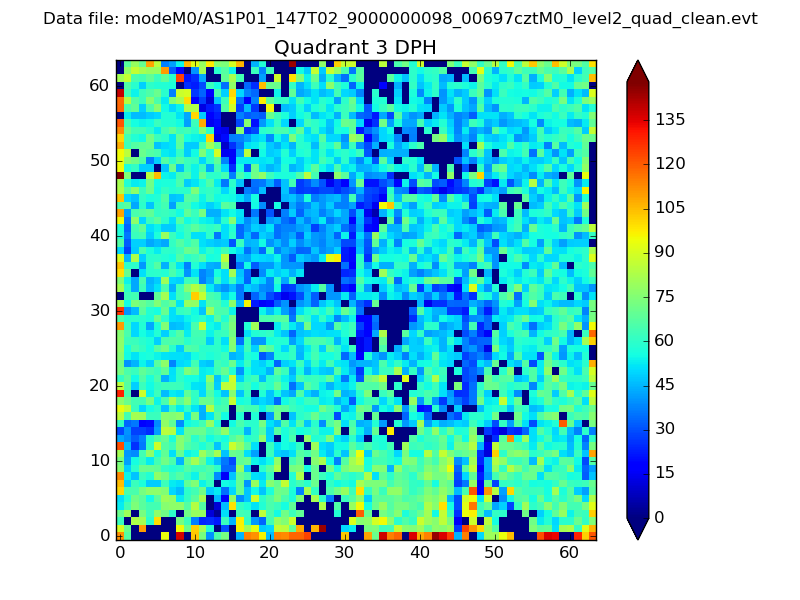 |
 |
Quadrant C |
| Plot type | Count rate plots | Images |
|---|---|---|
| Comparison with Poisson distribution Blue bars denote a histogram of data divided into 1 sec bins. Red curve is a Poisson curve with rate = median count rate of data. |
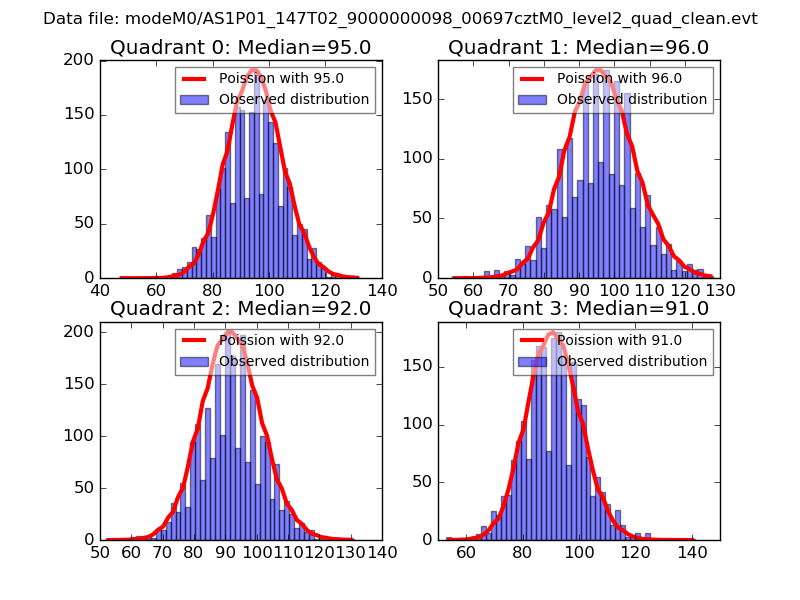 |
 |
| Quadrant-wise count rates Data is divided into 100 sec bins |
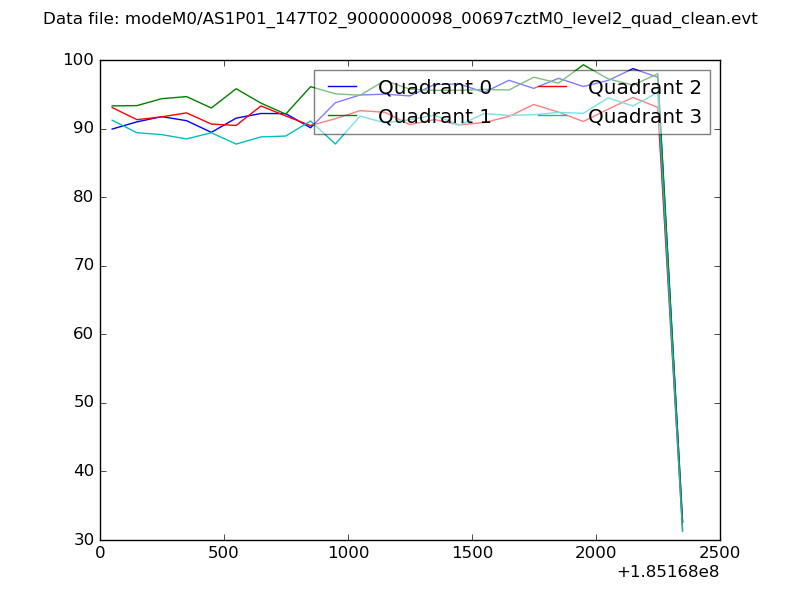 |
|
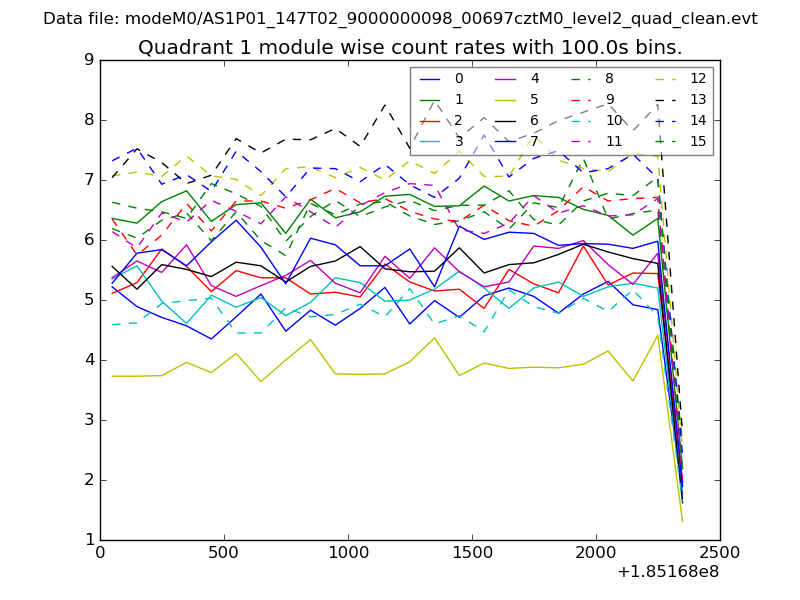
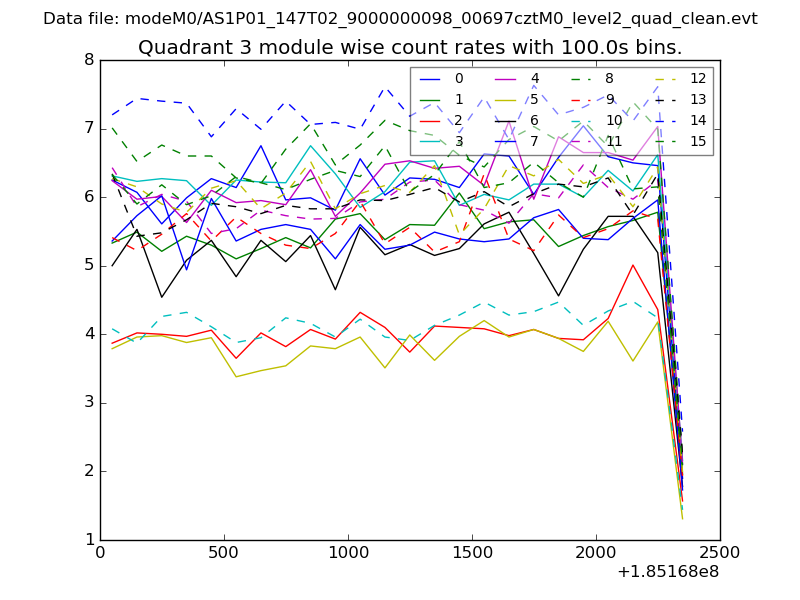
| Module-wise count rates for Quadrant A Data is divided into 100 sec bins |
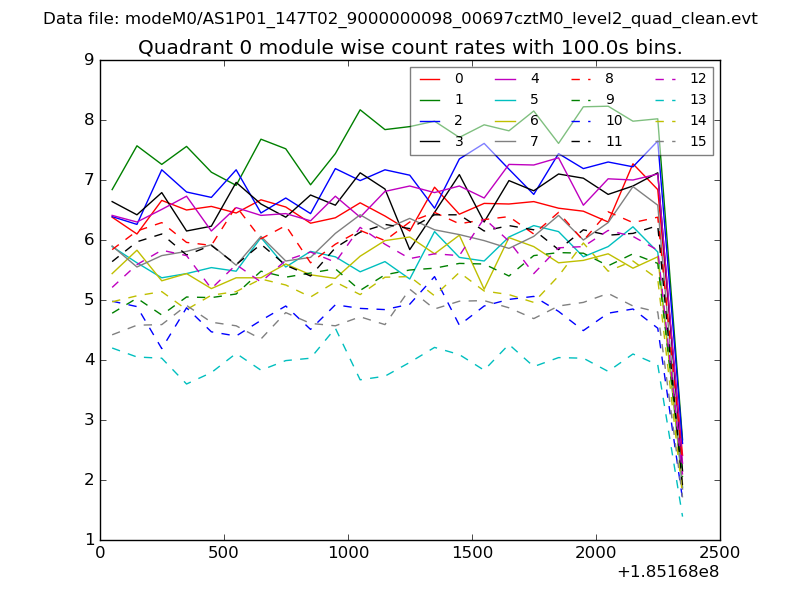 |
 |
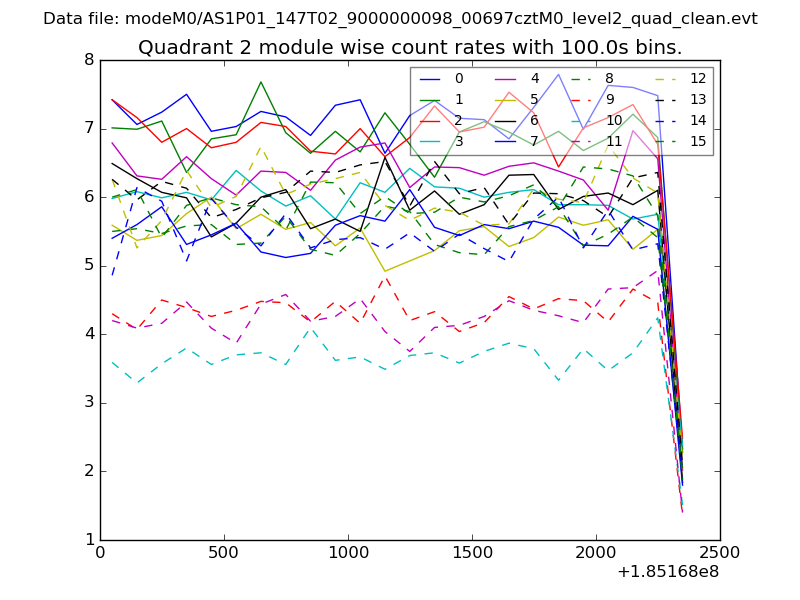
| Module-wise count rates for Quadrant B Data is divided into 100 sec bins |
 |
 |
| Module-wise count rates for Quadrant C Data is divided into 100 sec bins |
 |
 |
| Module-wise count rates for Quadrant D Data is divided into 100 sec bins |
 |
 |
| Parameter | Plot |
|---|---|
| CZT HV Monitor | 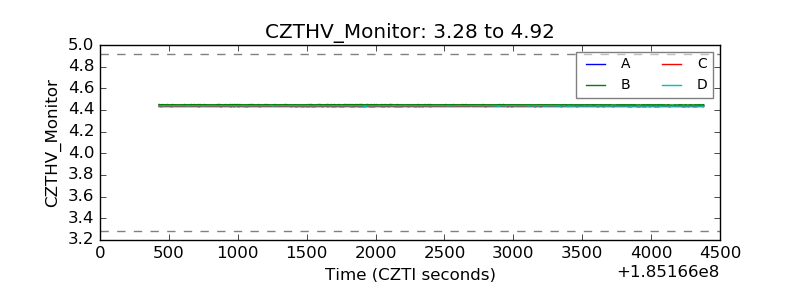 |
| D_VDD | 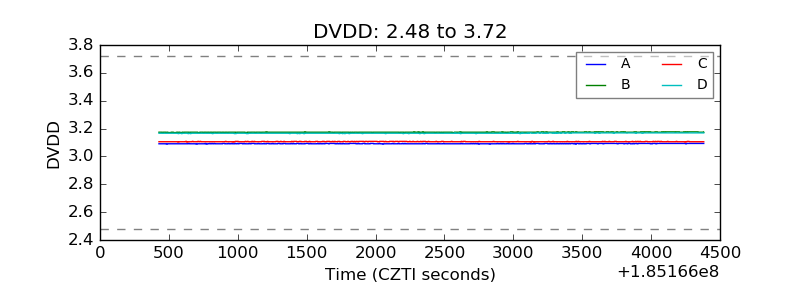 |
| Temperature 1 | 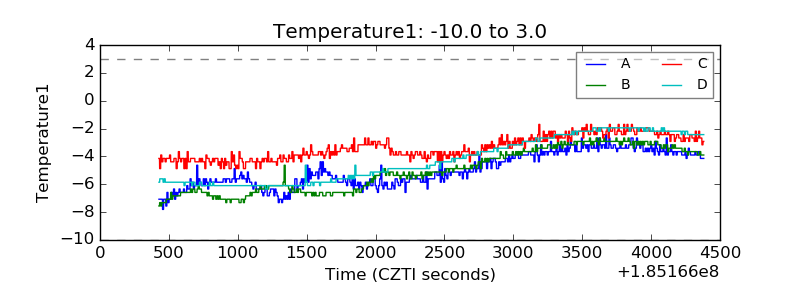 |
| Veto HV Monitor | 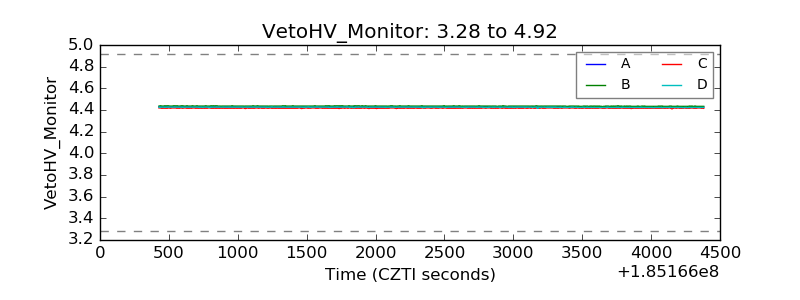 |
| Veto LLD | 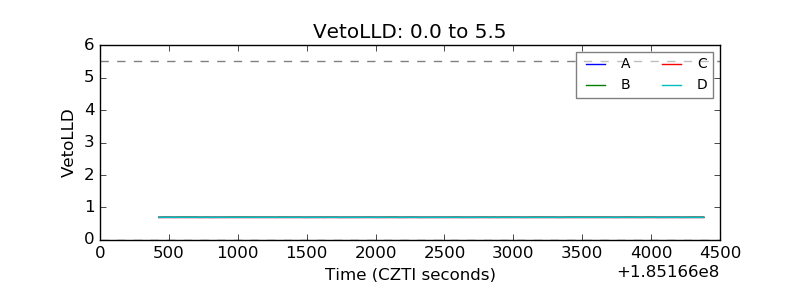 |
| Alpha Counter | 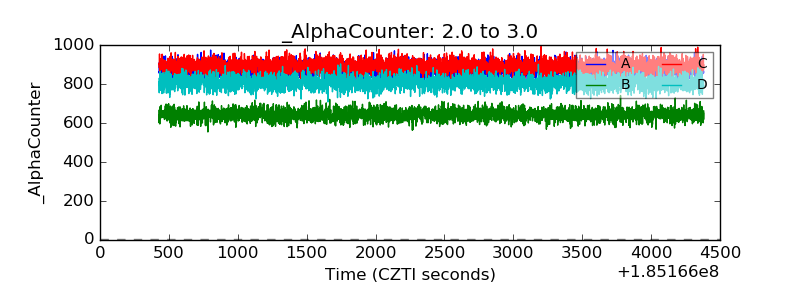 |
| _CPM_Rate | 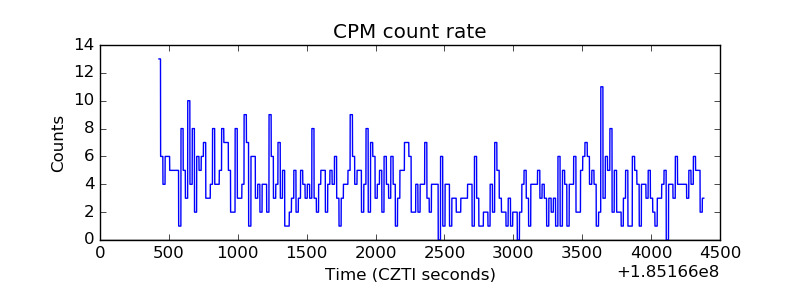 |
| CZT Counter | 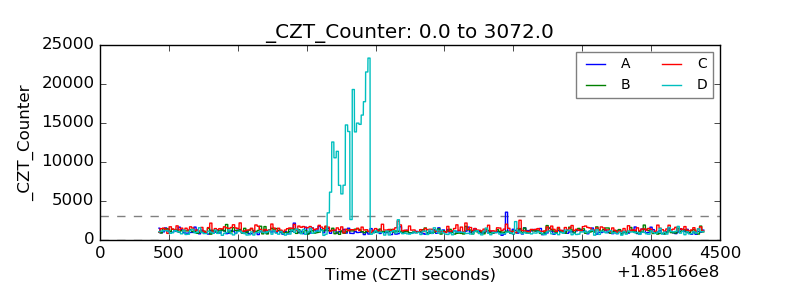 |
| +2.5 Volts monitor |  |
| +5 Volts monitor |  |
| _ROLL_ROT | 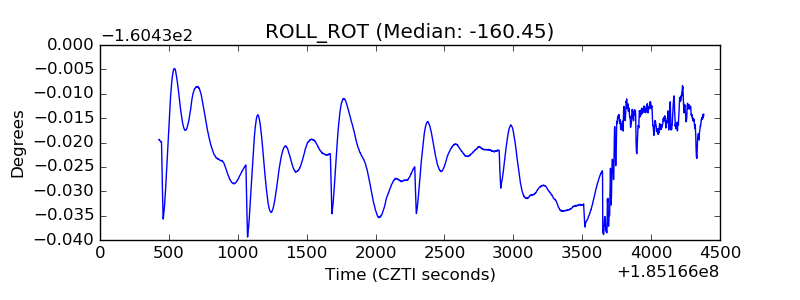 |
| _Roll_DEC | 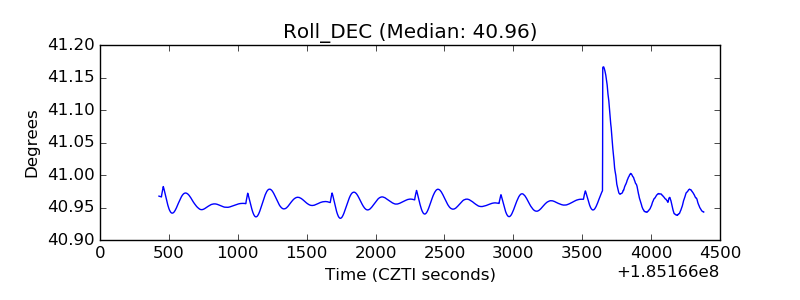 |
| _Roll_RA | 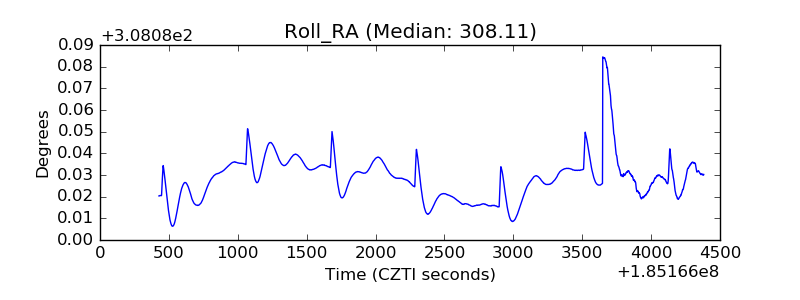 |
| Veto Counter | 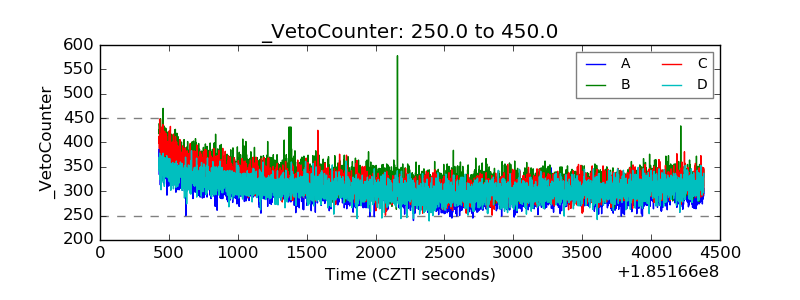 |