| Param | Original file | Final file |
|---|---|---|
| Filename | modeM0/AS1P01_141T01_9000000100cztM0_level2.fits | modeM0/AS1P01_141T01_9000000100cztM0_level2_quad_clean.evt |
| Size (bytes) | 230,155,200 | 246,165,120 |
| Size | 219.5 MB | 234.8 MB |
| Events in quadrant A | 1,329,566 | 1,464,344 |
| Events in quadrant B | 1,329,172 | 1,466,079 |
| Events in quadrant C | 1,288,252 | 1,377,918 |
| Events in quadrant D | 1,110,022 | 1,234,163 |
| Mode M0 | |||
|---|---|---|---|
| Quadrant | BADHDUFLAG | Total packets | Discarded packets |
| A | 0 | 124260 | 0 |
| B | 0 | 128566 | 0 |
| C | 0 | 144299 | 0 |
| D | 0 | 144631 | 0 |
| Mode SS | |||
|---|---|---|---|
| Quadrant | BADHDUFLAG | Total packets | Discarded packets |
| A | 0 | 570 | 0 |
| B | 0 | 568 | 0 |
| C | 0 | 566 | 0 |
| D | 0 | 570 | 0 |
| Mode M9 | |||
|---|---|---|---|
| Quadrant | BADHDUFLAG | Total packets | Discarded packets |
| A | 0 | 15 | 0 |
| B | 0 | 15 | 0 |
| C | 0 | 15 | 0 |
| D | 0 | 15 | 0 |
| Quadrant | Total seconds | Saturated seconds | Saturation percentage |
|---|---|---|---|
| A | 27852 | 408 | 1.464886% |
| B | 27808 | 490 | 1.762083% |
| C | 27771 | 511 | 1.840049% |
| D | 27773 | 616 | 2.217981% |
Noise dominated data is calculated using 1-second bins in cleaned event files. If a bin has >2000 counts, and if more than 50% of those come from <1% of pixels, then it is considered to be noise-dominated and hence unusable.
| Quadrant | # 1 sec bins | Bins with >0 counts | Bins with >2000 counts | High rate bins dominated by noise | Noise dominated (total time) | Noise dominated (detector-on time) | Marked lightcurve |
|---|---|---|---|---|---|---|---|
| A | 30021 | 28007 | 0 | 0 | 0.00% | 0.00% |  |
| B | 30021 | 27953 | 0 | 0 | 0.00% | 0.00% |  |
| C | 30021 | 27929 | 0 | 0 | 0.00% | 0.00% |  |
| D | 30021 | 27943 | 0 | 0 | 0.00% | 0.00% |  |
Top three noisy pixels from each quadrant. If the there are fewer than three noisy pixels in the level2.evt file, extra rows are filled as -1
| Pixel properties | Quadrant properties | ||||||
|---|---|---|---|---|---|---|---|
| Quadrant | DetID | PixID | Counts | Sigma | Mean | Median | Sigma |
| A | 7 | 110 | 1264 | 11.17 | 344 | 320 | 84.5 |
| A | 0 | 29 | 1225 | 10.71 | 344 | 320 | 84.5 |
| A | 0 | 30 | 1019 | 8.27 | 344 | 320 | 84.5 |
| B | 2 | 9 | 1034 | 10.28 | 350 | 330 | 68.5 |
| B | 14 | 254 | 881 | 8.05 | 350 | 330 | 68.5 |
| B | 10 | 225 | 871 | 7.9 | 350 | 330 | 68.5 |
| C | 12 | 241 | 860 | 6.38 | 340 | 313 | 85.8 |
| C | 2 | 127 | 847 | 6.23 | 340 | 313 | 85.8 |
| C | 9 | 242 | 843 | 6.18 | 340 | 313 | 85.8 |
| D | 1 | 19 | 846 | 7.02 | 316 | 286 | 79.7 |
| D | 1 | 3 | 817 | 6.66 | 316 | 286 | 79.7 |
| D | 6 | 44 | 814 | 6.62 | 316 | 286 | 79.7 |
Histogram calculated using DETX and DETY for each event in the final _common_clean file
| Quadrant A | 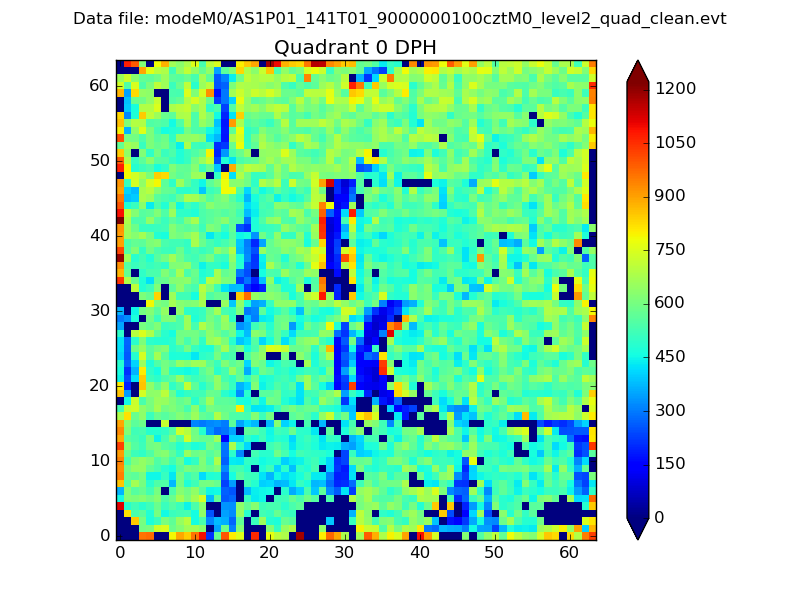 |
 |
Quadrant B |
|---|---|---|---|
| Quadrant D |  |
 |
Quadrant C |
| Plot type | Count rate plots | Images |
|---|---|---|
| Comparison with Poisson distribution Blue bars denote a histogram of data divided into 1 sec bins. Red curve is a Poisson curve with rate = median count rate of data. |
 |
 |
| Quadrant-wise count rates Data is divided into 100 sec bins |
 |
|
| Module-wise count rates for Quadrant A Data is divided into 100 sec bins |
 |
 |
| Module-wise count rates for Quadrant B Data is divided into 100 sec bins |
 |
 |
| Module-wise count rates for Quadrant C Data is divided into 100 sec bins |
 |
 |
| Module-wise count rates for Quadrant D Data is divided into 100 sec bins |
 |
 |
| Parameter | Plot |
|---|---|
| CZT HV Monitor |  |
| D_VDD | 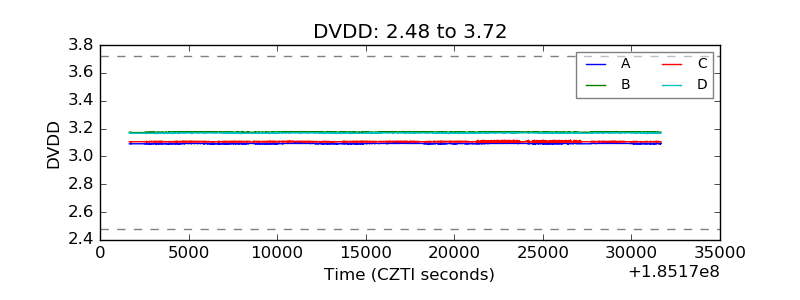 |
| Temperature 1 |  |
| Veto HV Monitor |  |
| Veto LLD |  |
| Alpha Counter |  |
| _CPM_Rate |  |
| CZT Counter |  |
| +2.5 Volts monitor |  |
| +5 Volts monitor |  |
| _ROLL_ROT |  |
| _Roll_DEC |  |
| _Roll_RA |  |
| Veto Counter |  |