| Param | Original file | Final file |
|---|---|---|
| Filename | modeM0/AS1P01_141T01_9000000100_00698cztM0_level2.evt | modeM0/AS1P01_141T01_9000000100_00698cztM0_level2_quad_clean.evt |
| Size (bytes) | 1,215,423,360 | 77,469,120 |
| Size | 1.1 GB | 73.9 MB |
| Events in quadrant A | 8,666,970 | 476,175 |
| Events in quadrant B | 8,784,864 | 479,455 |
| Events in quadrant C | 10,807,428 | 463,087 |
| Events in quadrant D | 8,103,280 | 455,196 |
| Mode M0 | |||
|---|---|---|---|
| Quadrant | BADHDUFLAG | Total packets | Discarded packets |
| A | 0 | 30564 | 3 |
| B | 0 | 30910 | 1 |
| C | 0 | 36847 | 1 |
| D | 0 | 28906 | 1 |
| Mode SS | |||
|---|---|---|---|
| Quadrant | BADHDUFLAG | Total packets | Discarded packets |
| A | 0 | 140 | 0 |
| B | 0 | 140 | 0 |
| C | 0 | 140 | 0 |
| D | 0 | 140 | 0 |
| Mode M9 | |||
|---|---|---|---|
| Quadrant | BADHDUFLAG | Total packets | Discarded packets |
| A | 0 | 2 | 0 |
| B | 0 | 2 | 0 |
| C | 0 | 2 | 0 |
| D | 0 | 2 | 0 |
| Quadrant | Total seconds | Saturated seconds | Saturation percentage |
|---|---|---|---|
| A | 6764 | 138 | 2.040213% |
| B | 6764 | 141 | 2.084565% |
| C | 6765 | 147 | 2.172949% |
| D | 6765 | 83 | 1.226903% |
Noise dominated data is calculated using 1-second bins in cleaned event files. If a bin has >2000 counts, and if more than 50% of those come from <1% of pixels, then it is considered to be noise-dominated and hence unusable.
| Quadrant | # 1 sec bins | Bins with >0 counts | Bins with >2000 counts | High rate bins dominated by noise | Noise dominated (total time) | Noise dominated (detector-on time) | Marked lightcurve |
|---|---|---|---|---|---|---|---|
| A | 6964 | 6766 | 446 | 446 | 6.40% | 6.59% | 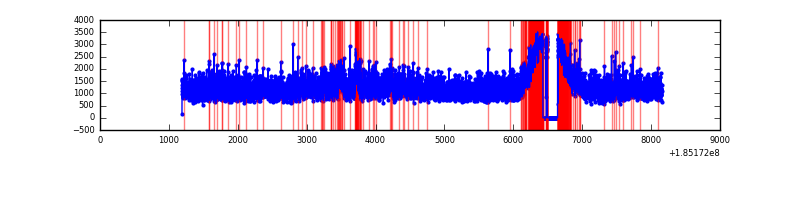 |
| B | 6964 | 6766 | 489 | 489 | 7.02% | 7.23% | 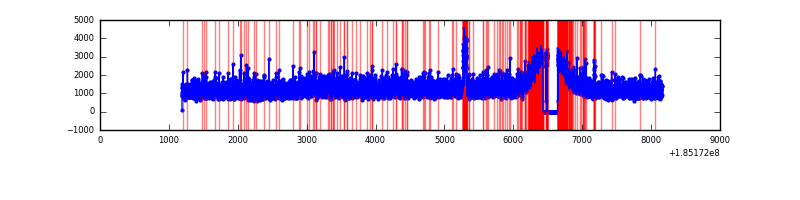 |
| C | 6965 | 6767 | 853 | 853 | 12.25% | 12.61% | 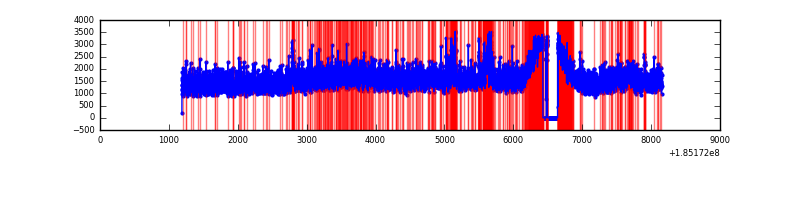 |
| D | 6965 | 6767 | 358 | 358 | 5.14% | 5.29% | 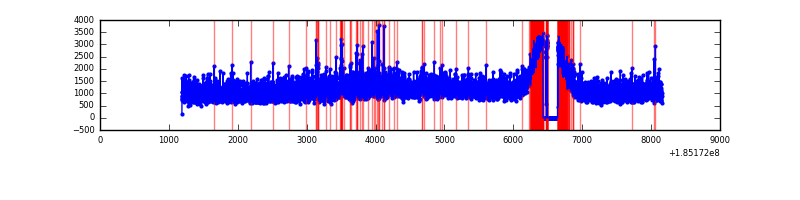 |
Top three noisy pixels from each quadrant. If the there are fewer than three noisy pixels in the level2.evt file, extra rows are filled as -1
| Pixel properties | Quadrant properties | ||||||
|---|---|---|---|---|---|---|---|
| Quadrant | DetID | PixID | Counts | Sigma | Mean | Median | Sigma |
| A | 15 | 69 | 285015 | 533.74 | 2178 | 2197 | 529.9 |
| A | 5 | 203 | 19070 | 31.84 | 2178 | 2197 | 529.9 |
| A | 15 | 53 | 8442 | 11.78 | 2178 | 2197 | 529.9 |
| B | 7 | 221 | 283265 | 532.95 | 2221 | 2238 | 527.3 |
| B | 0 | 230 | 24230 | 41.71 | 2221 | 2238 | 527.3 |
| B | 3 | 6 | 22094 | 37.66 | 2221 | 2238 | 527.3 |
| C | 3 | 127 | 1143308 | 2023.02 | 2012 | 2088 | 564.1 |
| C | 3 | 31 | 336222 | 592.31 | 2012 | 2088 | 564.1 |
| C | 3 | 95 | 285936 | 503.17 | 2012 | 2088 | 564.1 |
| D | 0 | 25 | 401485 | 643.16 | 1989 | 2061 | 621.0 |
| D | 1 | 4 | 210176 | 335.11 | 1989 | 2061 | 621.0 |
| D | 2 | 152 | 16438 | 23.15 | 1989 | 2061 | 621.0 |
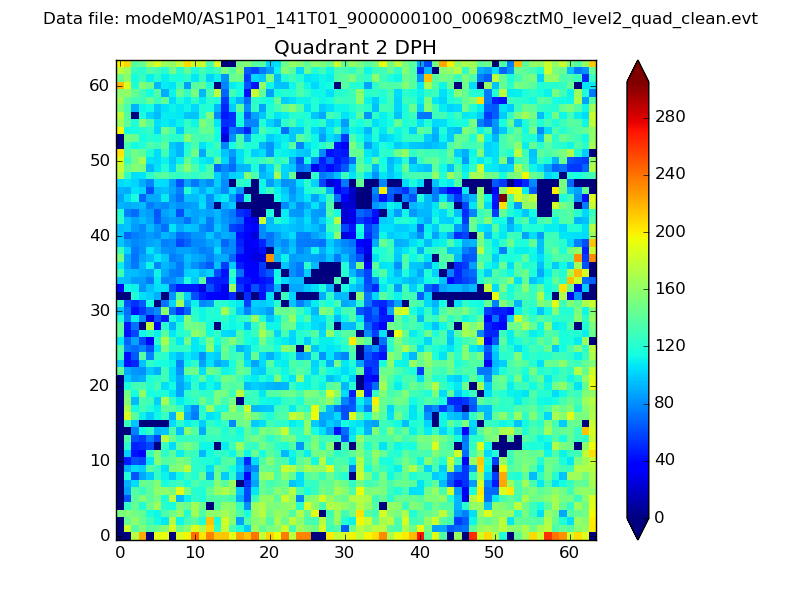
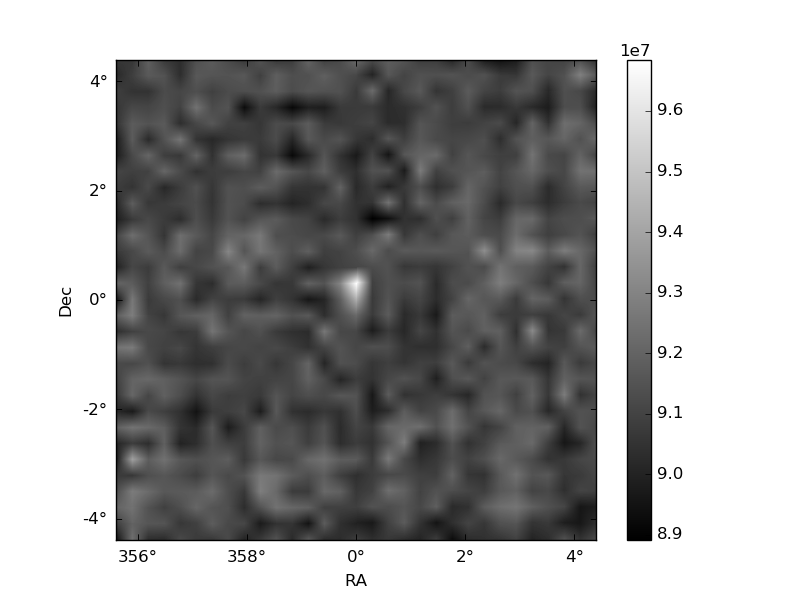
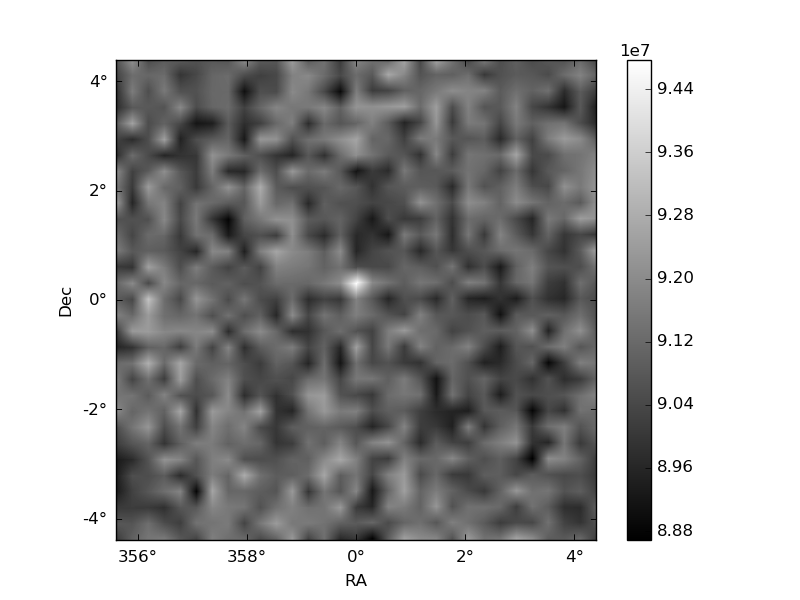
Histogram calculated using DETX and DETY for each event in the final _common_clean file
| Quadrant A | 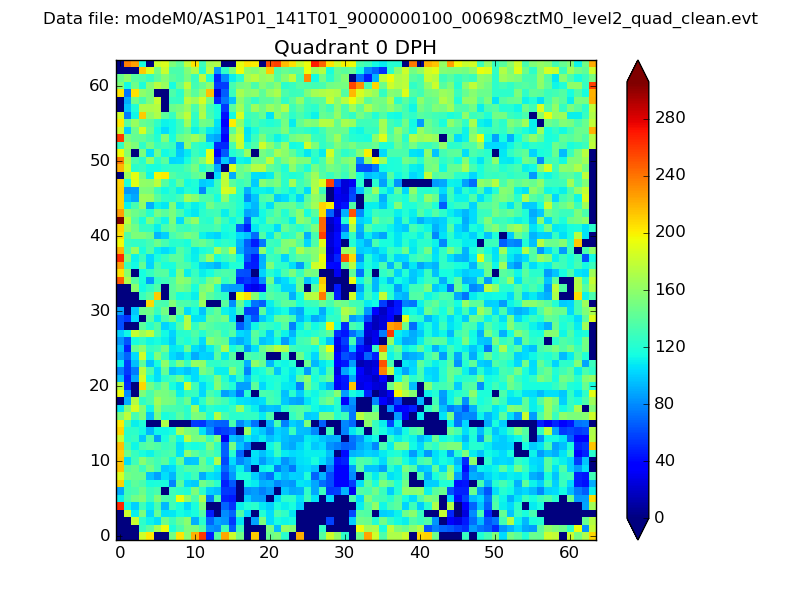 |
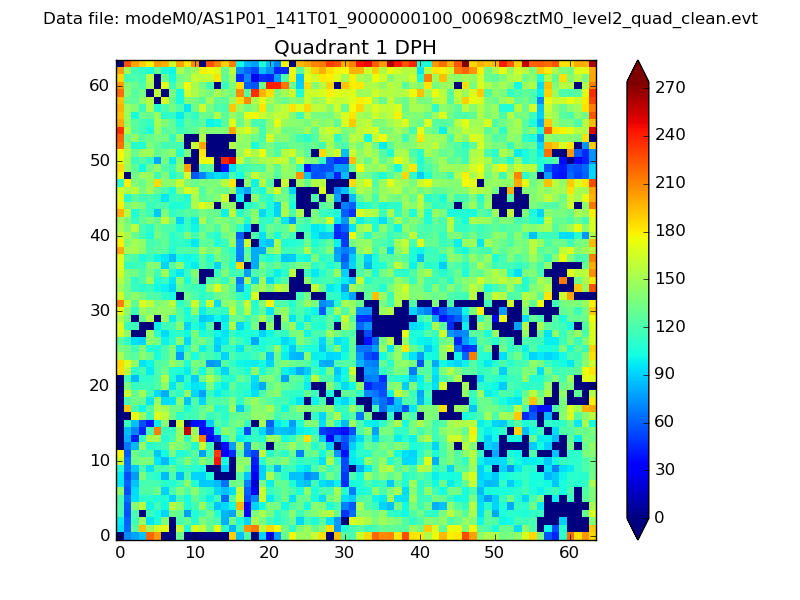 |
Quadrant B |
|---|---|---|---|
| Quadrant D | 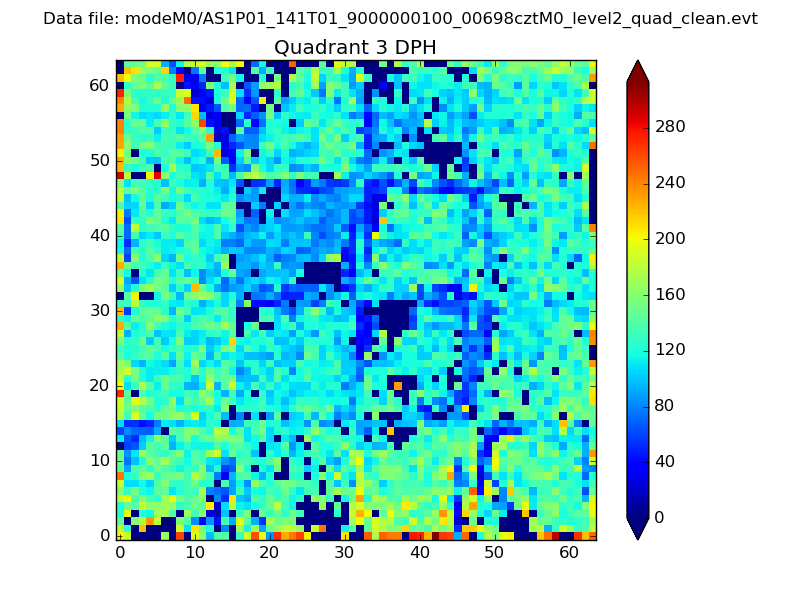 |
 |
Quadrant C |
| Plot type | Count rate plots | Images |
|---|---|---|
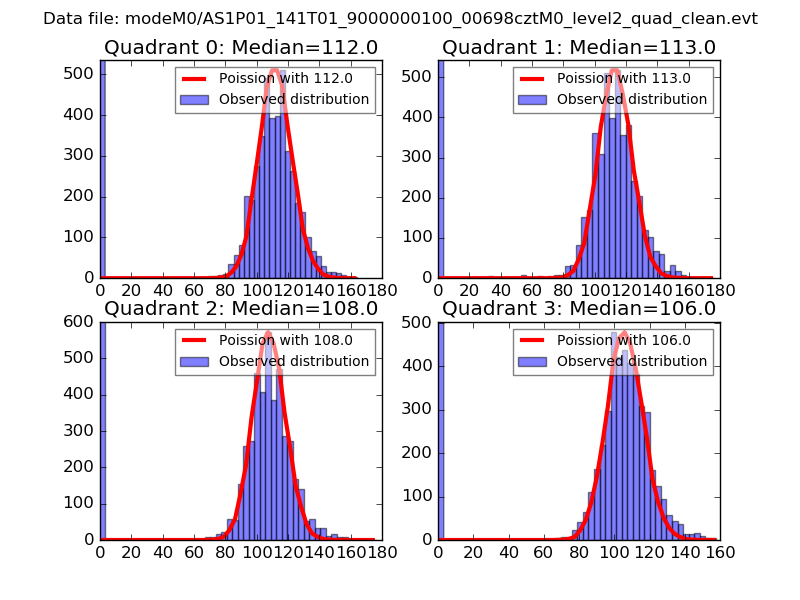
| Comparison with Poisson distribution Blue bars denote a histogram of data divided into 1 sec bins. Red curve is a Poisson curve with rate = median count rate of data. |
 |
 |
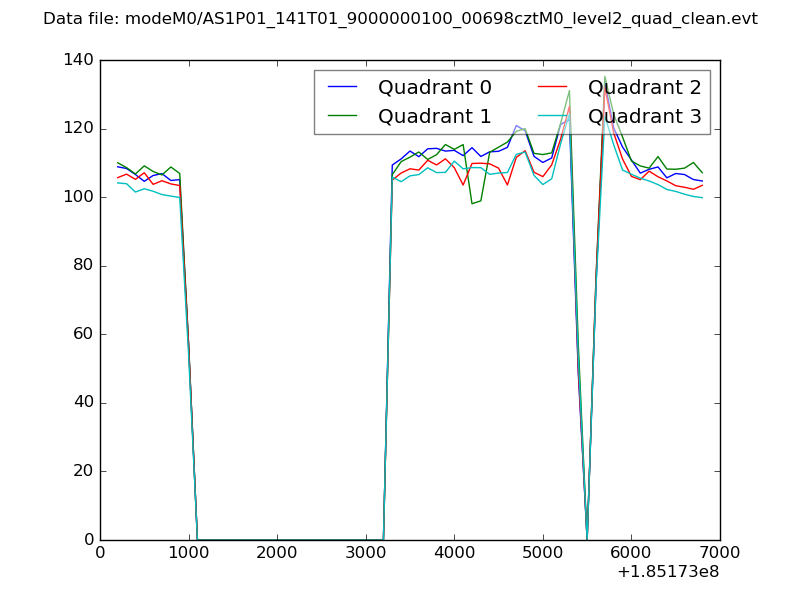
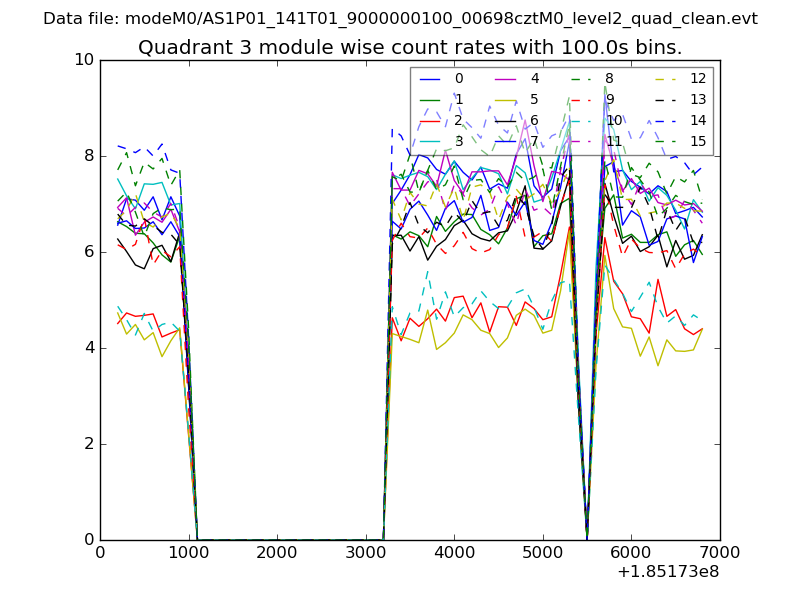
| Quadrant-wise count rates Data is divided into 100 sec bins |
 |
|
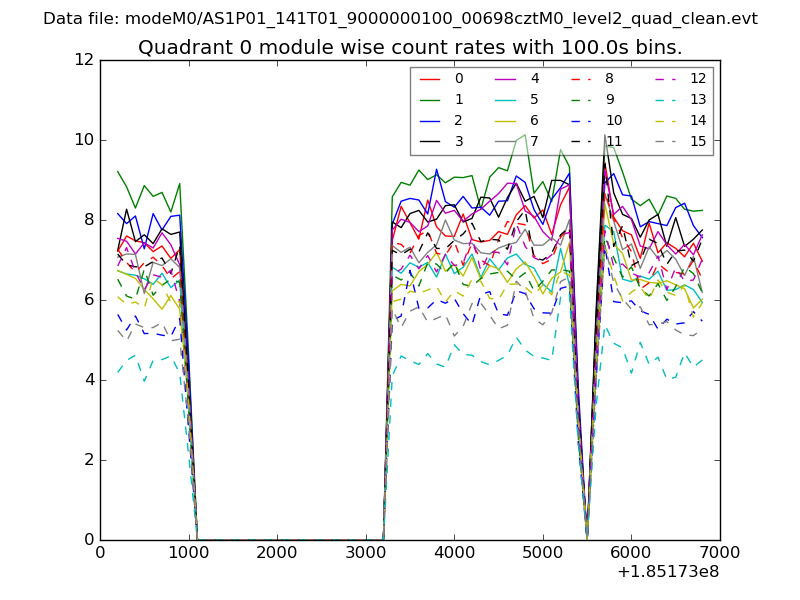
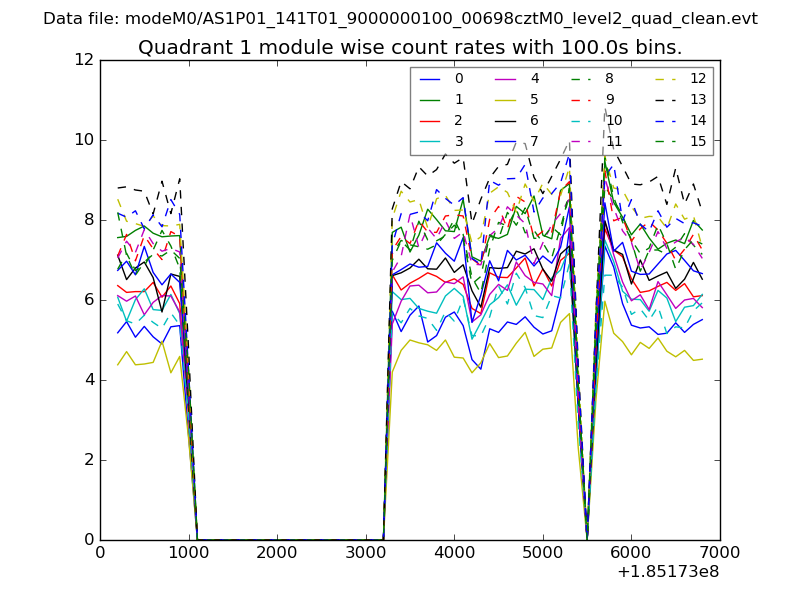
| Module-wise count rates for Quadrant A Data is divided into 100 sec bins |
 |
 |
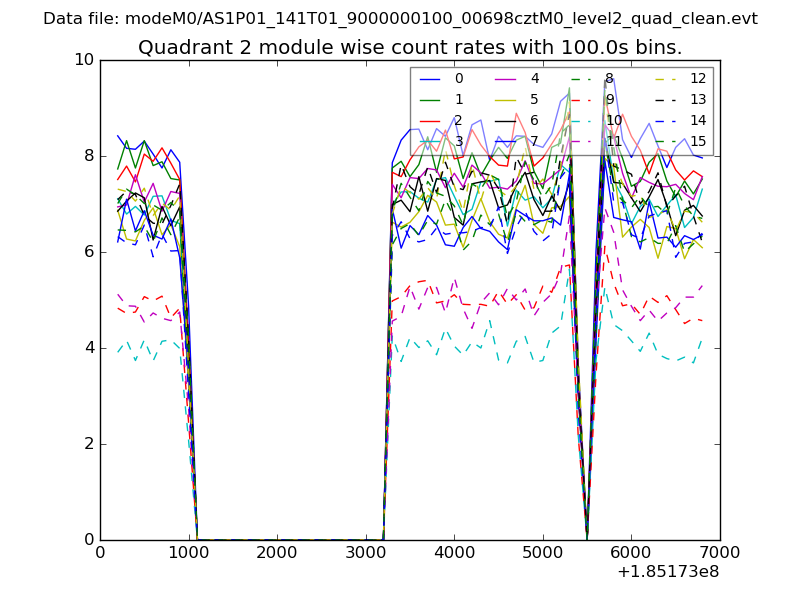
| Module-wise count rates for Quadrant B Data is divided into 100 sec bins |
 |
 |
| Module-wise count rates for Quadrant C Data is divided into 100 sec bins |
 |
 |
| Module-wise count rates for Quadrant D Data is divided into 100 sec bins |
 |
 |
| Parameter | Plot |
|---|---|
| CZT HV Monitor | 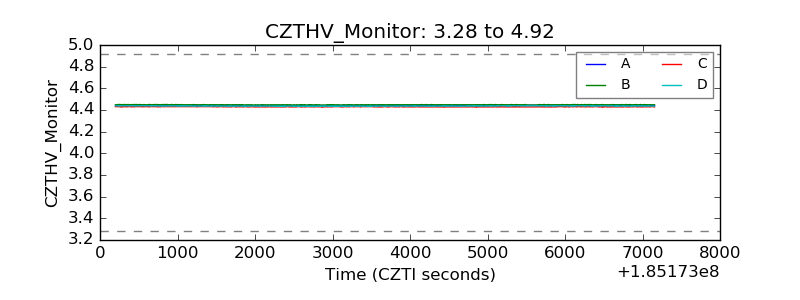 |
| D_VDD | 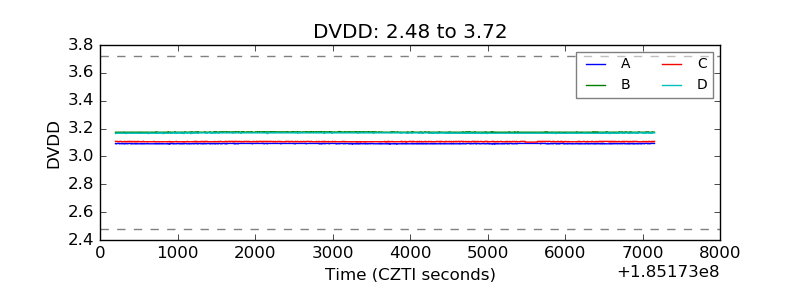 |
| Temperature 1 | 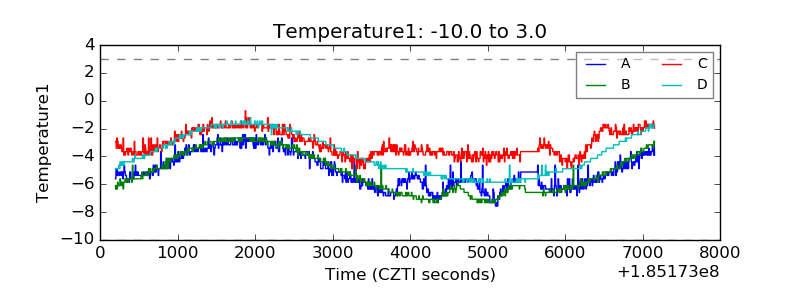 |
| Veto HV Monitor | 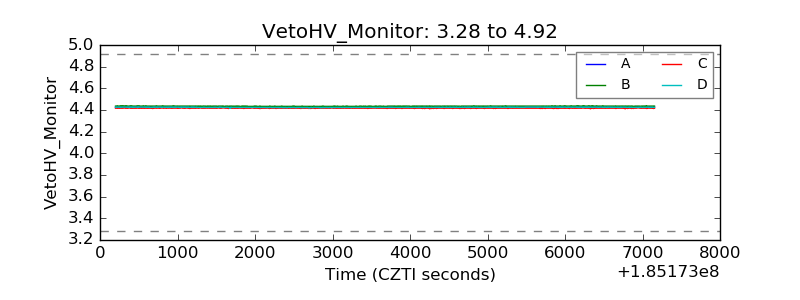 |
| Veto LLD | 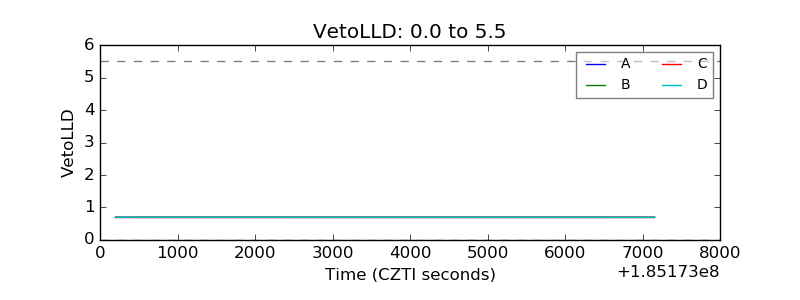 |
| Alpha Counter | 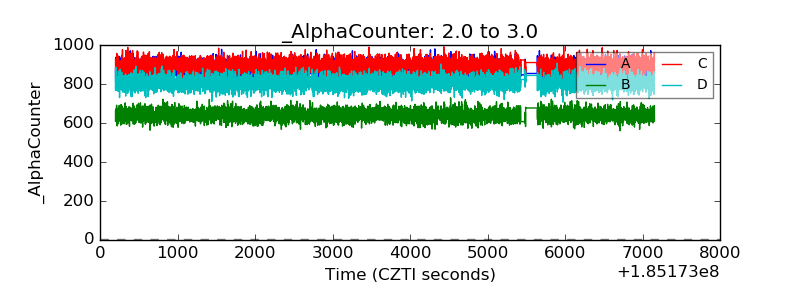 |
| _CPM_Rate | 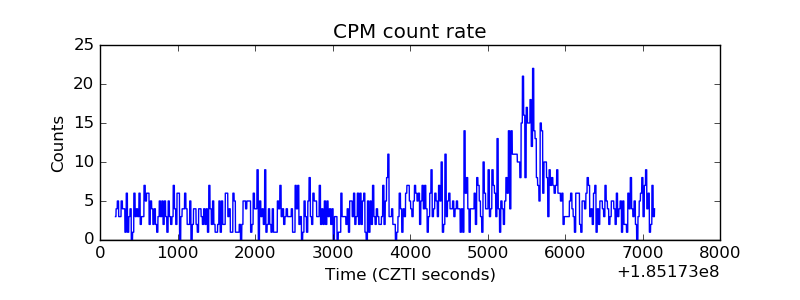 |
| CZT Counter | 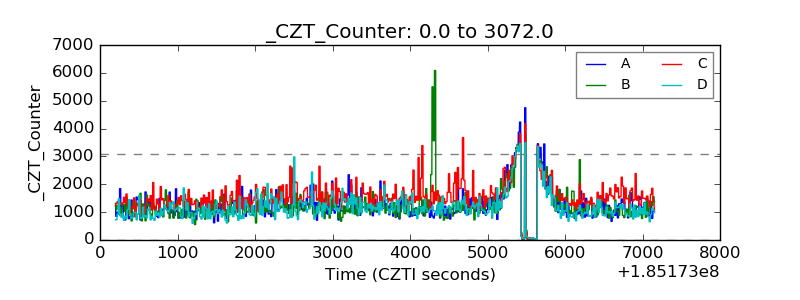 |
| +2.5 Volts monitor |  |
| +5 Volts monitor | 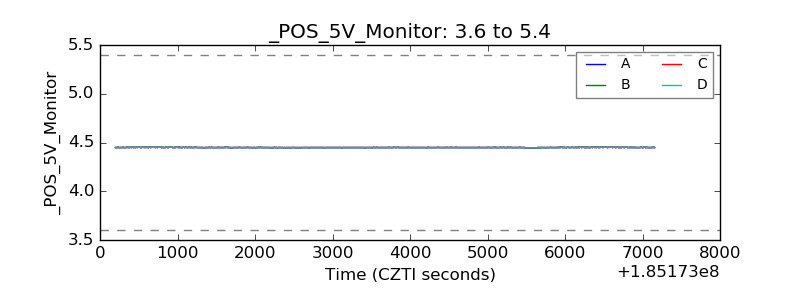 |
| _ROLL_ROT |  |
| _Roll_DEC | 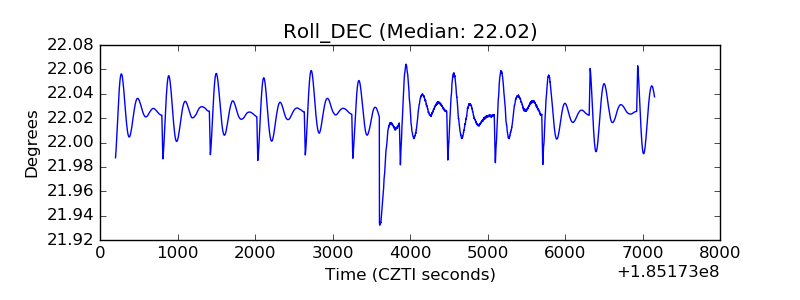 |
| _Roll_RA | 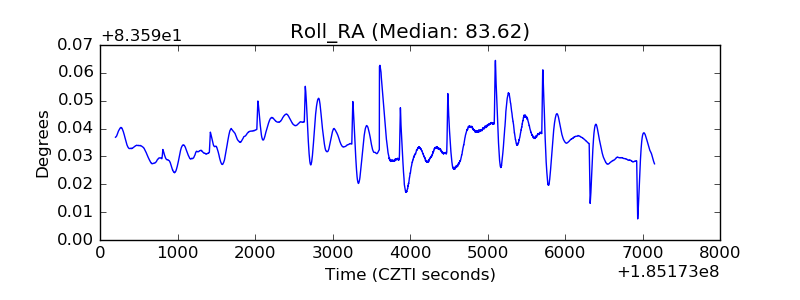 |
| Veto Counter | 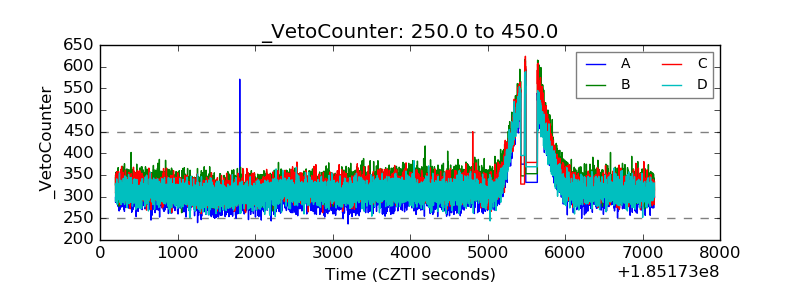 |