| Param | Original file | Final file |
|---|---|---|
| Filename | modeM0/AS1P01_141T01_9000000100_00699cztM0_level2.evt | modeM0/AS1P01_141T01_9000000100_00699cztM0_level2_quad_clean.evt |
| Size (bytes) | 1,314,253,440 | 74,329,920 |
| Size | 1.2 GB | 70.9 MB |
| Events in quadrant A | 8,762,846 | 449,210 |
| Events in quadrant B | 9,395,872 | 453,571 |
| Events in quadrant C | 10,728,557 | 438,932 |
| Events in quadrant D | 10,451,971 | 418,855 |
| Mode M0 | |||
|---|---|---|---|
| Quadrant | BADHDUFLAG | Total packets | Discarded packets |
| A | 0 | 30993 | 0 |
| B | 0 | 32932 | 0 |
| C | 0 | 36836 | 0 |
| D | 0 | 36026 | 6 |
| Mode SS | |||
|---|---|---|---|
| Quadrant | BADHDUFLAG | Total packets | Discarded packets |
| A | 0 | 142 | 0 |
| B | 0 | 142 | 0 |
| C | 0 | 142 | 0 |
| D | 0 | 140 | 0 |
| Quadrant | Total seconds | Saturated seconds | Saturation percentage |
|---|---|---|---|
| A | 7039 | 47 | 0.667708% |
| B | 7039 | 113 | 1.605342% |
| C | 7015 | 102 | 1.454027% |
| D | 7038 | 107 | 1.520318% |
Noise dominated data is calculated using 1-second bins in cleaned event files. If a bin has >2000 counts, and if more than 50% of those come from <1% of pixels, then it is considered to be noise-dominated and hence unusable.
| Quadrant | # 1 sec bins | Bins with >0 counts | Bins with >2000 counts | High rate bins dominated by noise | Noise dominated (total time) | Noise dominated (detector-on time) | Marked lightcurve |
|---|---|---|---|---|---|---|---|
| A | 7039 | 7039 | 417 | 417 | 5.92% | 5.92% | 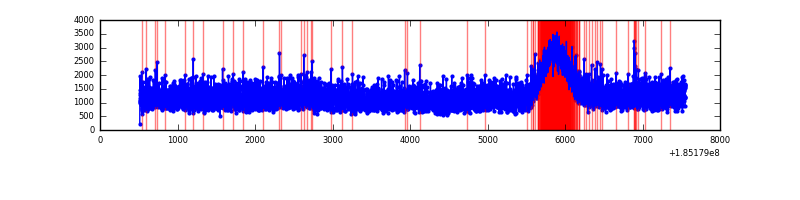 |
| B | 7039 | 7039 | 548 | 548 | 7.79% | 7.79% | 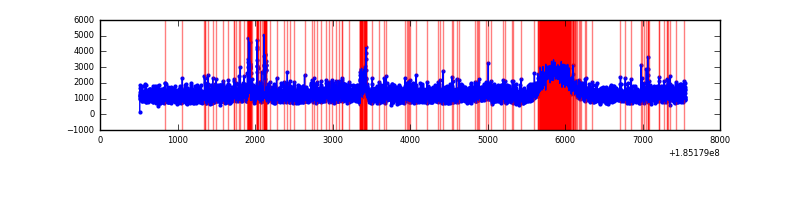 |
| C | 7039 | 7016 | 854 | 854 | 12.13% | 12.17% | 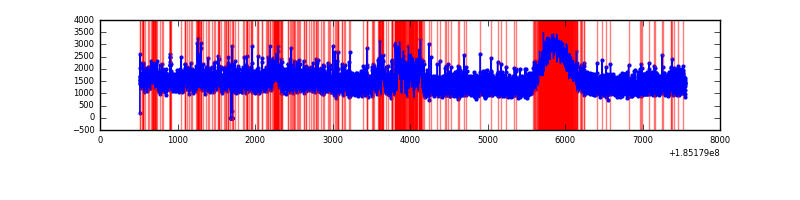 |
| D | 7038 | 7038 | 814 | 814 | 11.57% | 11.57% | 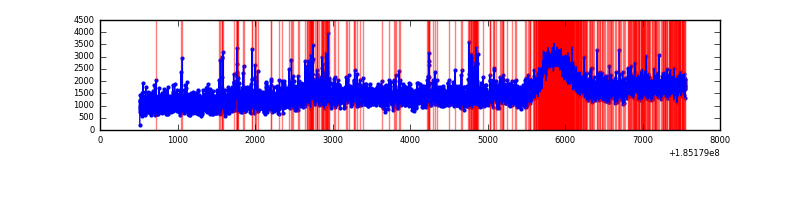 |
Top three noisy pixels from each quadrant. If the there are fewer than three noisy pixels in the level2.evt file, extra rows are filled as -1
| Pixel properties | Quadrant properties | ||||||
|---|---|---|---|---|---|---|---|
| Quadrant | DetID | PixID | Counts | Sigma | Mean | Median | Sigma |
| A | 15 | 69 | 29395 | 49.08 | 2272 | 2292 | 552.2 |
| A | 15 | 171 | 12499 | 18.48 | 2272 | 2292 | 552.2 |
| A | 11 | 79 | 9205 | 12.52 | 2272 | 2292 | 552.2 |
| B | 7 | 221 | 254783 | 456.87 | 2317 | 2336 | 552.6 |
| B | 5 | 191 | 200610 | 358.83 | 2317 | 2336 | 552.6 |
| B | 0 | 220 | 67848 | 118.56 | 2317 | 2336 | 552.6 |
| C | 3 | 95 | 455425 | 754.77 | 2126 | 2205 | 600.5 |
| C | 3 | 31 | 402279 | 666.27 | 2126 | 2205 | 600.5 |
| C | 9 | 85 | 373156 | 617.77 | 2126 | 2205 | 600.5 |
| D | 0 | 25 | 2142655 | 3278.3 | 2086 | 2165 | 652.9 |
| D | 1 | 4 | 175464 | 265.42 | 2086 | 2165 | 652.9 |
| D | 12 | 233 | 152114 | 229.66 | 2086 | 2165 | 652.9 |
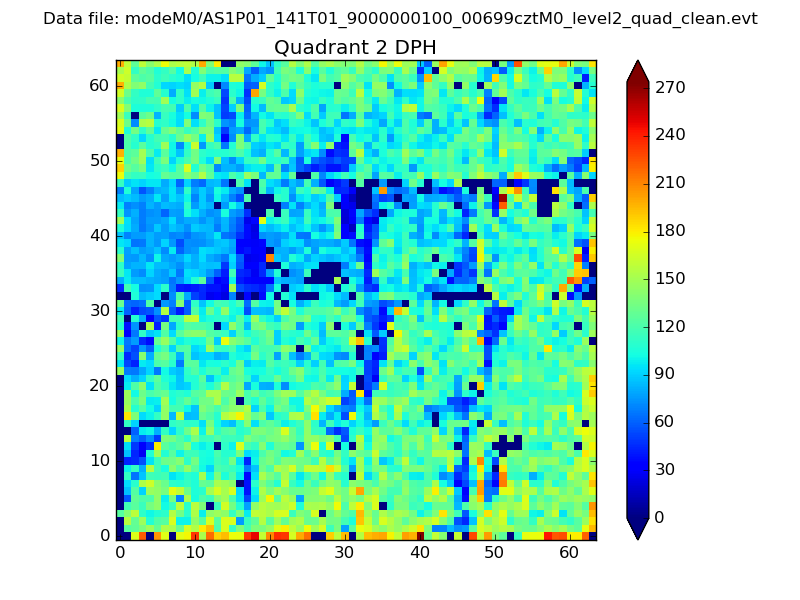
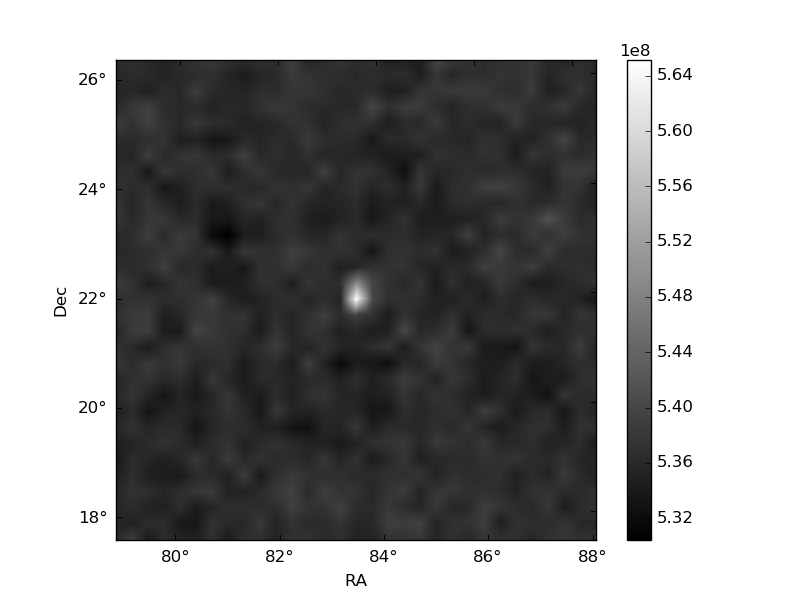
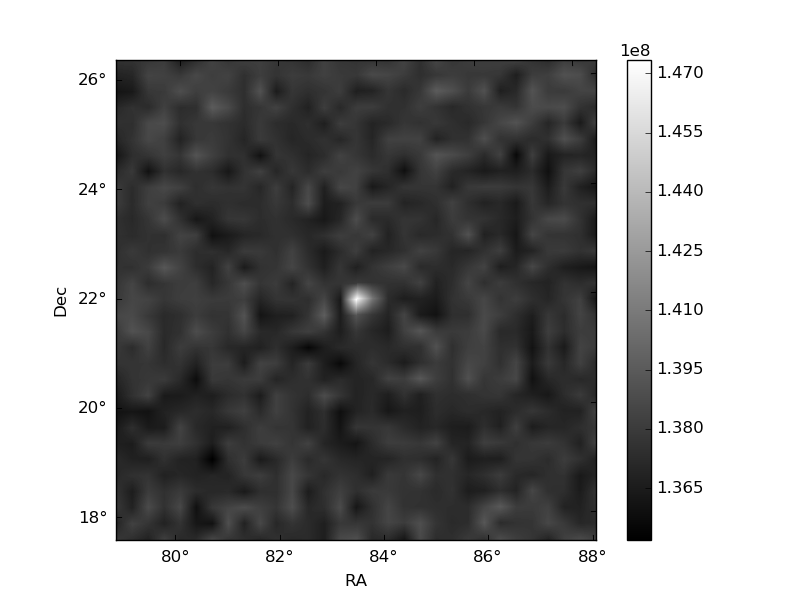
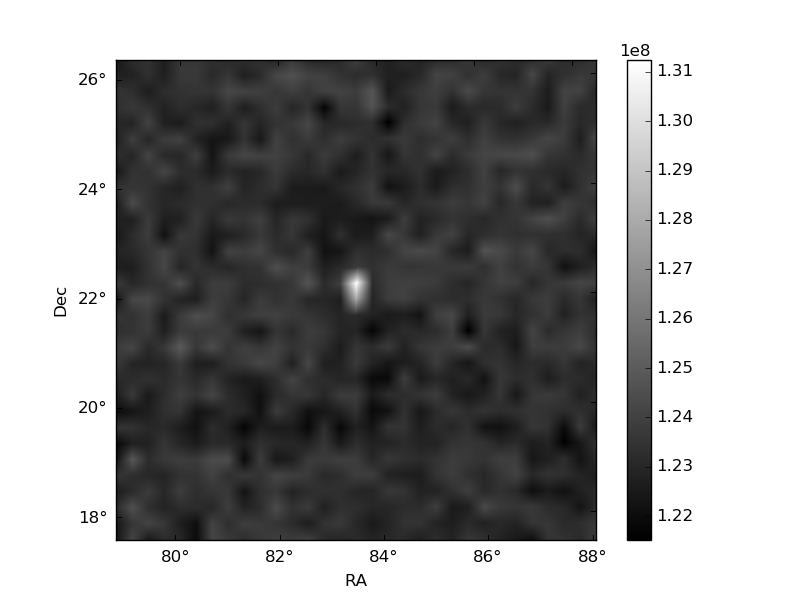
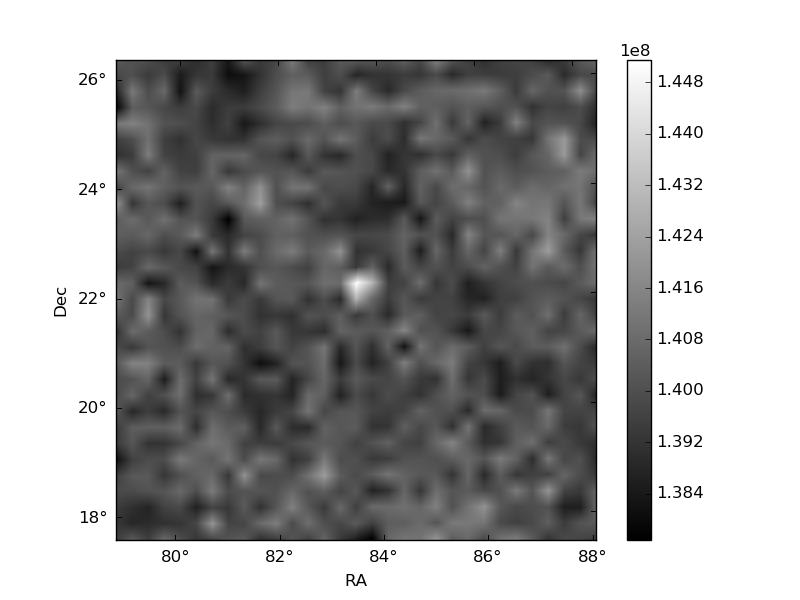
Histogram calculated using DETX and DETY for each event in the final _common_clean file
| Quadrant A | 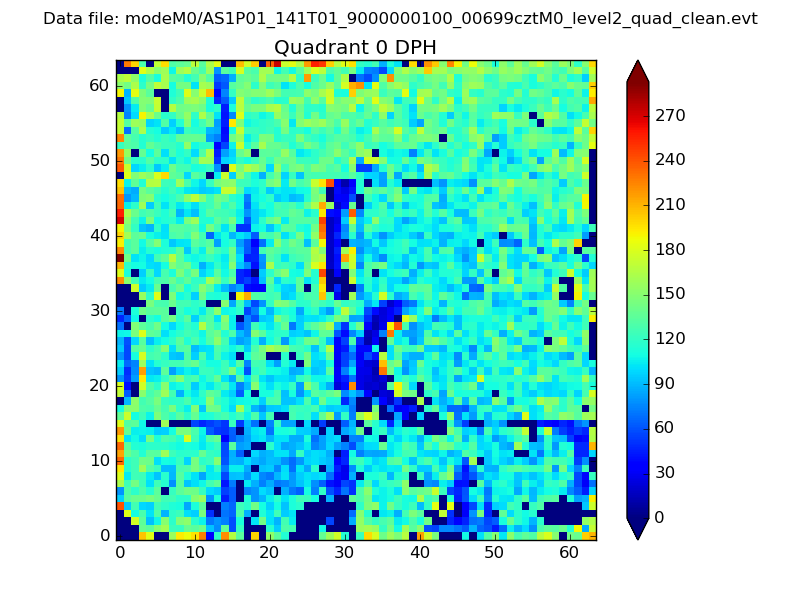 |
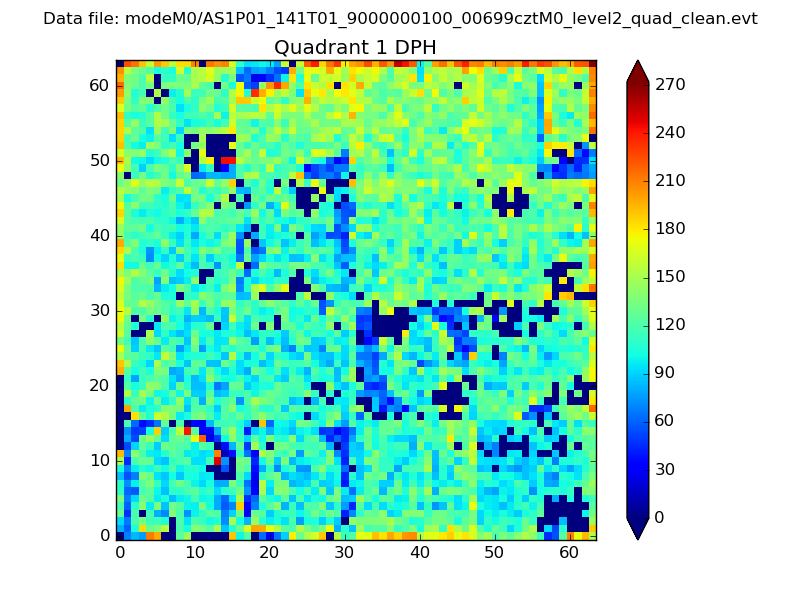 |
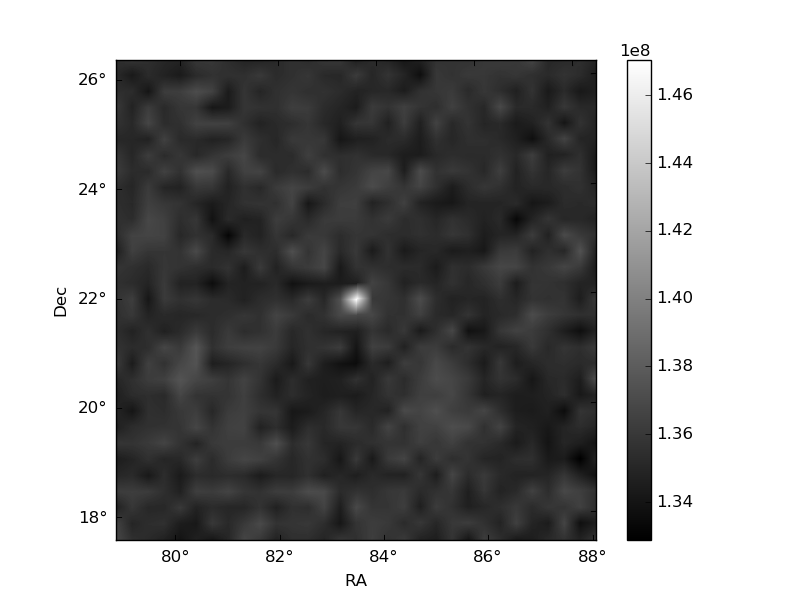
Quadrant B |
|---|---|---|---|
| Quadrant D | 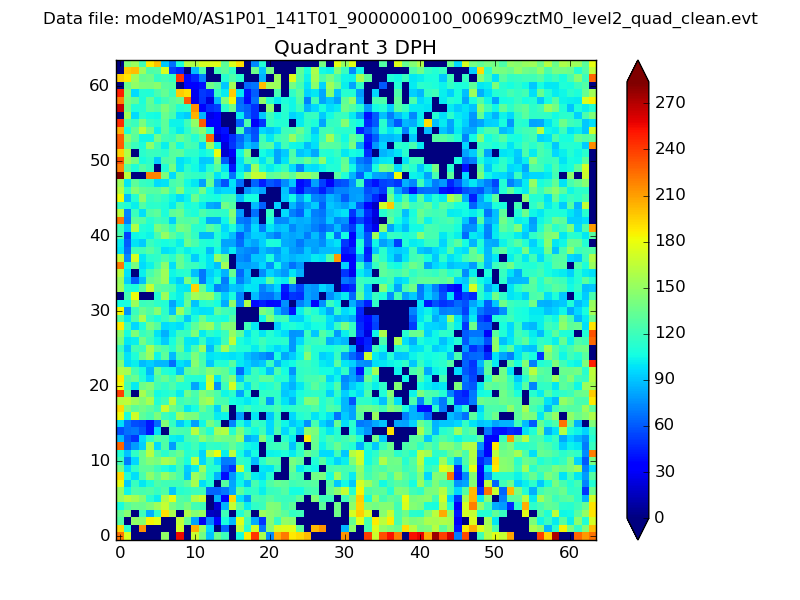 |
 |
Quadrant C |
| Plot type | Count rate plots | Images |
|---|---|---|
| Comparison with Poisson distribution Blue bars denote a histogram of data divided into 1 sec bins. Red curve is a Poisson curve with rate = median count rate of data. |
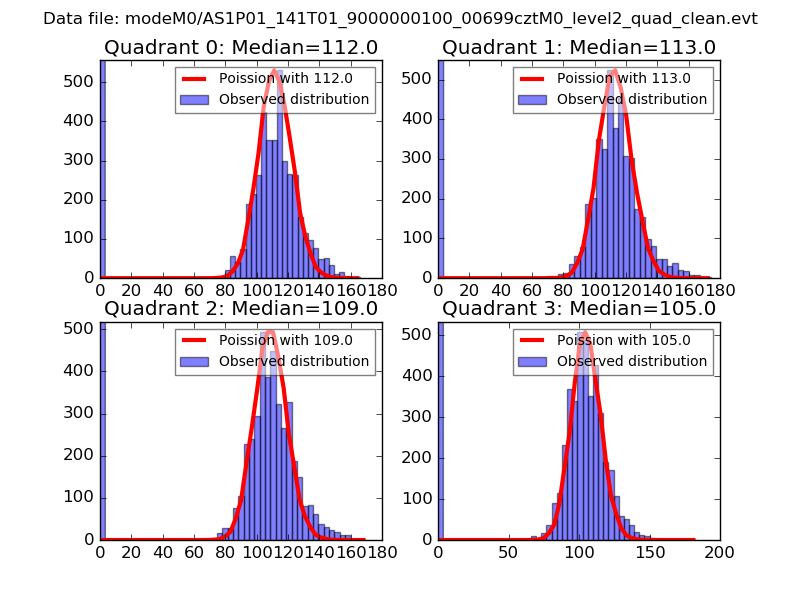 |
 |
| Quadrant-wise count rates Data is divided into 100 sec bins |
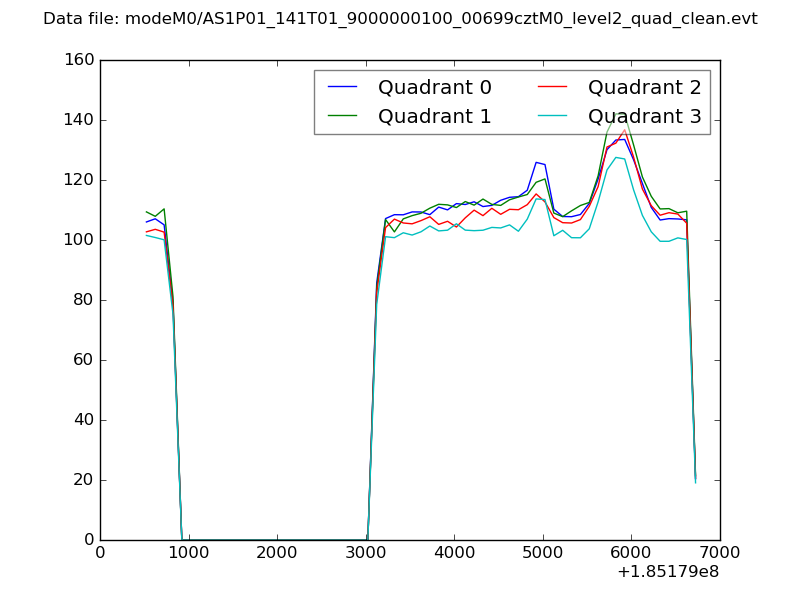 |
|
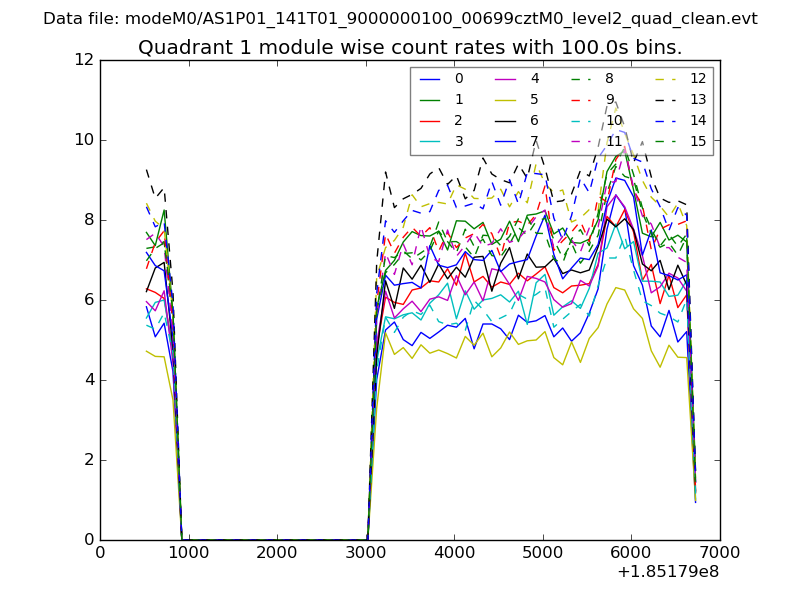
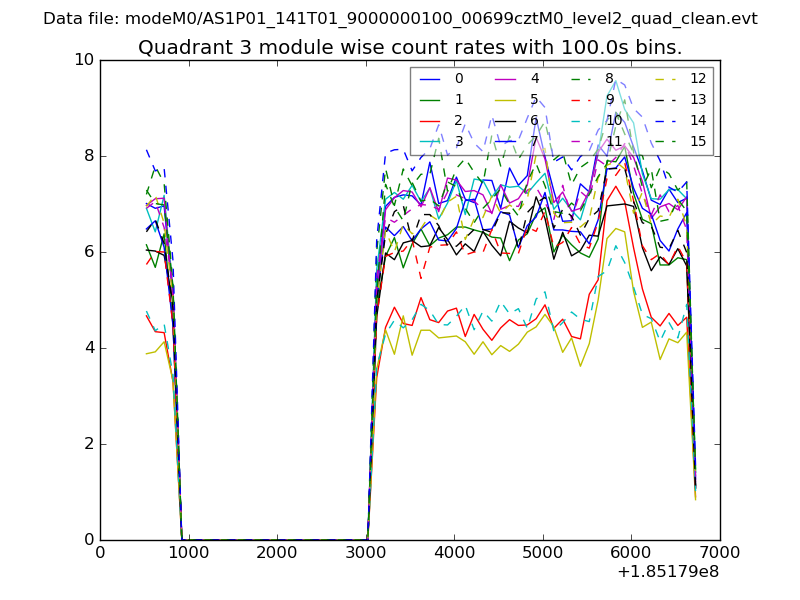
| Module-wise count rates for Quadrant A Data is divided into 100 sec bins |
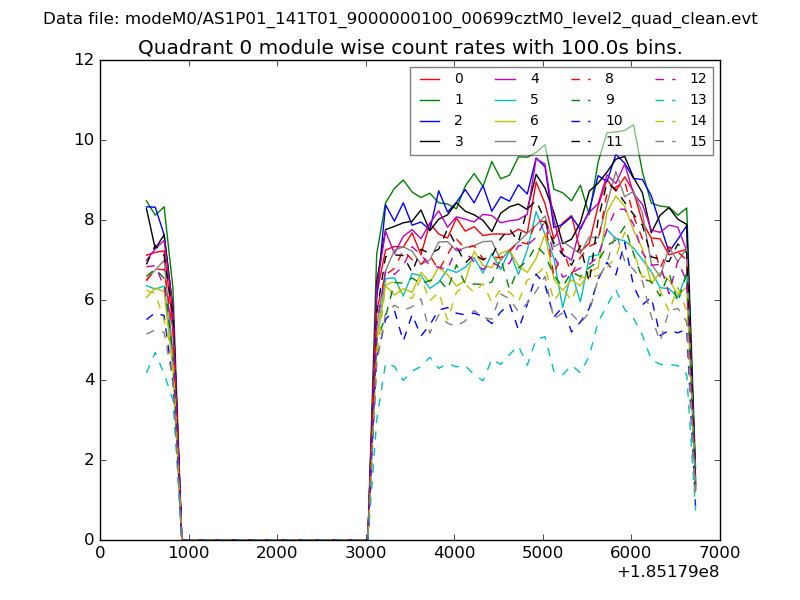 |
 |
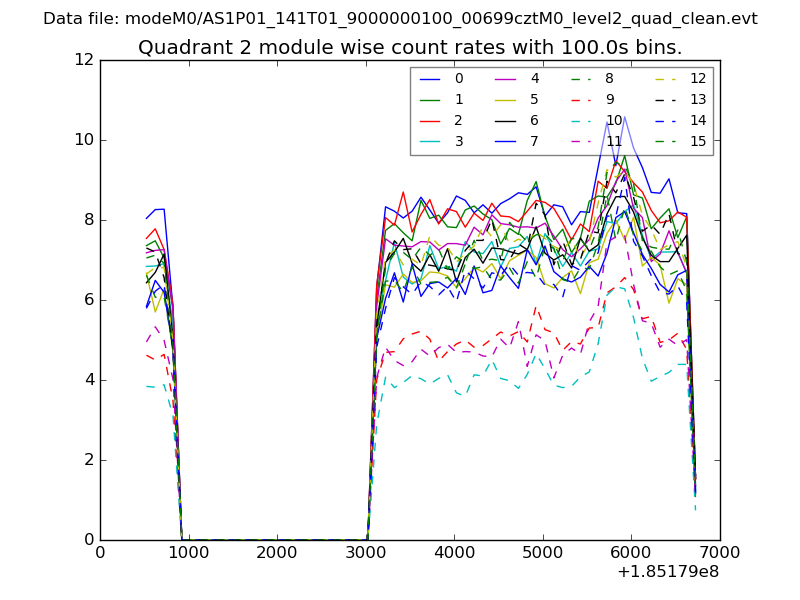
| Module-wise count rates for Quadrant B Data is divided into 100 sec bins |
 |
 |
| Module-wise count rates for Quadrant C Data is divided into 100 sec bins |
 |
 |
| Module-wise count rates for Quadrant D Data is divided into 100 sec bins |
 |
 |
| Parameter | Plot |
|---|---|
| CZT HV Monitor | 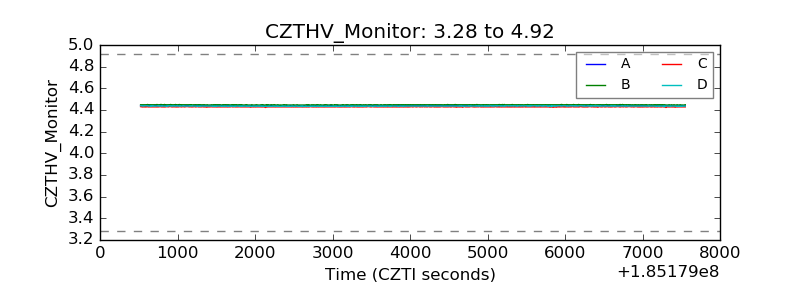 |
| D_VDD | 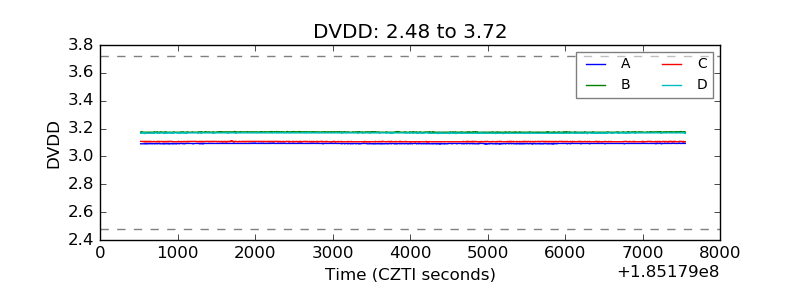 |
| Temperature 1 | 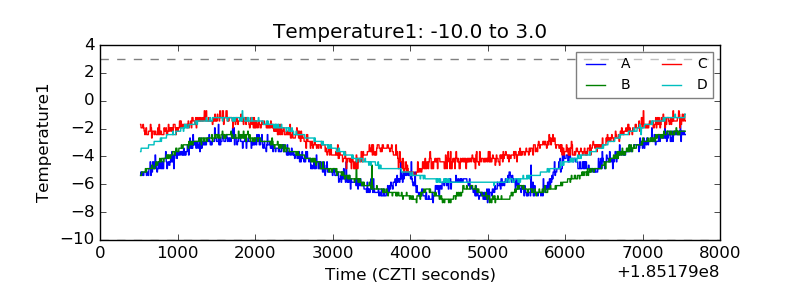 |
| Veto HV Monitor | 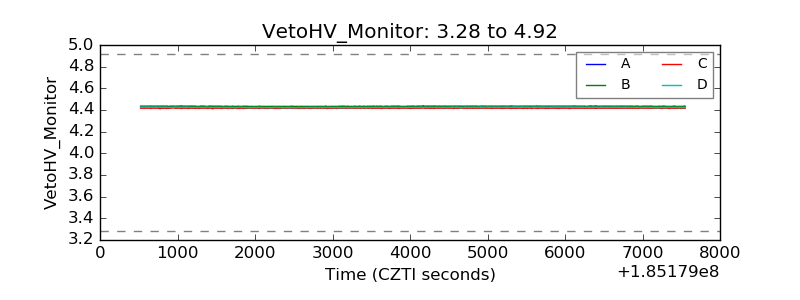 |
| Veto LLD | 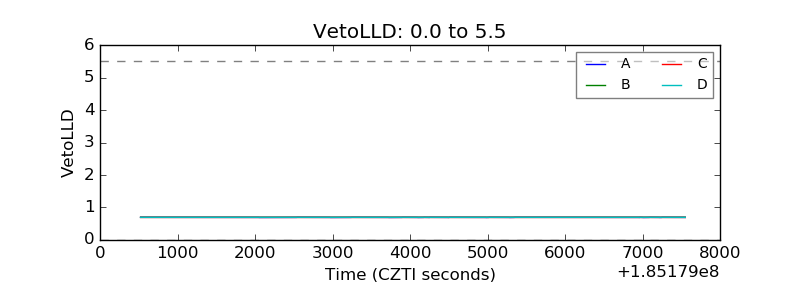 |
| Alpha Counter | 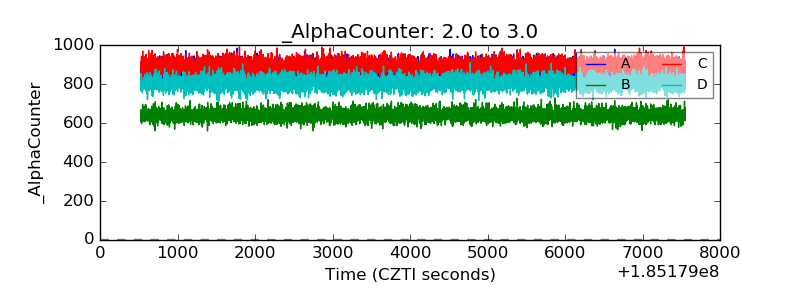 |
| _CPM_Rate | 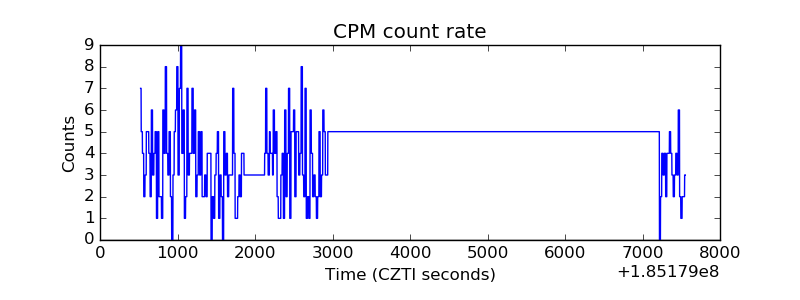 |
| CZT Counter | 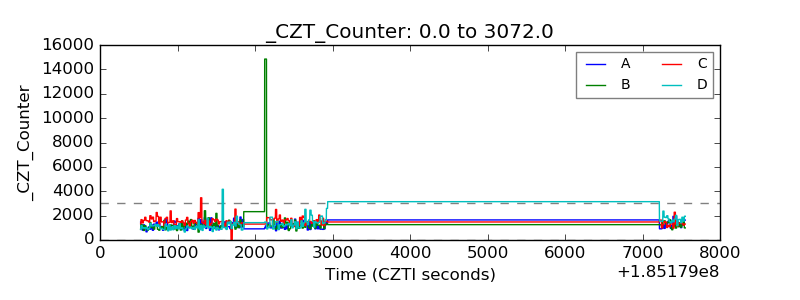 |
| +2.5 Volts monitor |  |
| +5 Volts monitor |  |
| _ROLL_ROT | 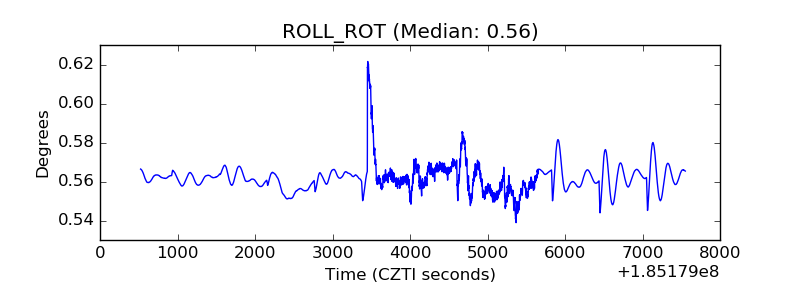 |
| _Roll_DEC | 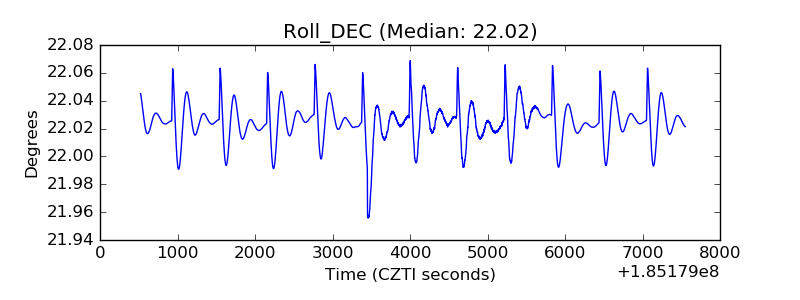 |
| _Roll_RA | 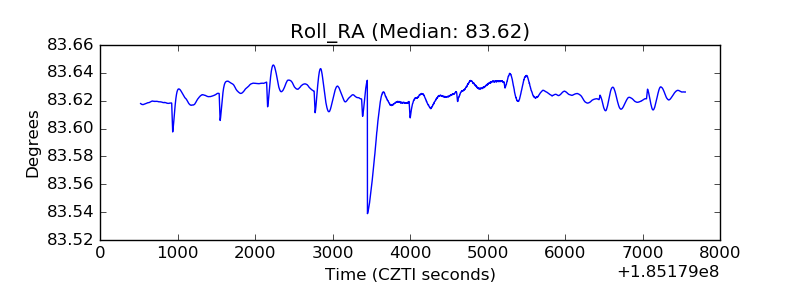 |
| Veto Counter | 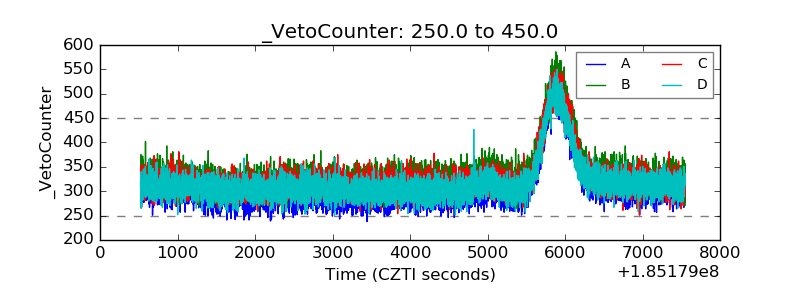 |