| Param | Original file | Final file |
|---|---|---|
| Filename | modeM0/AS1P01_141T01_9000000100_00701cztM0_level2.evt | modeM0/AS1P01_141T01_9000000100_00701cztM0_level2_quad_clean.evt |
| Size (bytes) | 1,258,171,200 | 60,984,000 |
| Size | 1.2 GB | 58.2 MB |
| Events in quadrant A | 8,524,051 | 357,547 |
| Events in quadrant B | 9,127,619 | 354,339 |
| Events in quadrant C | 9,986,442 | 343,462 |
| Events in quadrant D | 10,022,417 | 321,647 |
| Mode M0 | |||
|---|---|---|---|
| Quadrant | BADHDUFLAG | Total packets | Discarded packets |
| A | 0 | 32767 | 2634 |
| B | 0 | 34855 | 2964 |
| C | 0 | 37784 | 3393 |
| D | 0 | 38422 | 3949 |
| Mode SS | |||
|---|---|---|---|
| Quadrant | BADHDUFLAG | Total packets | Discarded packets |
| A | 0 | 150 | 12 |
| B | 0 | 151 | 15 |
| C | 0 | 150 | 16 |
| D | 0 | 150 | 12 |
| Mode M9 | |||
|---|---|---|---|
| Quadrant | BADHDUFLAG | Total packets | Discarded packets |
| A | 0 | 5 | 0 |
| B | 0 | 5 | 0 |
| C | 0 | 5 | 0 |
| D | 0 | 5 | 0 |
| Quadrant | Total seconds | Saturated seconds | Saturation percentage |
|---|---|---|---|
| A | 6772 | 68 | 1.004135% |
| B | 6728 | 105 | 1.560642% |
| C | 6715 | 96 | 1.429635% |
| D | 6692 | 137 | 2.047221% |
Noise dominated data is calculated using 1-second bins in cleaned event files. If a bin has >2000 counts, and if more than 50% of those come from <1% of pixels, then it is considered to be noise-dominated and hence unusable.
| Quadrant | # 1 sec bins | Bins with >0 counts | Bins with >2000 counts | High rate bins dominated by noise | Noise dominated (total time) | Noise dominated (detector-on time) | Marked lightcurve |
|---|---|---|---|---|---|---|---|
| A | 7896 | 6929 | 367 | 367 | 4.65% | 5.30% | 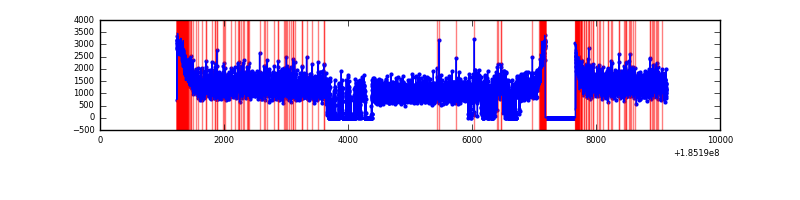 |
| B | 7896 | 6890 | 522 | 522 | 6.61% | 7.58% | 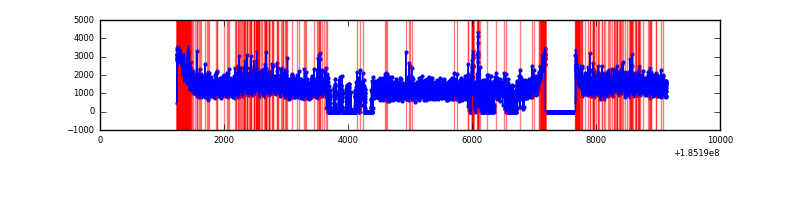 |
| C | 7896 | 6877 | 531 | 531 | 6.72% | 7.72% | 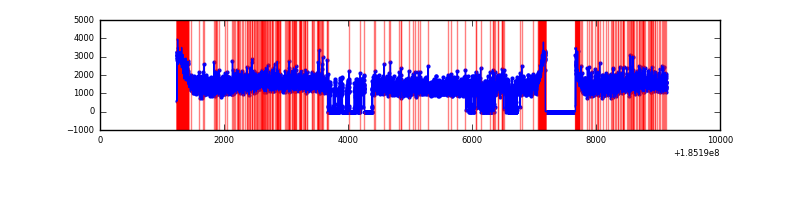 |
| D | 7895 | 6867 | 648 | 648 | 8.21% | 9.44% | 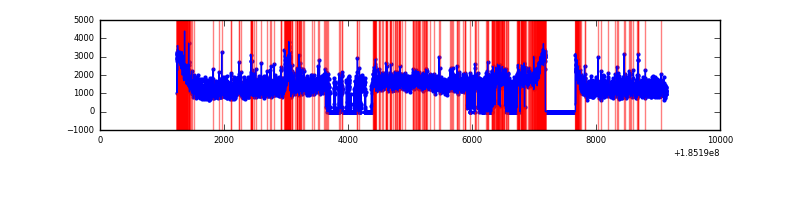 |
Top three noisy pixels from each quadrant. If the there are fewer than three noisy pixels in the level2.evt file, extra rows are filled as -1
| Pixel properties | Quadrant properties | ||||||
|---|---|---|---|---|---|---|---|
| Quadrant | DetID | PixID | Counts | Sigma | Mean | Median | Sigma |
| A | 13 | 8 | 9169 | 12.79 | 2219 | 2239 | 541.7 |
| A | 11 | 79 | 7839 | 10.34 | 2219 | 2239 | 541.7 |
| A | 3 | 111 | 6934 | 8.67 | 2219 | 2239 | 541.7 |
| B | 7 | 221 | 338666 | 624.07 | 2259 | 2276 | 539.0 |
| B | 5 | 247 | 93545 | 169.32 | 2259 | 2276 | 539.0 |
| B | 0 | 220 | 51925 | 92.11 | 2259 | 2276 | 539.0 |
| C | 3 | 95 | 435093 | 742.99 | 2060 | 2135 | 582.7 |
| C | 3 | 31 | 422144 | 720.77 | 2060 | 2135 | 582.7 |
| C | 3 | 15 | 401727 | 685.73 | 2060 | 2135 | 582.7 |
| D | 0 | 25 | 2079780 | 3297.18 | 2016 | 2085 | 630.1 |
| D | 12 | 233 | 203915 | 320.29 | 2016 | 2085 | 630.1 |
| D | 1 | 4 | 73115 | 112.72 | 2016 | 2085 | 630.1 |
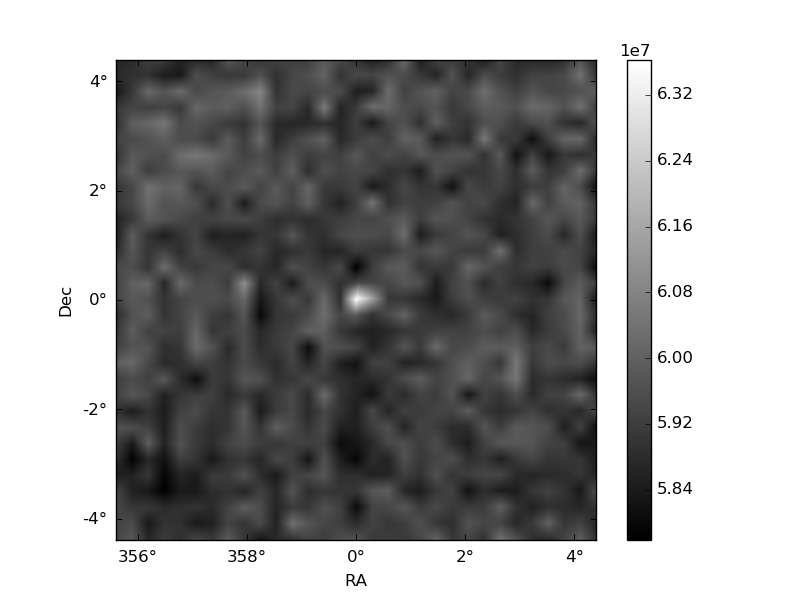
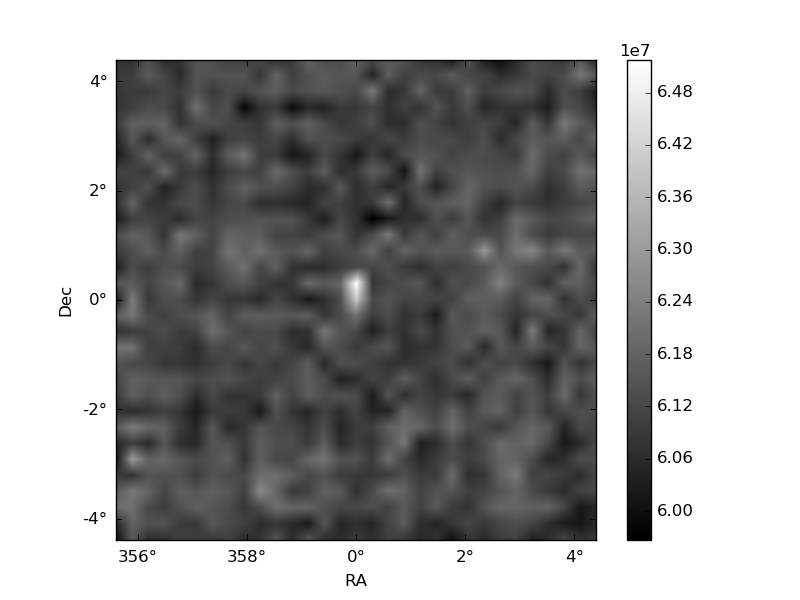
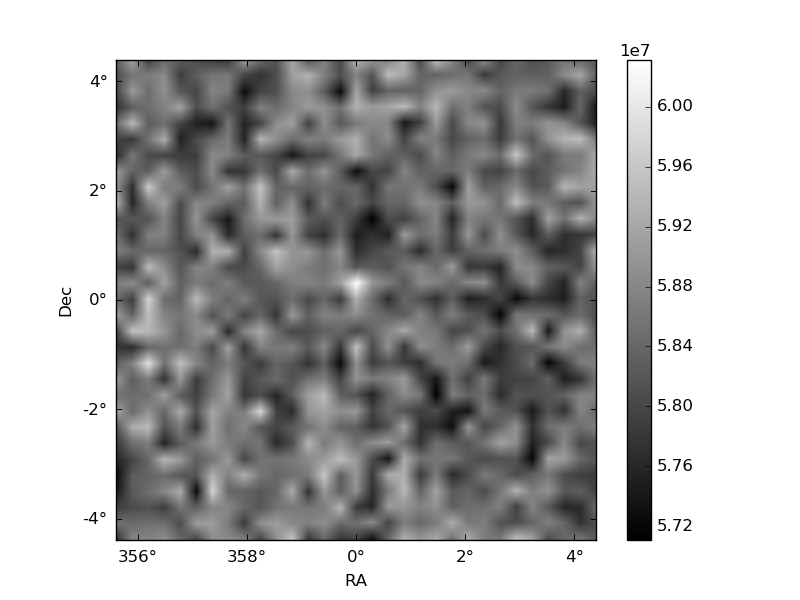
Histogram calculated using DETX and DETY for each event in the final _common_clean file
| Quadrant A | 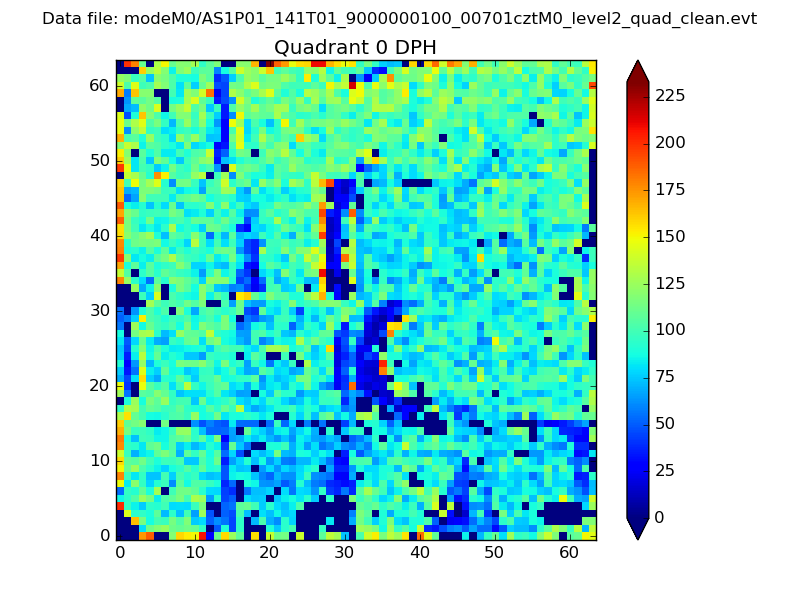 |
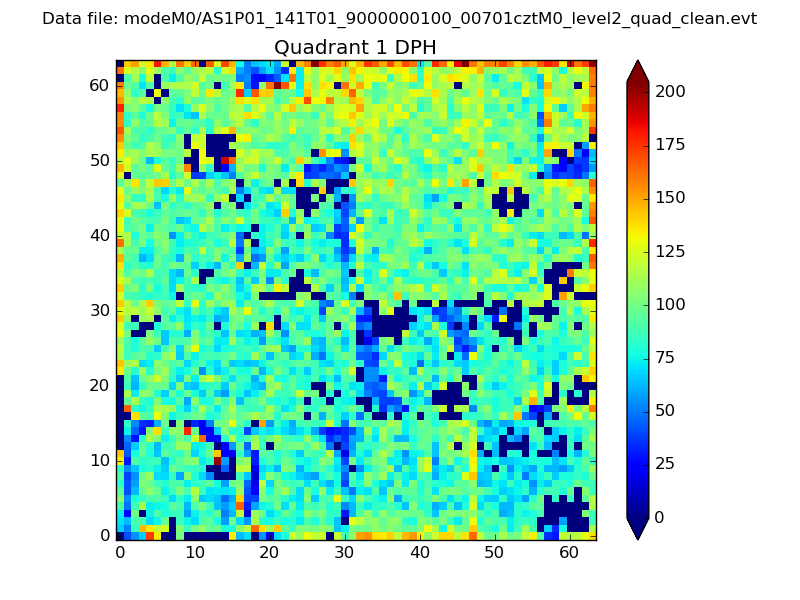 |
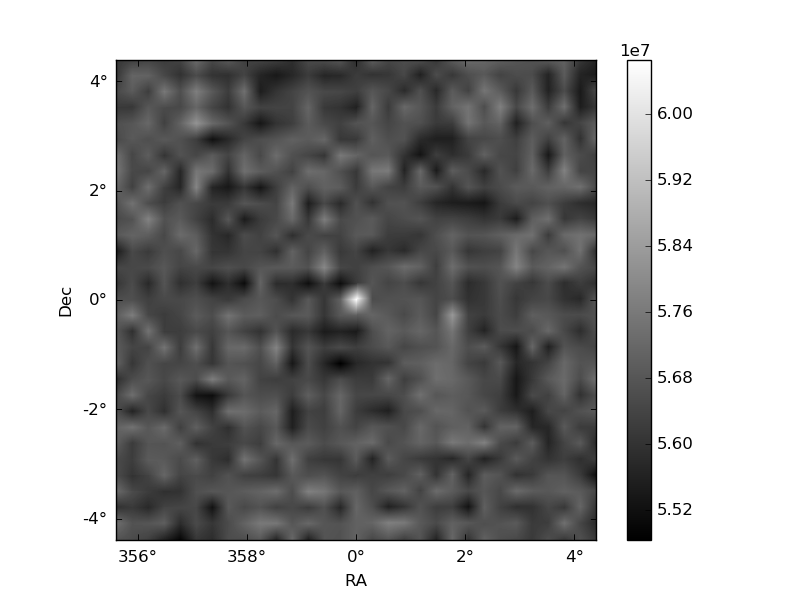
Quadrant B |
|---|---|---|---|
| Quadrant D | 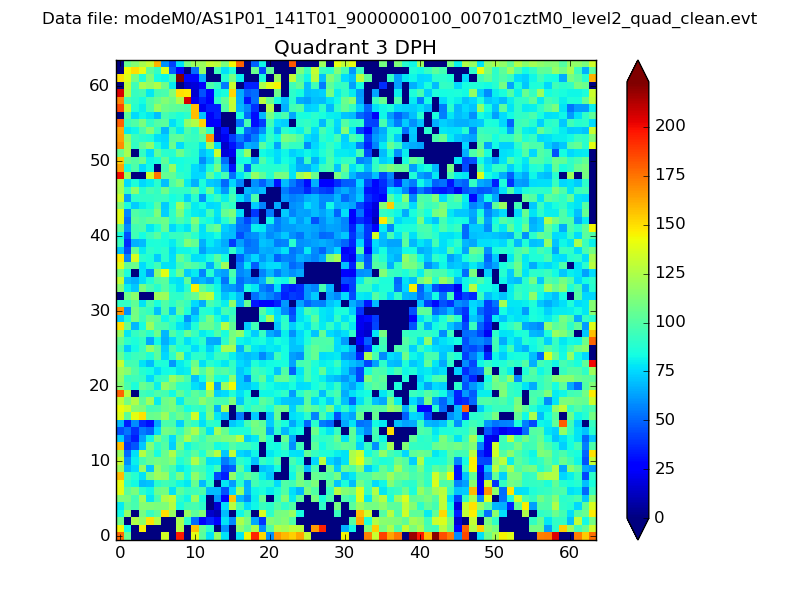 |
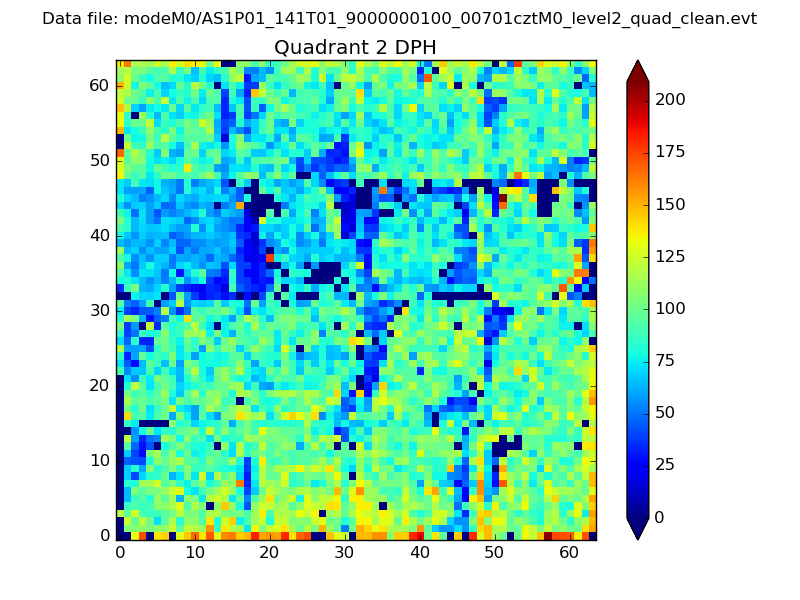 |
Quadrant C |
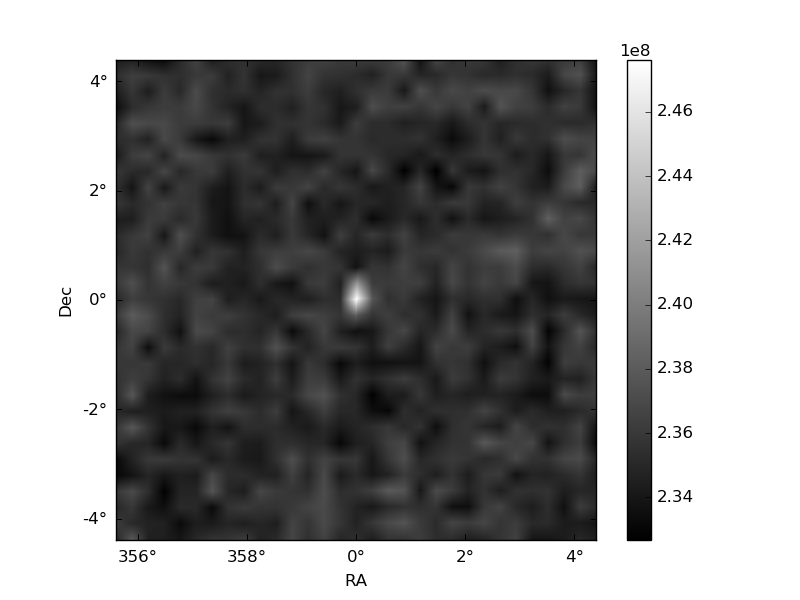
| Plot type | Count rate plots | Images |
|---|---|---|
| Comparison with Poisson distribution Blue bars denote a histogram of data divided into 1 sec bins. Red curve is a Poisson curve with rate = median count rate of data. |
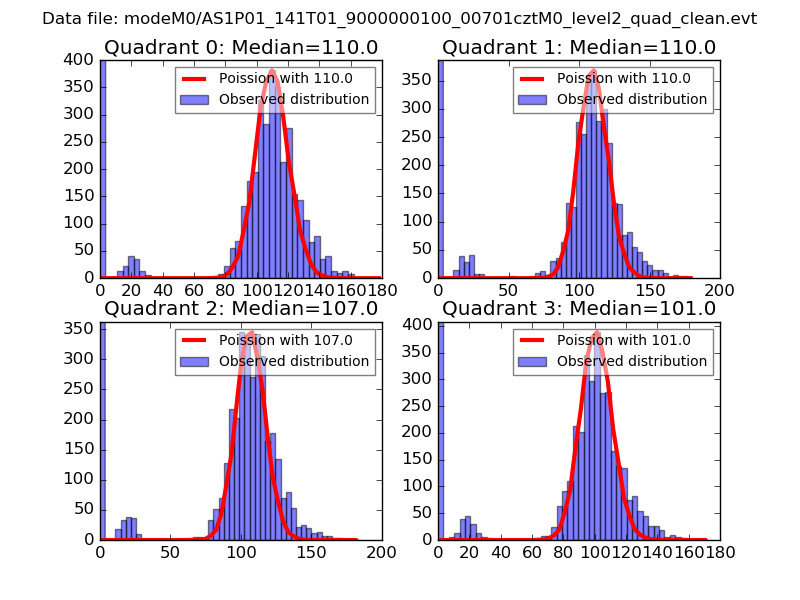 |
 |
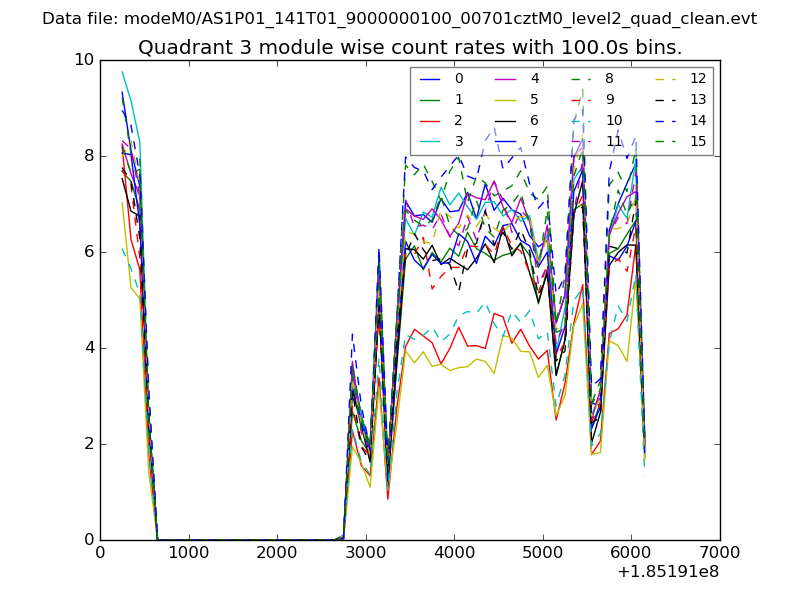
| Quadrant-wise count rates Data is divided into 100 sec bins |
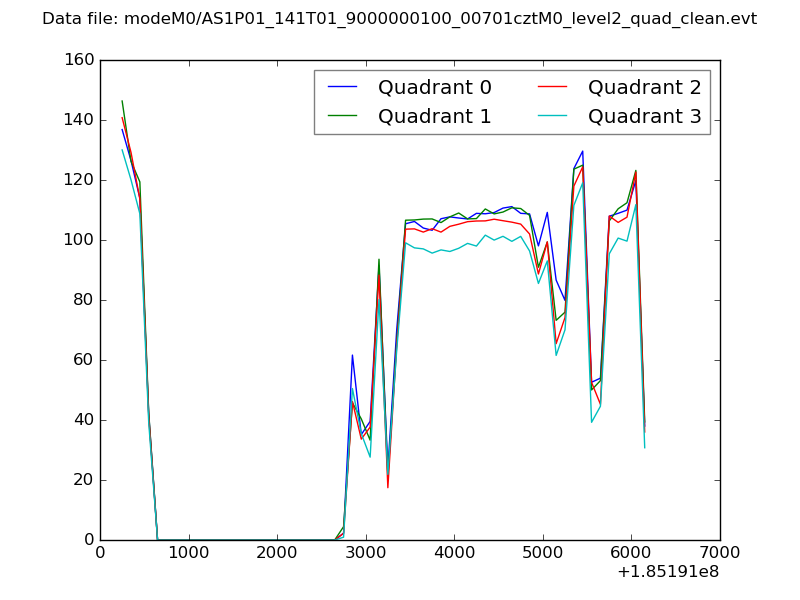 |
|
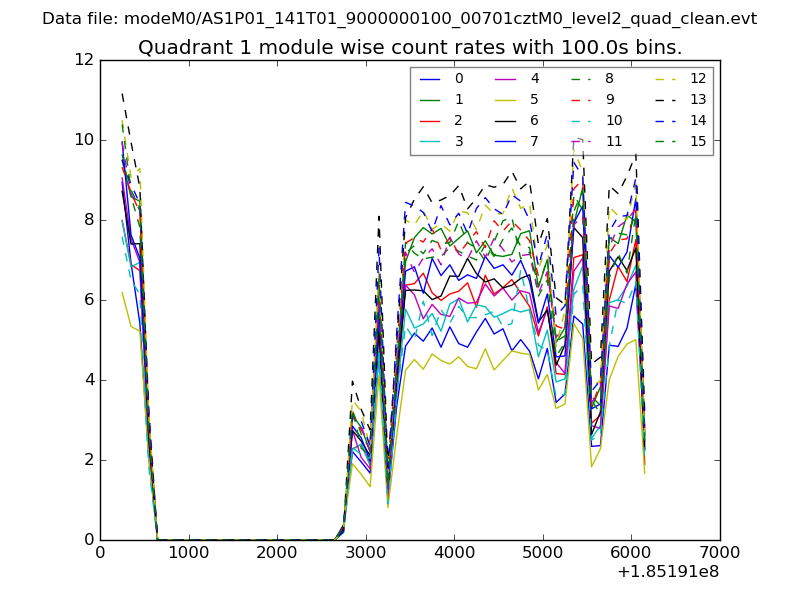
| Module-wise count rates for Quadrant A Data is divided into 100 sec bins |
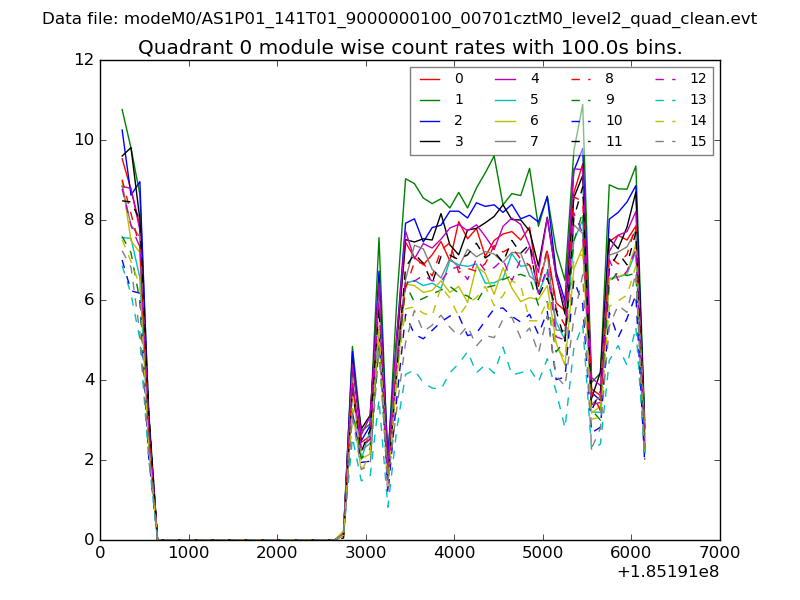 |
 |
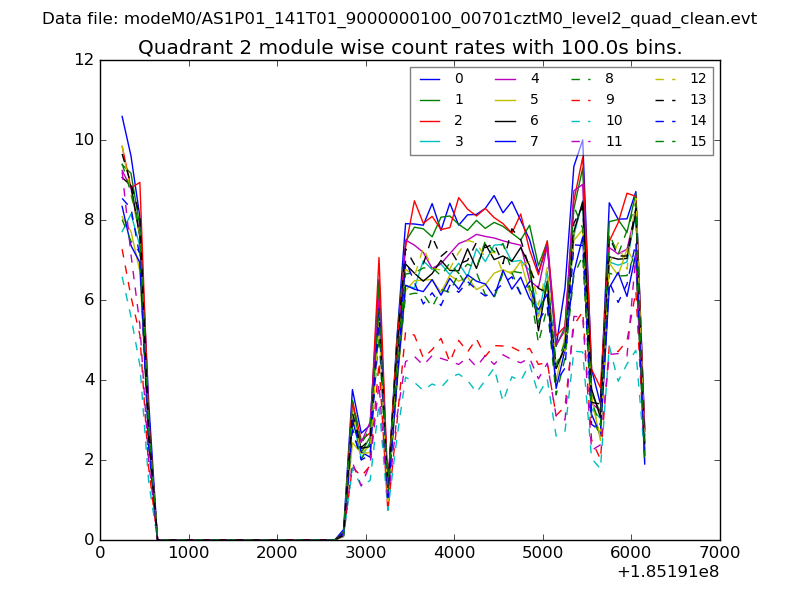
| Module-wise count rates for Quadrant B Data is divided into 100 sec bins |
 |
 |
| Module-wise count rates for Quadrant C Data is divided into 100 sec bins |
 |
 |
| Module-wise count rates for Quadrant D Data is divided into 100 sec bins |
 |
 |
| Parameter | Plot |
|---|---|
| CZT HV Monitor | 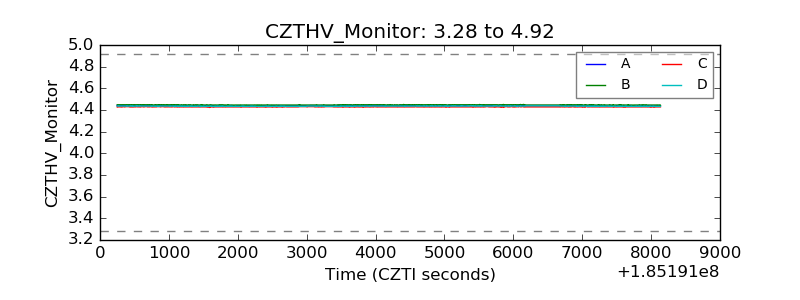 |
| D_VDD | 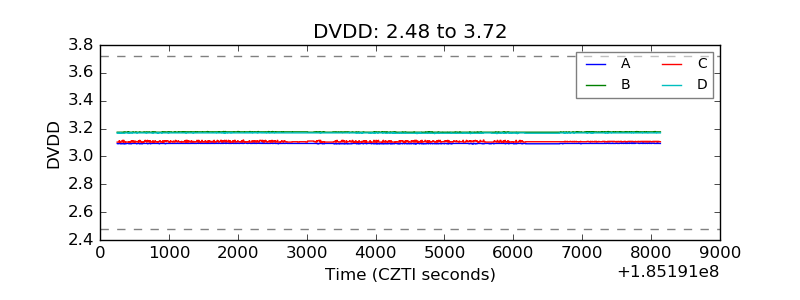 |
| Temperature 1 | 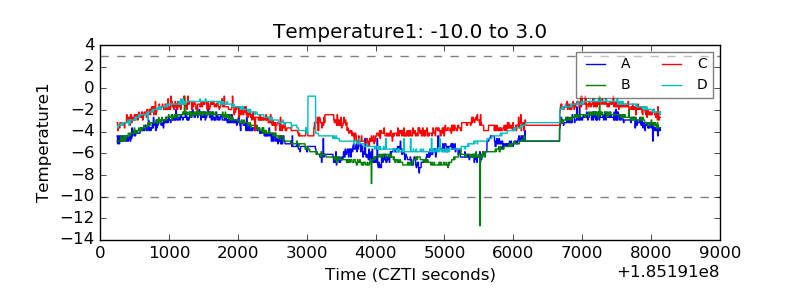 |
| Veto HV Monitor | 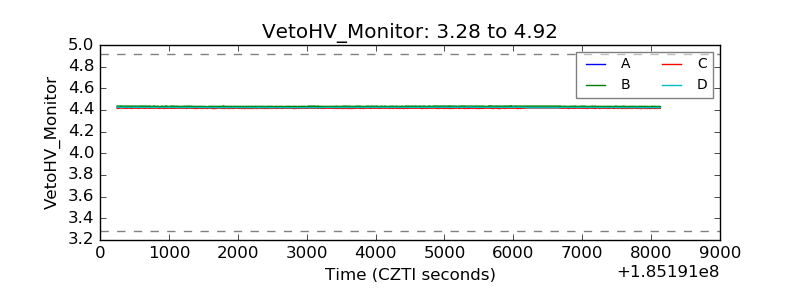 |
| Veto LLD | 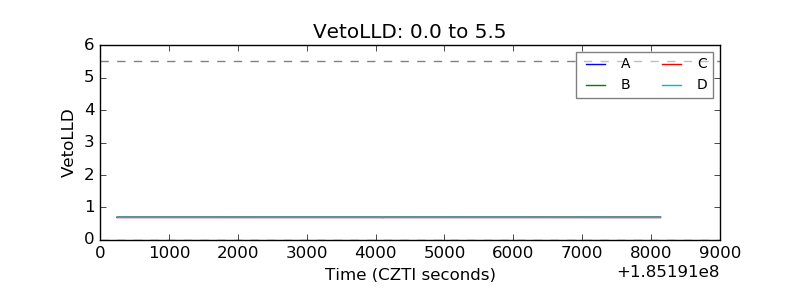 |
| Alpha Counter | 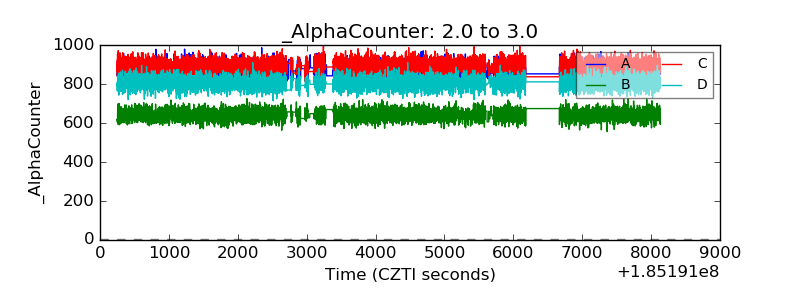 |
| _CPM_Rate | 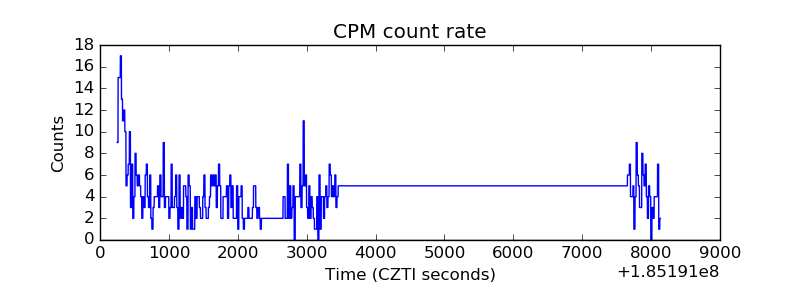 |
| CZT Counter | 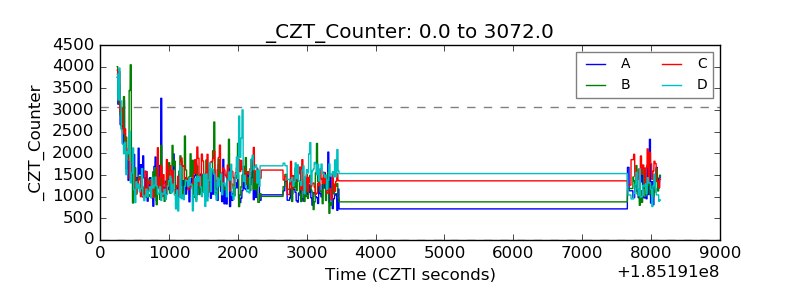 |
| +2.5 Volts monitor |  |
| +5 Volts monitor |  |
| _ROLL_ROT | 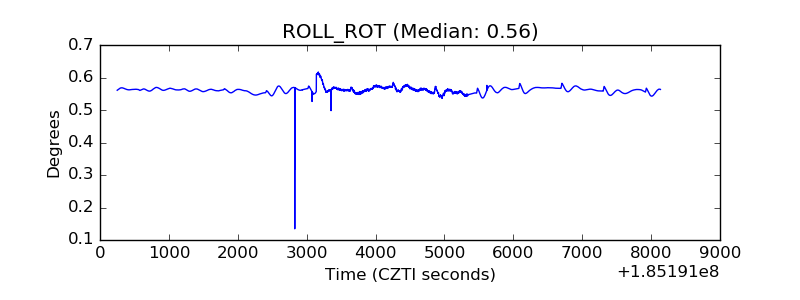 |
| _Roll_DEC | 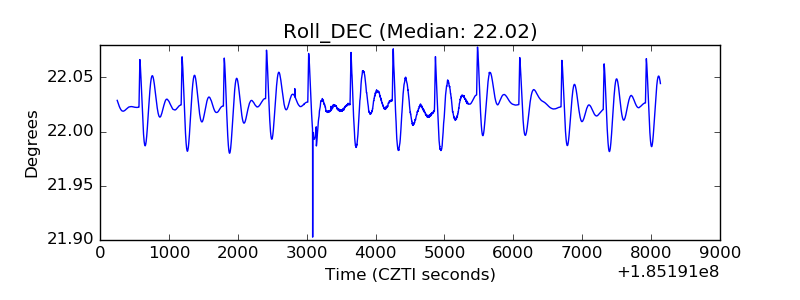 |
| _Roll_RA | 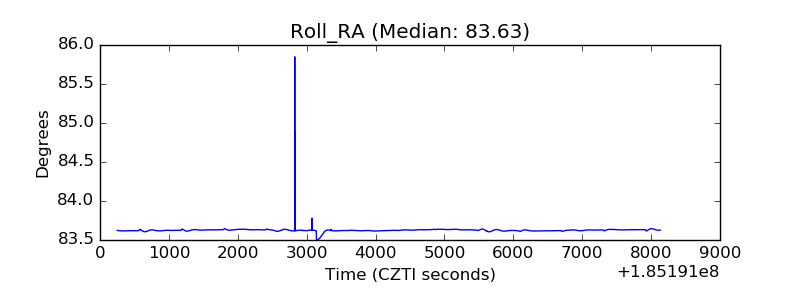 |
| Veto Counter | 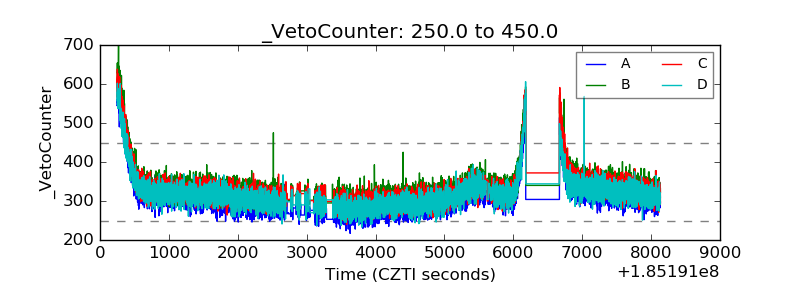 |