| Param | Original file | Final file |
|---|---|---|
| Filename | modeM0/AS1P01_141T01_9000000100_00702cztM0_level2.evt | modeM0/AS1P01_141T01_9000000100_00702cztM0_level2_quad_clean.evt |
| Size (bytes) | 692,628,480 | 36,440,640 |
| Size | 660.5 MB | 34.8 MB |
| Events in quadrant A | 5,082,116 | 207,111 |
| Events in quadrant B | 5,017,544 | 210,444 |
| Events in quadrant C | 5,505,286 | 206,002 |
| Events in quadrant D | 5,105,620 | 197,001 |
| Mode M0 | |||
|---|---|---|---|
| Quadrant | BADHDUFLAG | Total packets | Discarded packets |
| A | 0 | 17935 | 1 |
| B | 0 | 17736 | 1 |
| C | 0 | 19185 | 1 |
| D | 0 | 18013 | 1 |
| Mode SS | |||
|---|---|---|---|
| Quadrant | BADHDUFLAG | Total packets | Discarded packets |
| A | 0 | 80 | 0 |
| B | 0 | 80 | 0 |
| C | 0 | 80 | 0 |
| D | 0 | 80 | 0 |
| Mode M9 | |||
|---|---|---|---|
| Quadrant | BADHDUFLAG | Total packets | Discarded packets |
| A | 0 | 2 | 0 |
| B | 0 | 2 | 0 |
| C | 0 | 2 | 0 |
| D | 0 | 2 | 0 |
| Quadrant | Total seconds | Saturated seconds | Saturation percentage |
|---|---|---|---|
| A | 3999 | 8 | 0.200050% |
| B | 3999 | 3 | 0.075019% |
| C | 3999 | 4 | 0.100025% |
| D | 3999 | 7 | 0.175044% |
Noise dominated data is calculated using 1-second bins in cleaned event files. If a bin has >2000 counts, and if more than 50% of those come from <1% of pixels, then it is considered to be noise-dominated and hence unusable.
| Quadrant | # 1 sec bins | Bins with >0 counts | Bins with >2000 counts | High rate bins dominated by noise | Noise dominated (total time) | Noise dominated (detector-on time) | Marked lightcurve |
|---|---|---|---|---|---|---|---|
| A | 3999 | 3999 | 216 | 216 | 5.40% | 5.40% | 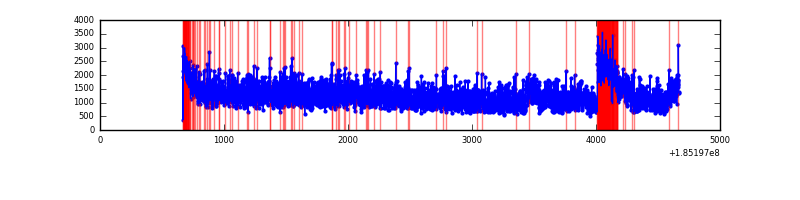 |
| B | 3999 | 3999 | 152 | 152 | 3.80% | 3.80% | 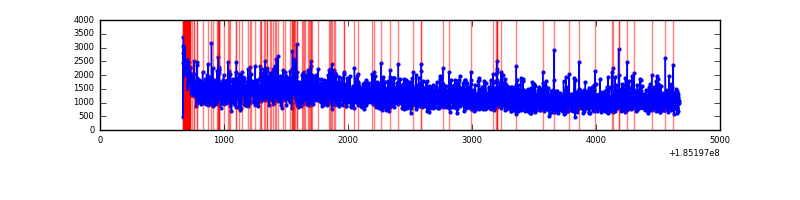 |
| C | 3999 | 3999 | 173 | 173 | 4.33% | 4.33% | 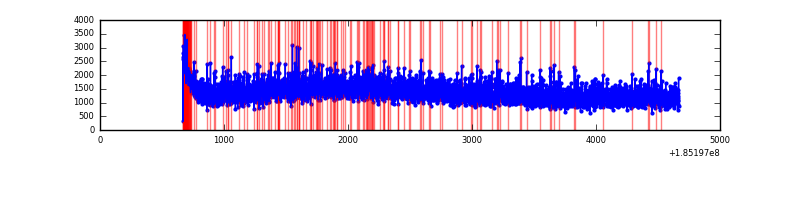 |
| D | 3999 | 3999 | 111 | 111 | 2.78% | 2.78% | 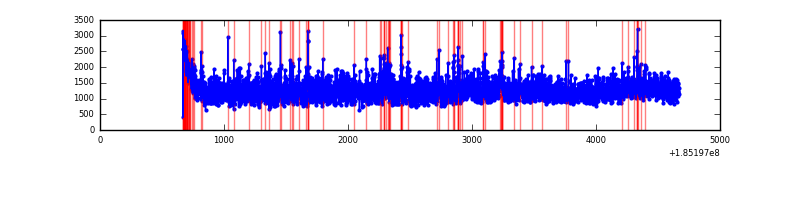 |
Top three noisy pixels from each quadrant. If the there are fewer than three noisy pixels in the level2.evt file, extra rows are filled as -1
| Pixel properties | Quadrant properties | ||||||
|---|---|---|---|---|---|---|---|
| Quadrant | DetID | PixID | Counts | Sigma | Mean | Median | Sigma |
| A | 10 | 216 | 431758 | 1459.9 | 1209 | 1219 | 294.9 |
| A | 13 | 8 | 4749 | 11.97 | 1209 | 1219 | 294.9 |
| A | 15 | 171 | 4258 | 10.3 | 1209 | 1219 | 294.9 |
| B | 7 | 221 | 89226 | 295.17 | 1264 | 1272 | 298.0 |
| B | 5 | 247 | 53355 | 174.79 | 1264 | 1272 | 298.0 |
| B | 0 | 220 | 27596 | 88.34 | 1264 | 1272 | 298.0 |
| C | 3 | 31 | 211307 | 642.25 | 1167 | 1213 | 327.1 |
| C | 3 | 95 | 210463 | 639.67 | 1167 | 1213 | 327.1 |
| C | 3 | 15 | 163944 | 497.46 | 1167 | 1213 | 327.1 |
| D | 0 | 25 | 769745 | 2234.51 | 1111 | 1149 | 344.0 |
| D | 9 | 52 | 64942 | 185.46 | 1111 | 1149 | 344.0 |
| D | 1 | 4 | 46514 | 131.89 | 1111 | 1149 | 344.0 |
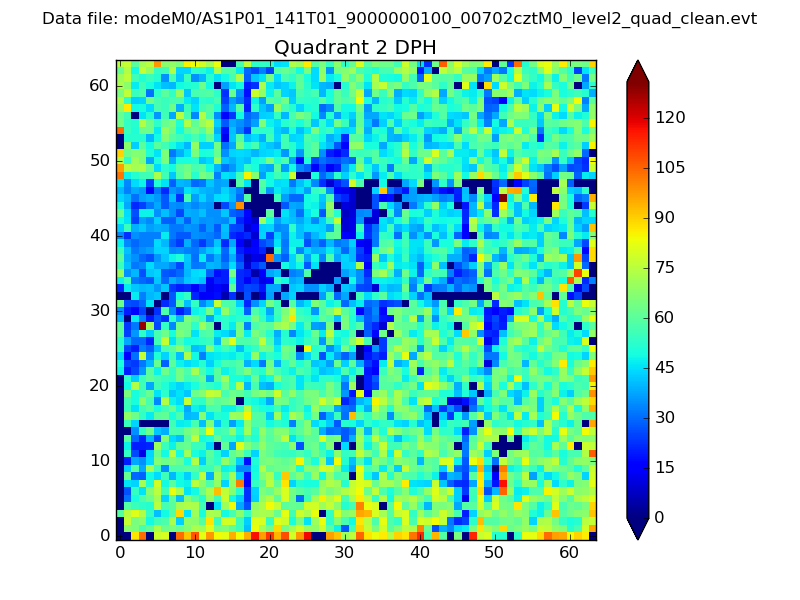
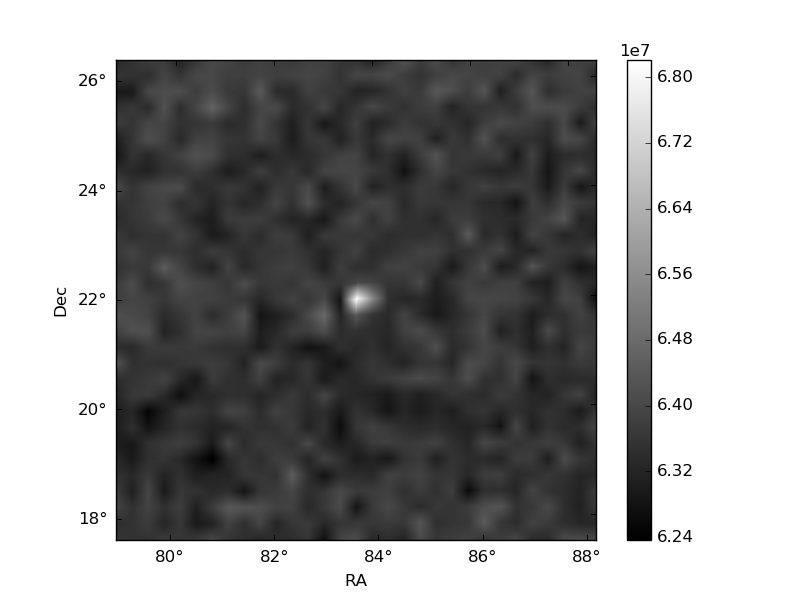
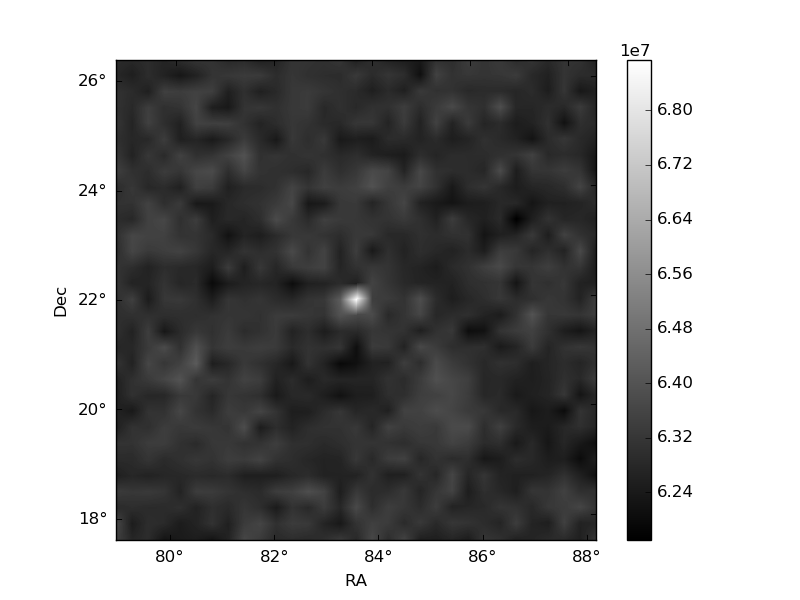
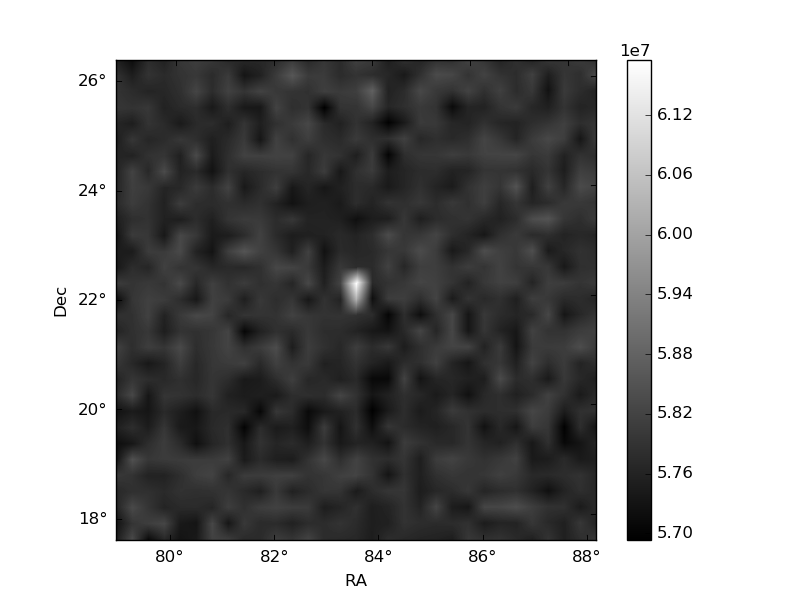
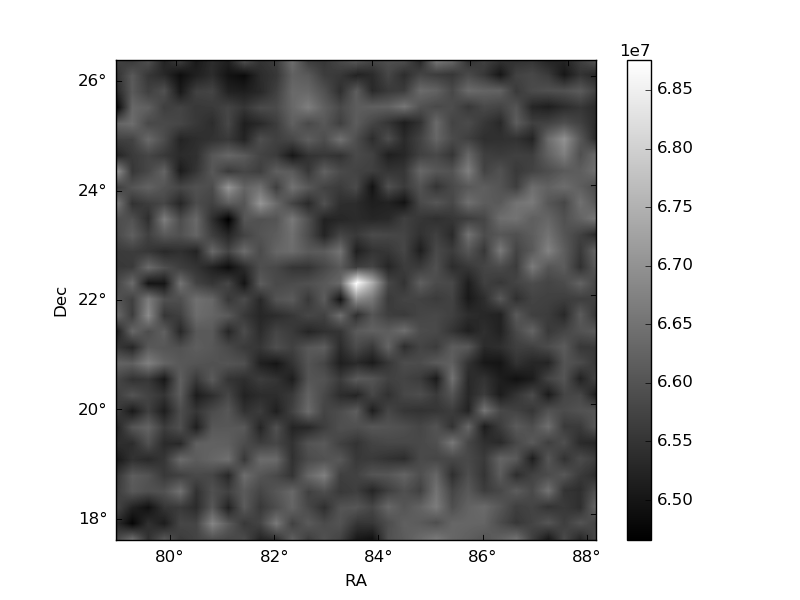
Histogram calculated using DETX and DETY for each event in the final _common_clean file
| Quadrant A | 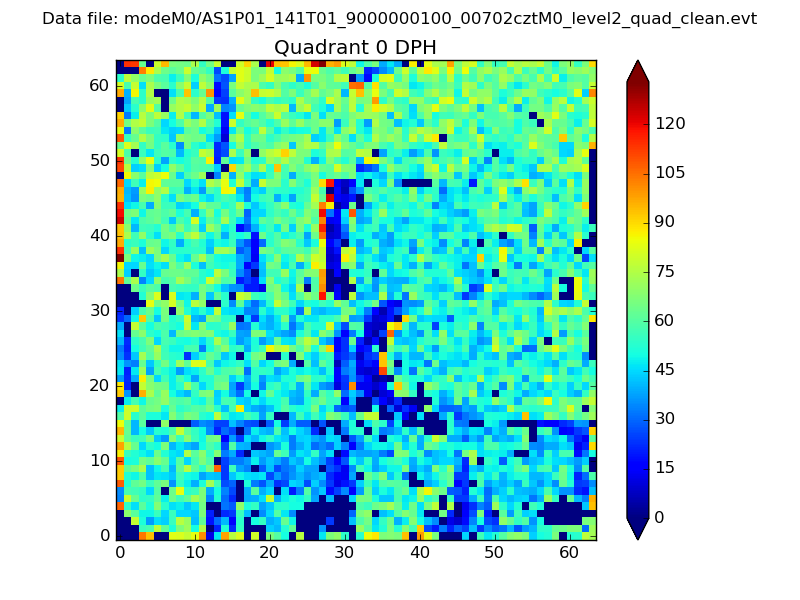 |
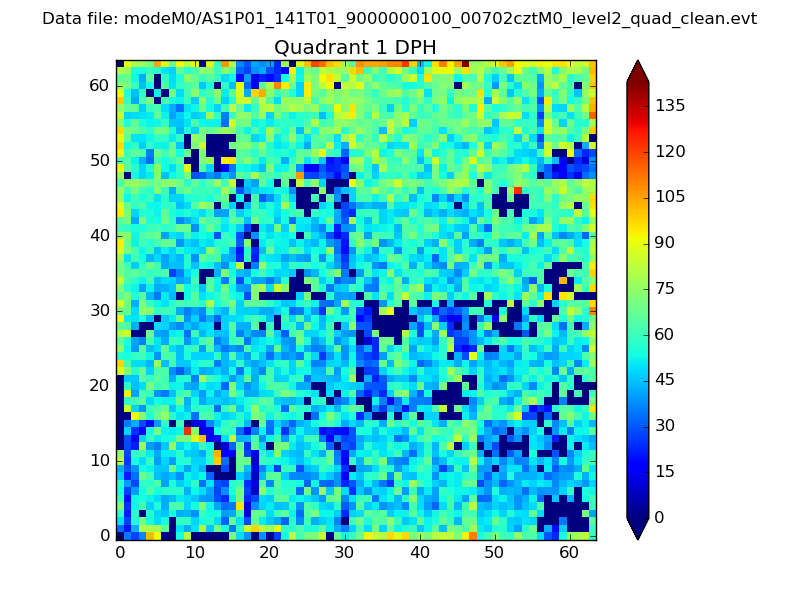 |
Quadrant B |
|---|---|---|---|
| Quadrant D | 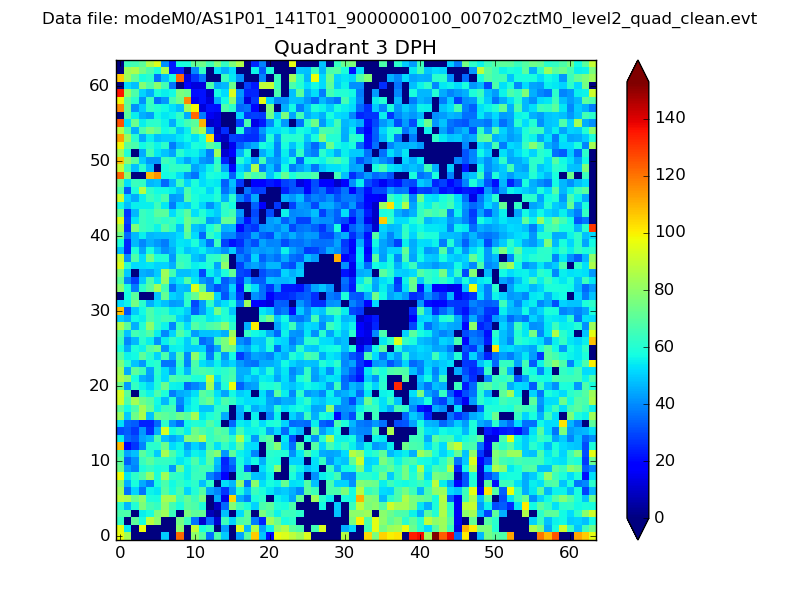 |
 |
Quadrant C |
| Plot type | Count rate plots | Images |
|---|---|---|
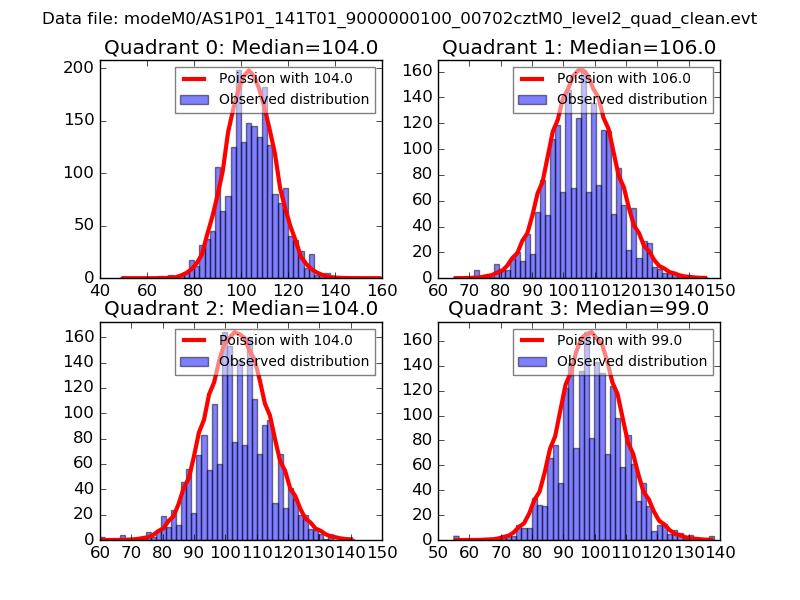
| Comparison with Poisson distribution Blue bars denote a histogram of data divided into 1 sec bins. Red curve is a Poisson curve with rate = median count rate of data. |
 |
 |
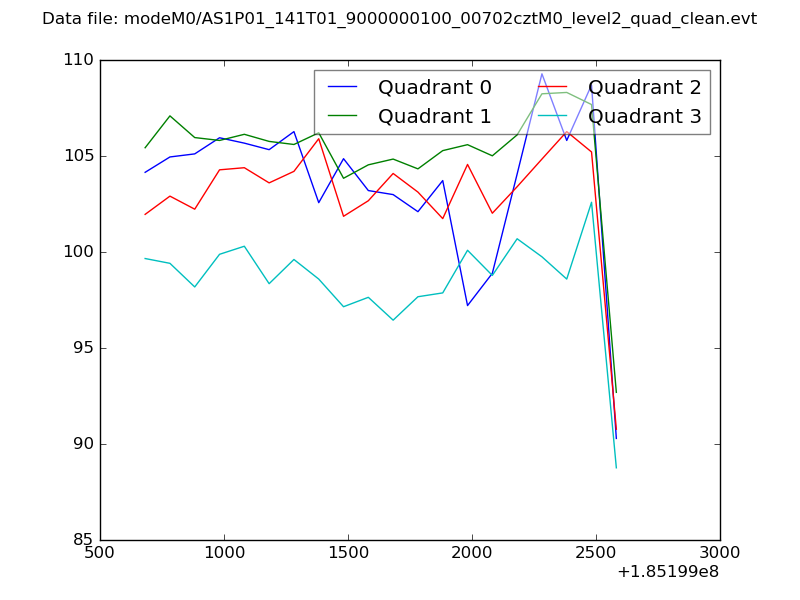
| Quadrant-wise count rates Data is divided into 100 sec bins |
 |
|
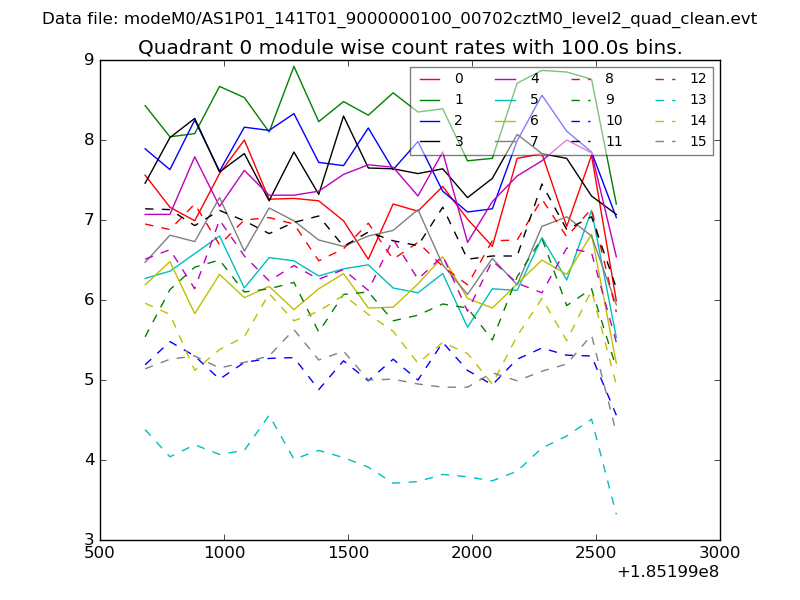
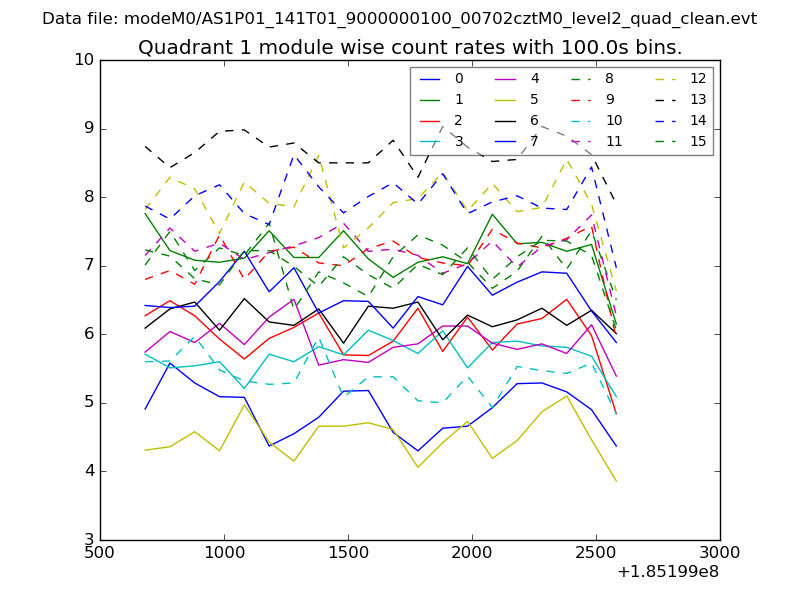
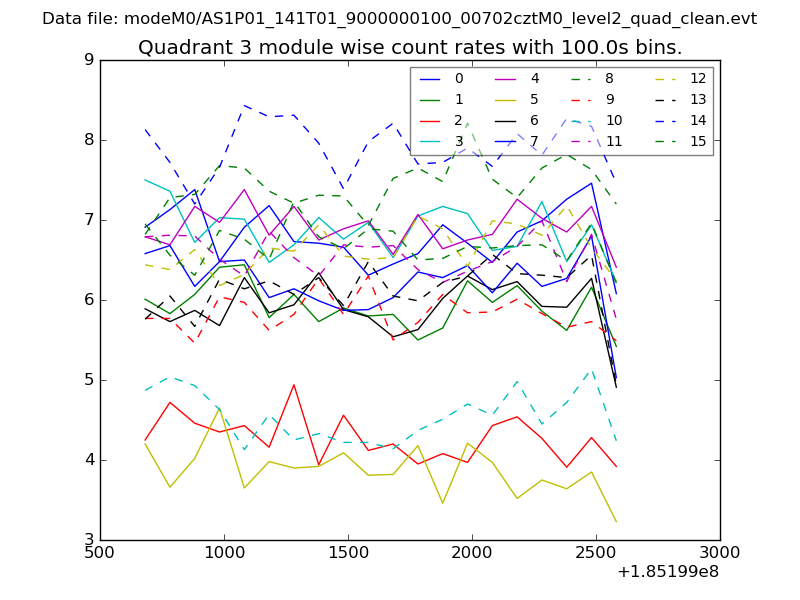
| Module-wise count rates for Quadrant A Data is divided into 100 sec bins |
 |
 |
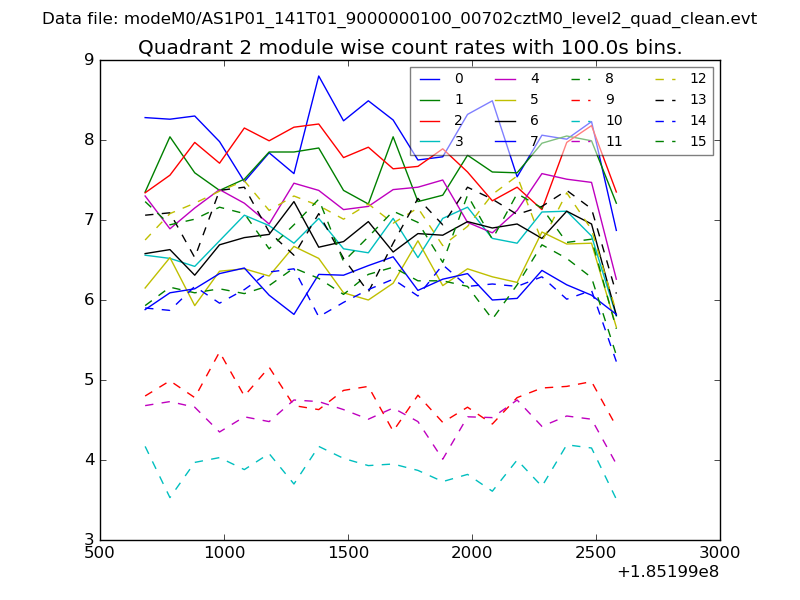
| Module-wise count rates for Quadrant B Data is divided into 100 sec bins |
 |
 |
| Module-wise count rates for Quadrant C Data is divided into 100 sec bins |
 |
 |
| Module-wise count rates for Quadrant D Data is divided into 100 sec bins |
 |
 |
| Parameter | Plot |
|---|---|
| CZT HV Monitor | 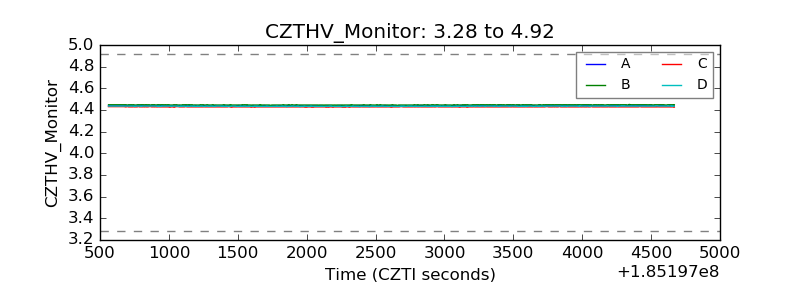 |
| D_VDD | 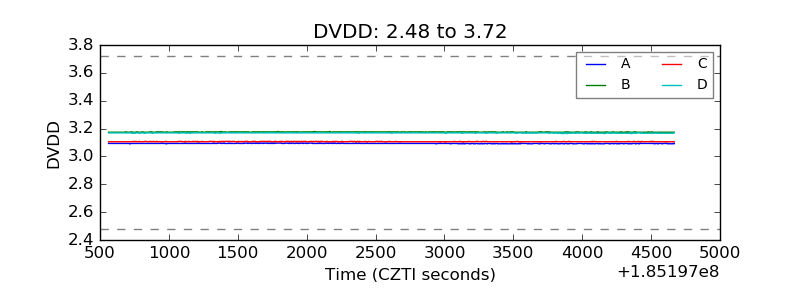 |
| Temperature 1 | 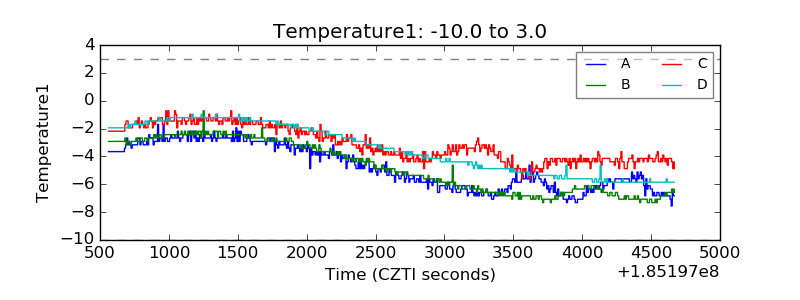 |
| Veto HV Monitor | 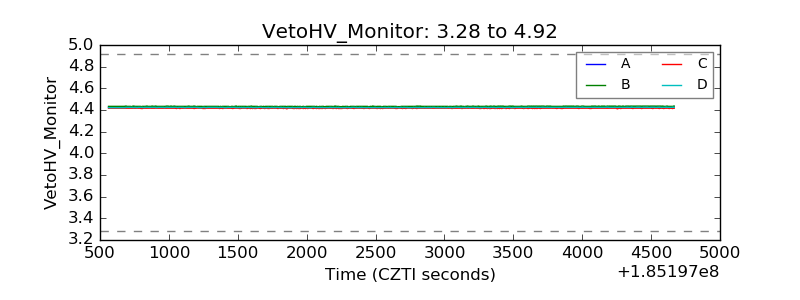 |
| Veto LLD | 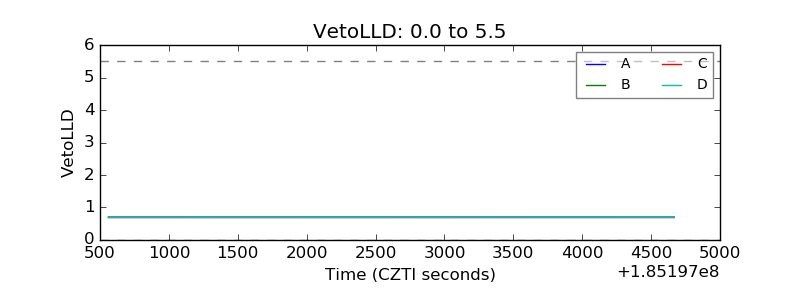 |
| Alpha Counter | 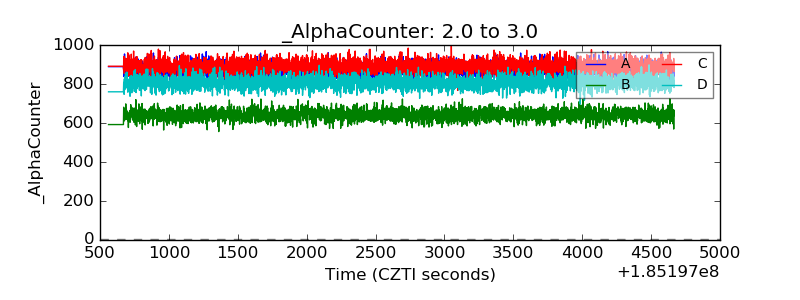 |
| _CPM_Rate | 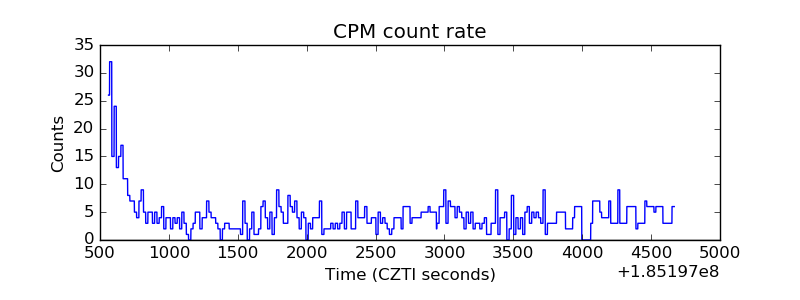 |
| CZT Counter | 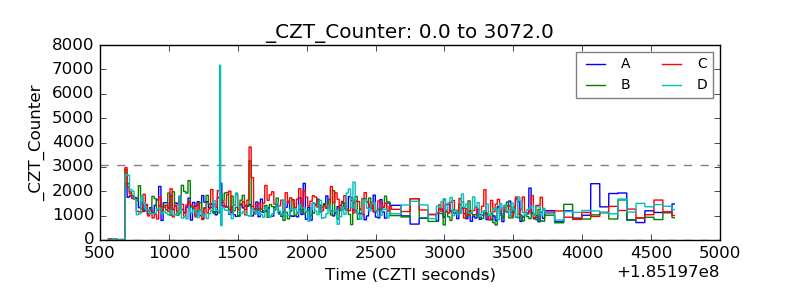 |
| +2.5 Volts monitor | 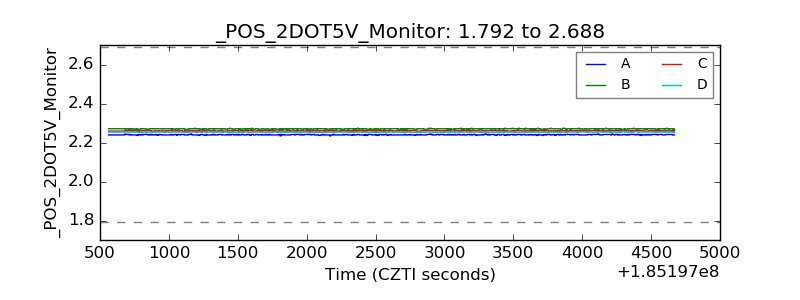 |
| +5 Volts monitor |  |
| _ROLL_ROT | 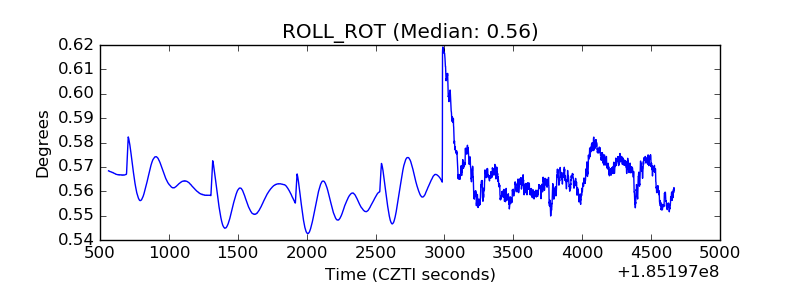 |
| _Roll_DEC | 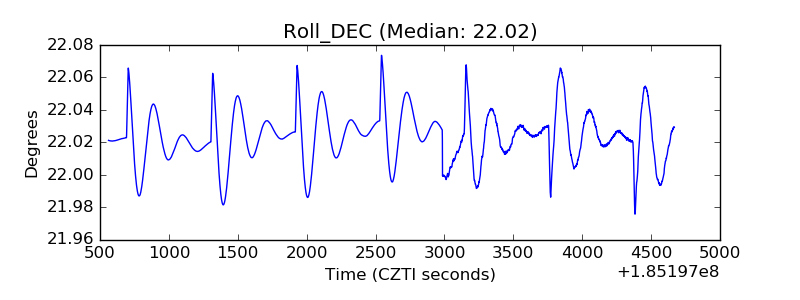 |
| _Roll_RA | 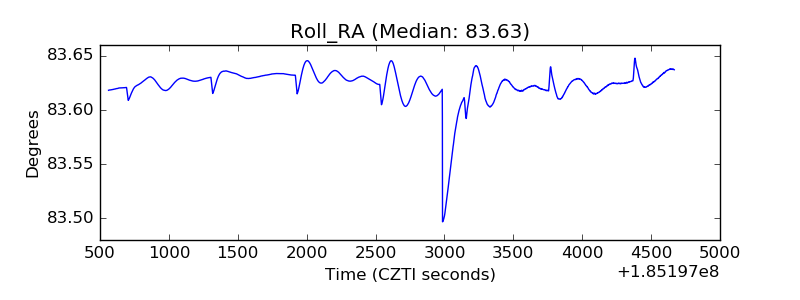 |
| Veto Counter | 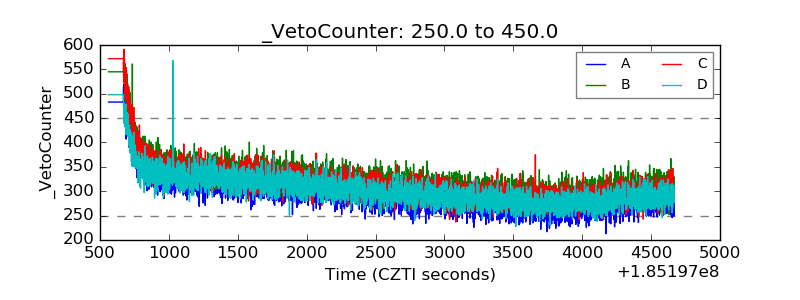 |