| Param | Original file | Final file |
|---|---|---|
| Filename | modeM0/AS1P01_141T01_9000000104cztM0_level2.fits | modeM0/AS1P01_141T01_9000000104cztM0_level2_quad_clean.evt |
| Size (bytes) | 289,681,920 | 336,778,560 |
| Size | 276.3 MB | 321.2 MB |
| Events in quadrant A | 1,690,710 | 2,049,275 |
| Events in quadrant B | 1,681,204 | 2,078,925 |
| Events in quadrant C | 1,650,614 | 1,965,869 |
| Events in quadrant D | 1,424,126 | 1,779,285 |
| Mode M9 | |||
|---|---|---|---|
| Quadrant | BADHDUFLAG | Total packets | Discarded packets |
| A | 0 | 77 | 0 |
| B | 0 | 77 | 0 |
| C | 0 | 77 | 0 |
| D | 0 | 77 | 0 |
| Mode M0 | |||
|---|---|---|---|
| Quadrant | BADHDUFLAG | Total packets | Discarded packets |
| A | 0 | 145214 | 0 |
| B | 0 | 157750 | 0 |
| C | 0 | 159354 | 0 |
| D | 0 | 145668 | 0 |
| Mode SS | |||
|---|---|---|---|
| Quadrant | BADHDUFLAG | Total packets | Discarded packets |
| A | 0 | 694 | 0 |
| B | 0 | 694 | 0 |
| C | 0 | 694 | 0 |
| D | 0 | 694 | 0 |
| Quadrant | Total seconds | Saturated seconds | Saturation percentage |
|---|---|---|---|
| A | 33849 | 277 | 0.818340% |
| B | 33849 | 245 | 0.723803% |
| C | 33849 | 106 | 0.313155% |
| D | 33848 | 416 | 1.229024% |
Noise dominated data is calculated using 1-second bins in cleaned event files. If a bin has >2000 counts, and if more than 50% of those come from <1% of pixels, then it is considered to be noise-dominated and hence unusable.
| Quadrant | # 1 sec bins | Bins with >0 counts | Bins with >2000 counts | High rate bins dominated by noise | Noise dominated (total time) | Noise dominated (detector-on time) | Marked lightcurve |
|---|---|---|---|---|---|---|---|
| A | 41639 | 33848 | 0 | 0 | 0.00% | 0.00% |  |
| B | 41639 | 33849 | 0 | 0 | 0.00% | 0.00% |  |
| C | 41639 | 33849 | 0 | 0 | 0.00% | 0.00% |  |
| D | 41639 | 33849 | 0 | 0 | 0.00% | 0.00% |  |
Top three noisy pixels from each quadrant. If the there are fewer than three noisy pixels in the level2.evt file, extra rows are filled as -1
| Pixel properties | Quadrant properties | ||||||
|---|---|---|---|---|---|---|---|
| Quadrant | DetID | PixID | Counts | Sigma | Mean | Median | Sigma |
| A | 7 | 110 | 1645 | 11.6 | 439 | 408 | 106.7 |
| A | 0 | 29 | 1469 | 9.95 | 439 | 408 | 106.7 |
| A | 14 | 188 | 1273 | 8.11 | 439 | 408 | 106.7 |
| B | 2 | 9 | 1419 | 12.42 | 443 | 421 | 80.3 |
| B | 10 | 225 | 1109 | 8.56 | 443 | 421 | 80.3 |
| B | 14 | 254 | 1096 | 8.4 | 443 | 421 | 80.3 |
| C | 1 | 81 | 1176 | 7.09 | 435 | 402 | 109.1 |
| C | 2 | 191 | 1124 | 6.62 | 435 | 402 | 109.1 |
| C | 12 | 241 | 1091 | 6.31 | 435 | 402 | 109.1 |
| D | 6 | 44 | 1095 | 7.32 | 406 | 372 | 98.7 |
| D | 6 | 231 | 1076 | 7.13 | 406 | 372 | 98.7 |
| D | 11 | 82 | 1004 | 6.4 | 406 | 372 | 98.7 |
Histogram calculated using DETX and DETY for each event in the final _common_clean file
| Quadrant A | 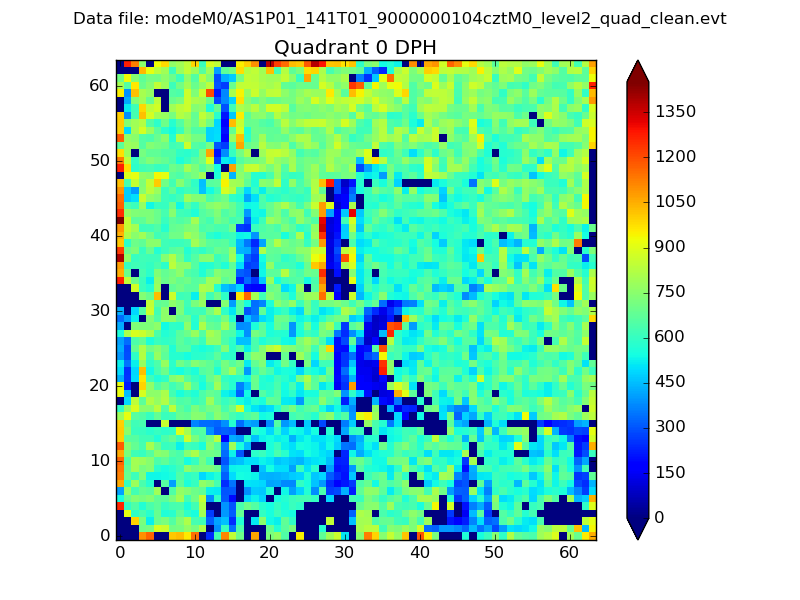 |
 |
Quadrant B |
|---|---|---|---|
| Quadrant D |  |
 |
Quadrant C |
| Plot type | Count rate plots | Images |
|---|---|---|
| Comparison with Poisson distribution Blue bars denote a histogram of data divided into 1 sec bins. Red curve is a Poisson curve with rate = median count rate of data. |
 |
 |
| Quadrant-wise count rates Data is divided into 100 sec bins |
 |
|
| Module-wise count rates for Quadrant A Data is divided into 100 sec bins |
 |
 |
| Module-wise count rates for Quadrant B Data is divided into 100 sec bins |
 |
 |
| Module-wise count rates for Quadrant C Data is divided into 100 sec bins |
 |
 |
| Module-wise count rates for Quadrant D Data is divided into 100 sec bins |
 |
 |
| Parameter | Plot |
|---|---|
| CZT HV Monitor |  |
| D_VDD |  |
| Temperature 1 |  |
| Veto HV Monitor |  |
| Veto LLD |  |
| Alpha Counter |  |
| _CPM_Rate |  |
| CZT Counter |  |
| +2.5 Volts monitor |  |
| +5 Volts monitor |  |
| _ROLL_ROT |  |
| _Roll_DEC |  |
| _Roll_RA |  |
| Veto Counter |  |