| Param | Original file | Final file |
|---|---|---|
| Filename | modeM0/AS1P01_141T01_9000000104_00706cztM0_level2.evt | modeM0/AS1P01_141T01_9000000104_00706cztM0_level2_quad_clean.evt |
| Size (bytes) | 998,637,120 | 82,307,520 |
| Size | 952.4 MB | 78.5 MB |
| Events in quadrant A | 6,734,336 | 529,408 |
| Events in quadrant B | 8,330,517 | 528,730 |
| Events in quadrant C | 7,829,095 | 519,777 |
| Events in quadrant D | 6,959,779 | 502,925 |
| Mode M9 | |||
|---|---|---|---|
| Quadrant | BADHDUFLAG | Total packets | Discarded packets |
| A | 0 | 11 | 0 |
| B | 0 | 11 | 0 |
| C | 0 | 11 | 0 |
| D | 0 | 11 | 0 |
| Mode M0 | |||
|---|---|---|---|
| Quadrant | BADHDUFLAG | Total packets | Discarded packets |
| A | 0 | 24275 | 1 |
| B | 0 | 28934 | 1 |
| C | 0 | 27425 | 1 |
| D | 0 | 24915 | 1 |
| Mode SS | |||
|---|---|---|---|
| Quadrant | BADHDUFLAG | Total packets | Discarded packets |
| A | 0 | 120 | 0 |
| B | 0 | 120 | 0 |
| C | 0 | 120 | 0 |
| D | 0 | 120 | 0 |
| Quadrant | Total seconds | Saturated seconds | Saturation percentage |
|---|---|---|---|
| A | 5889 | 9 | 0.152827% |
| B | 5890 | 99 | 1.680815% |
| C | 5890 | 25 | 0.424448% |
| D | 5890 | 59 | 1.001698% |
Noise dominated data is calculated using 1-second bins in cleaned event files. If a bin has >2000 counts, and if more than 50% of those come from <1% of pixels, then it is considered to be noise-dominated and hence unusable.
| Quadrant | # 1 sec bins | Bins with >0 counts | Bins with >2000 counts | High rate bins dominated by noise | Noise dominated (total time) | Noise dominated (detector-on time) | Marked lightcurve |
|---|---|---|---|---|---|---|---|
| A | 6994 | 5890 | 128 | 128 | 1.83% | 2.17% | 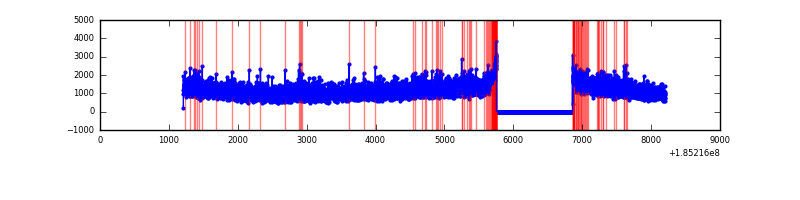 |
| B | 6995 | 5891 | 631 | 631 | 9.02% | 10.71% | 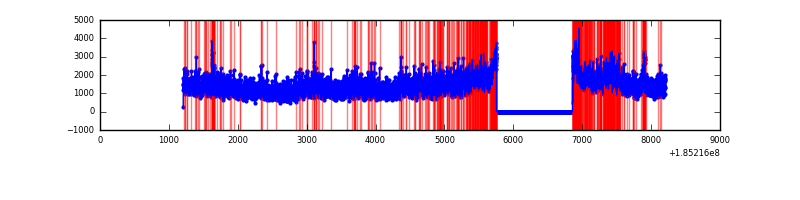 |
| C | 6995 | 5891 | 196 | 196 | 2.80% | 3.33% | 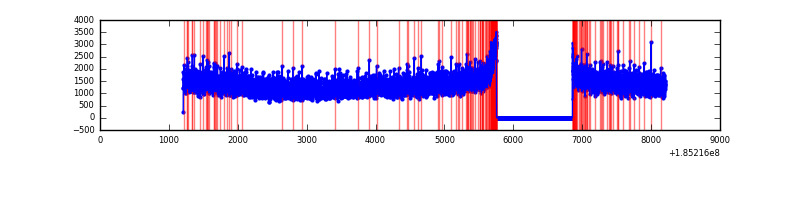 |
| D | 6995 | 5891 | 279 | 279 | 3.99% | 4.74% | 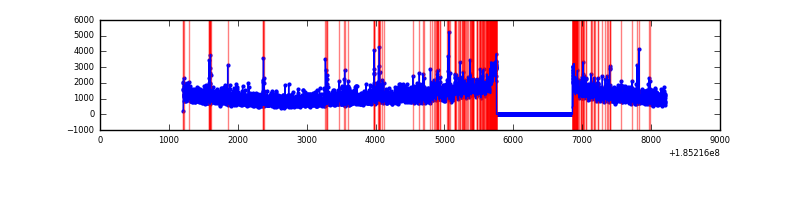 |
Top three noisy pixels from each quadrant. If the there are fewer than three noisy pixels in the level2.evt file, extra rows are filled as -1
| Pixel properties | Quadrant properties | ||||||
|---|---|---|---|---|---|---|---|
| Quadrant | DetID | PixID | Counts | Sigma | Mean | Median | Sigma |
| A | 15 | 171 | 20119 | 43.73 | 1747 | 1759 | 419.9 |
| A | 12 | 236 | 7463 | 13.59 | 1747 | 1759 | 419.9 |
| A | 11 | 79 | 7395 | 13.42 | 1747 | 1759 | 419.9 |
| B | 5 | 247 | 928910 | 2163.72 | 1833 | 1845 | 428.5 |
| B | 5 | 191 | 219634 | 508.31 | 1833 | 1845 | 428.5 |
| B | 8 | 38 | 68260 | 155.01 | 1833 | 1845 | 428.5 |
| C | 3 | 31 | 274862 | 586.5 | 1677 | 1743 | 465.7 |
| C | 3 | 15 | 231502 | 493.39 | 1677 | 1743 | 465.7 |
| C | 3 | 175 | 225530 | 480.56 | 1677 | 1743 | 465.7 |
| D | 0 | 25 | 394288 | 797.06 | 1602 | 1662 | 492.6 |
| D | 6 | 226 | 370478 | 748.73 | 1602 | 1662 | 492.6 |
| D | 1 | 4 | 105228 | 210.25 | 1602 | 1662 | 492.6 |
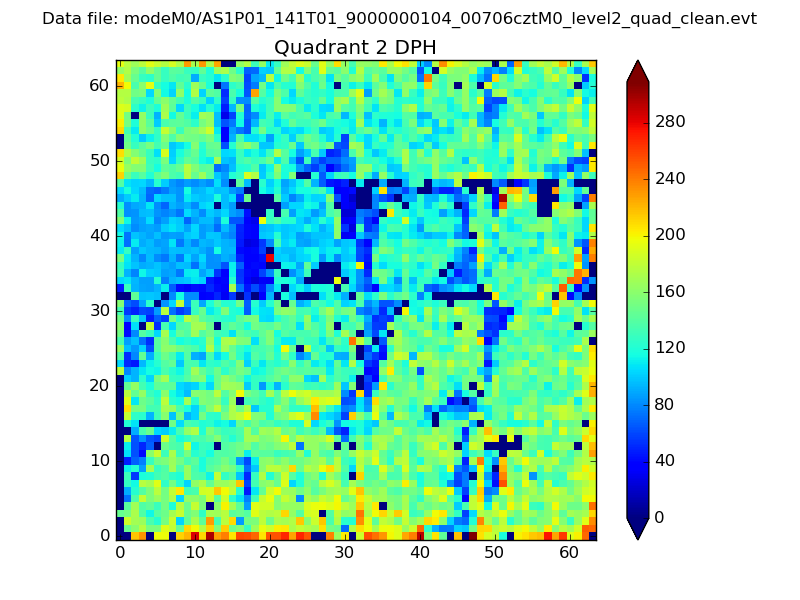
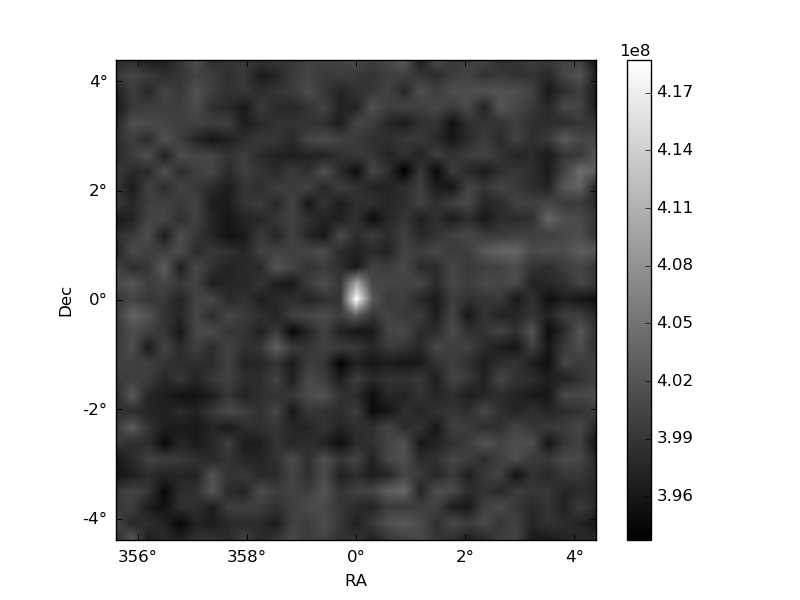
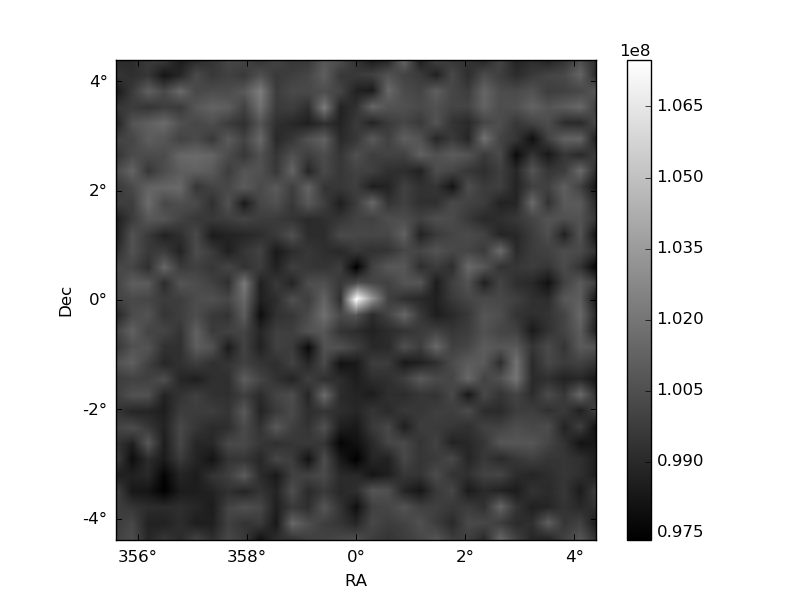
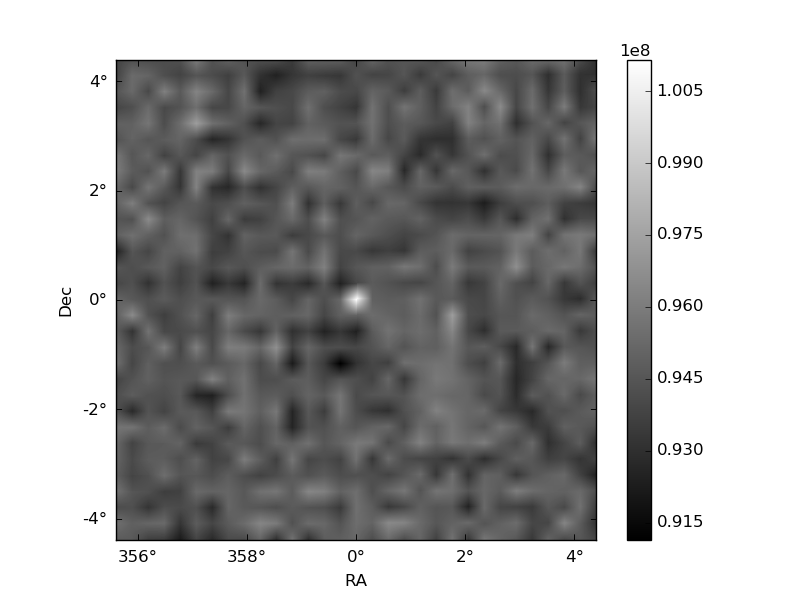
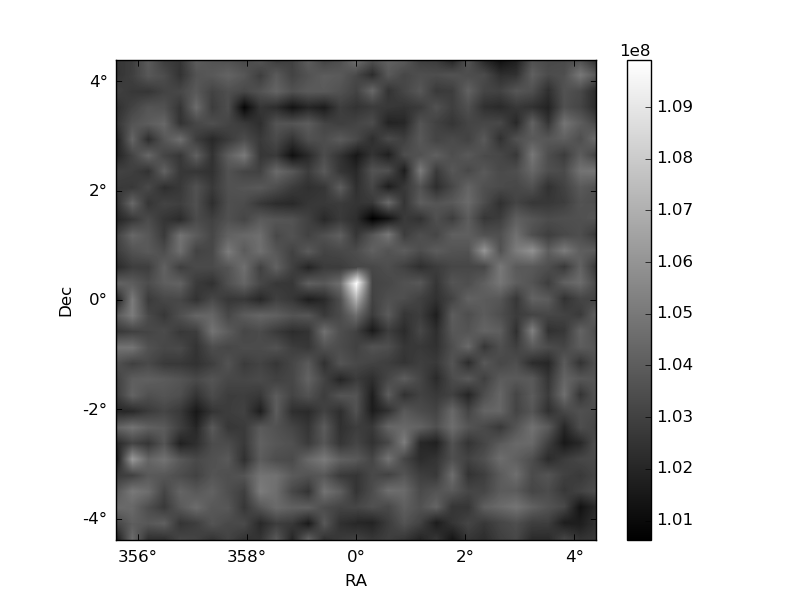
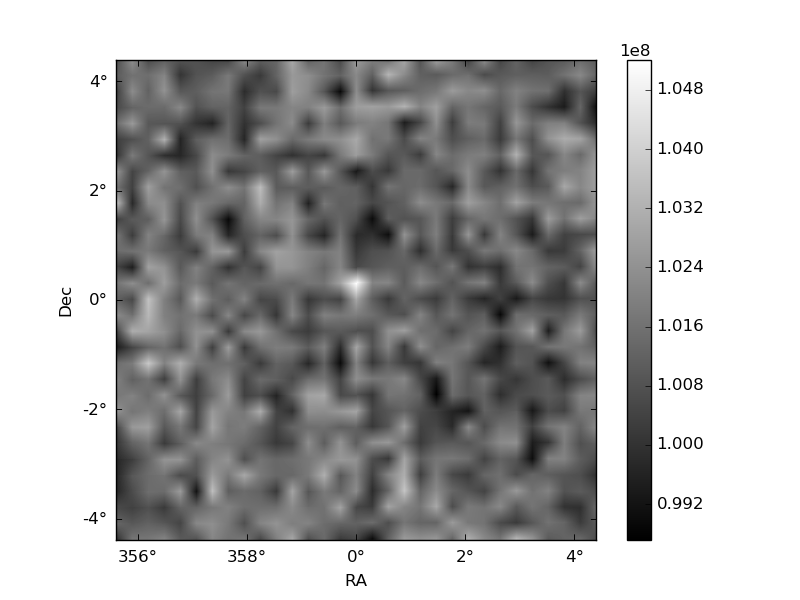
Histogram calculated using DETX and DETY for each event in the final _common_clean file
| Quadrant A | 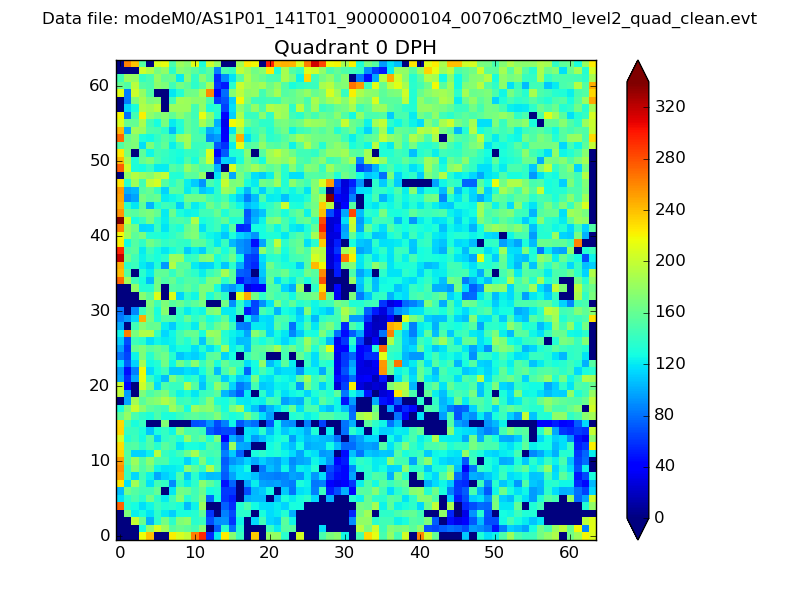 |
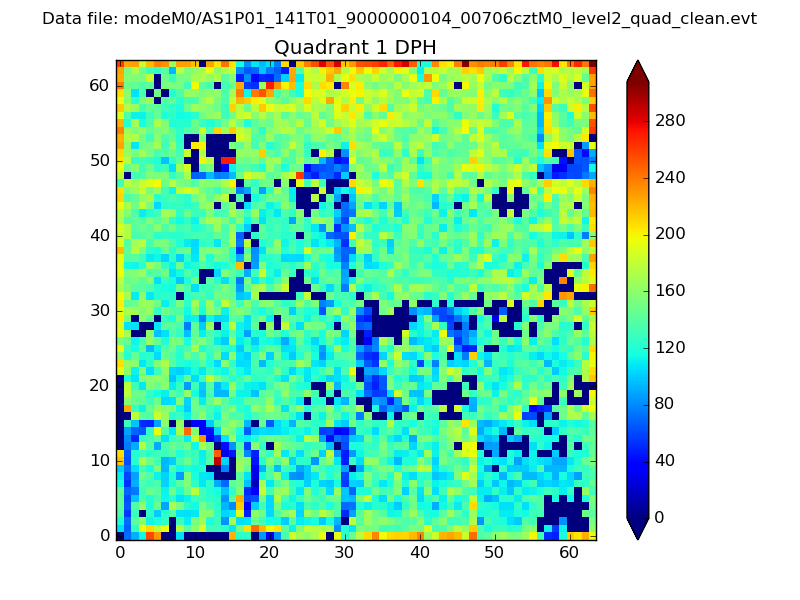 |
Quadrant B |
|---|---|---|---|
| Quadrant D | 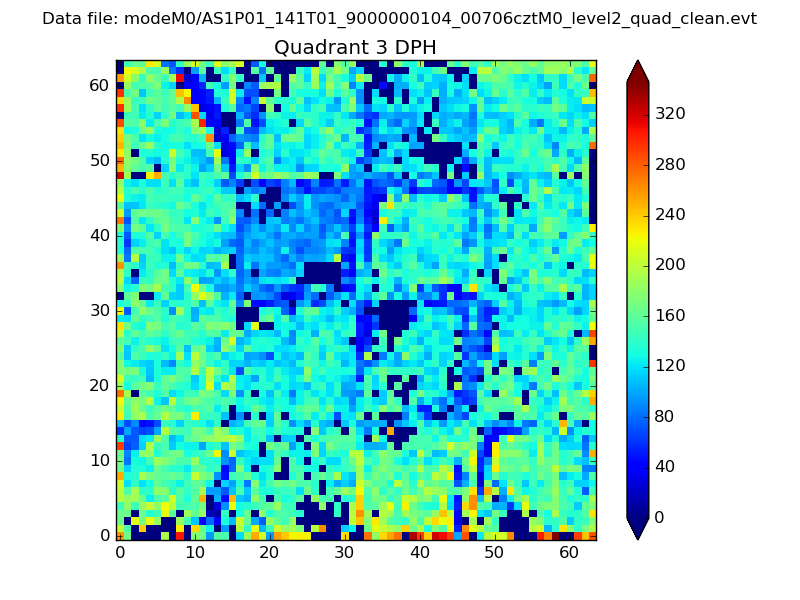 |
 |
Quadrant C |
| Plot type | Count rate plots | Images |
|---|---|---|
| Comparison with Poisson distribution Blue bars denote a histogram of data divided into 1 sec bins. Red curve is a Poisson curve with rate = median count rate of data. |
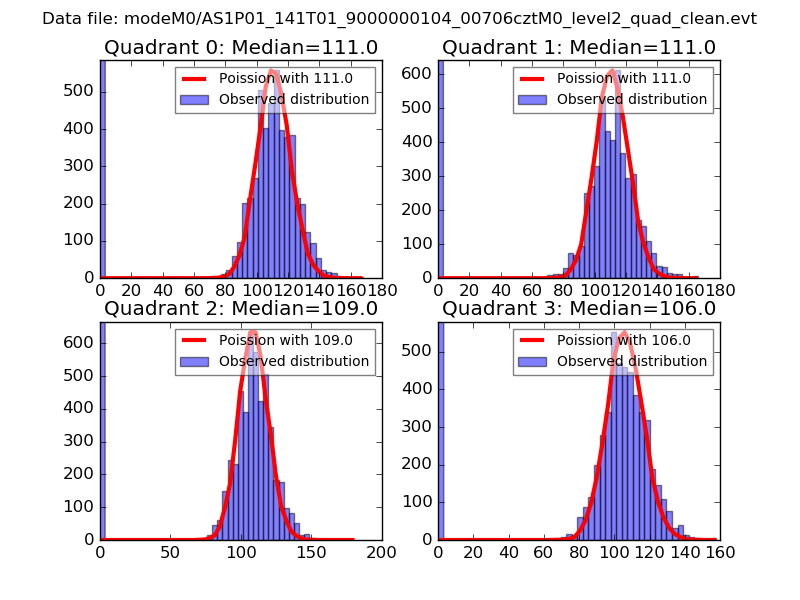 |
 |
| Quadrant-wise count rates Data is divided into 100 sec bins |
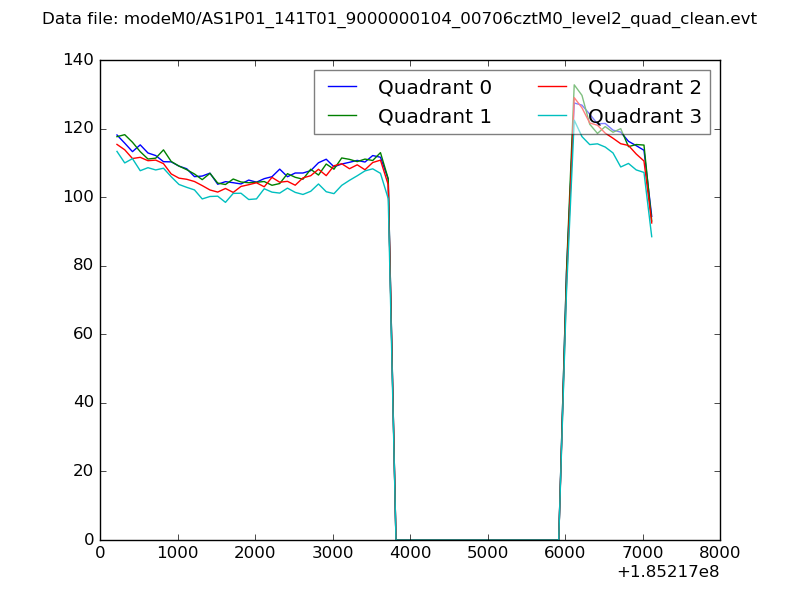 |
|
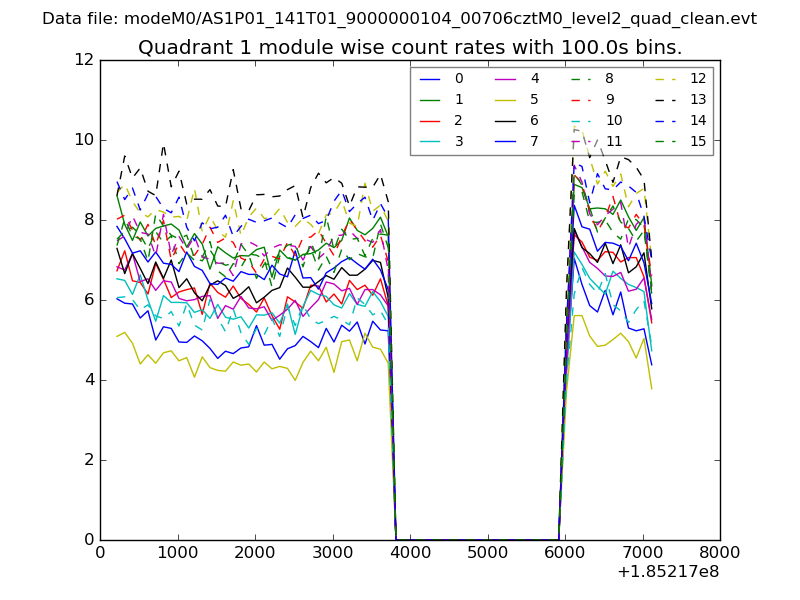
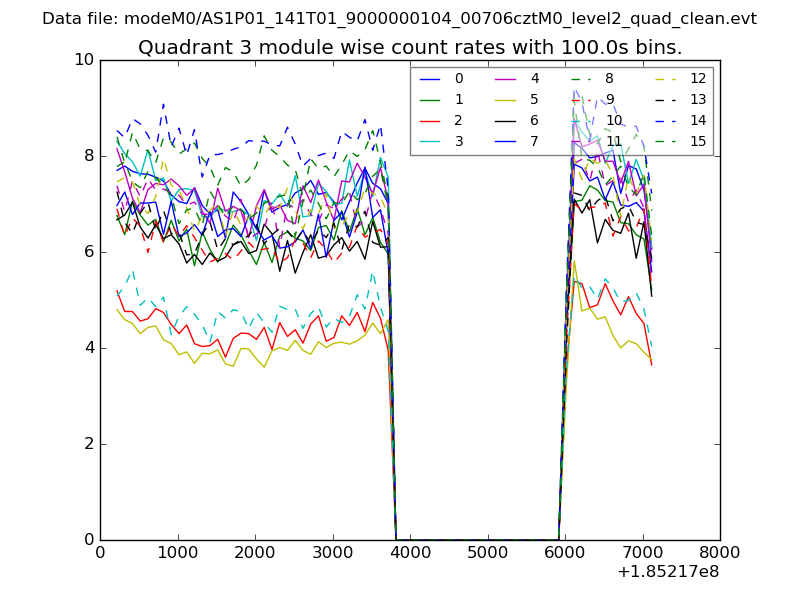
| Module-wise count rates for Quadrant A Data is divided into 100 sec bins |
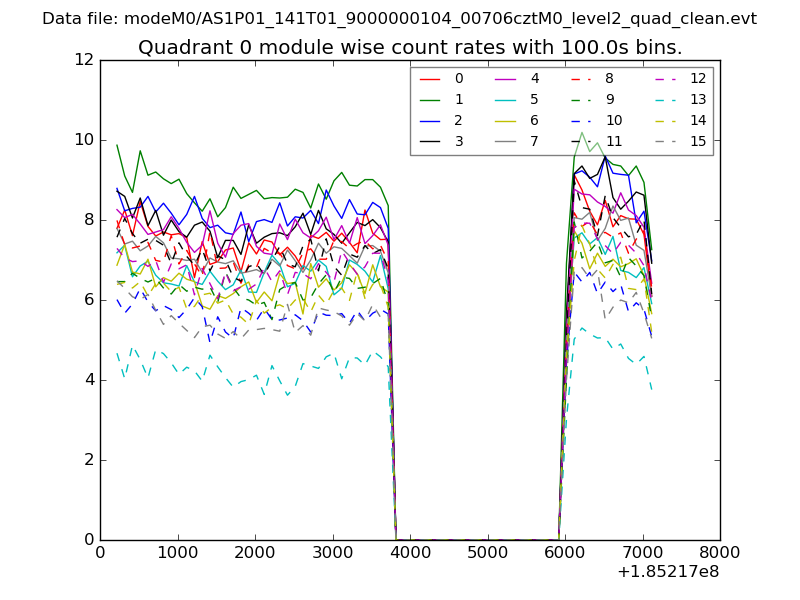 |
 |
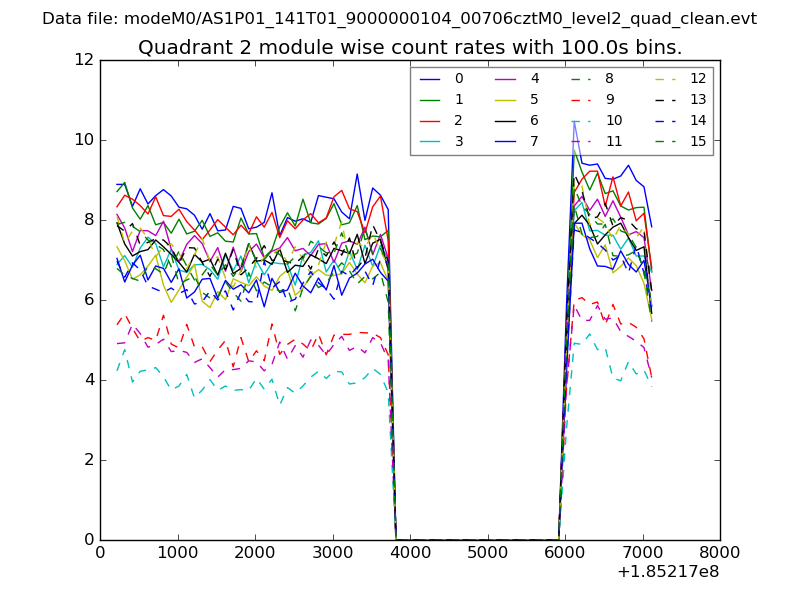
| Module-wise count rates for Quadrant B Data is divided into 100 sec bins |
 |
 |
| Module-wise count rates for Quadrant C Data is divided into 100 sec bins |
 |
 |
| Module-wise count rates for Quadrant D Data is divided into 100 sec bins |
 |
 |
| Parameter | Plot |
|---|---|
| CZT HV Monitor | 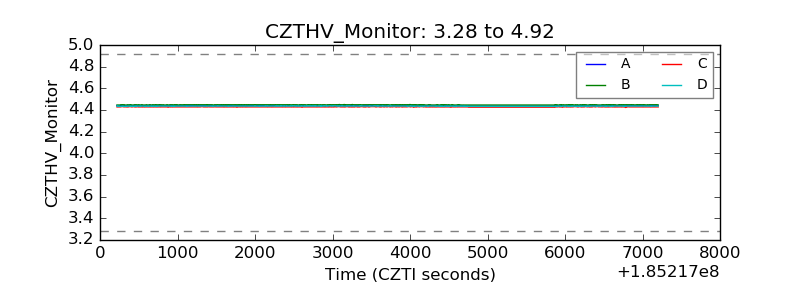 |
| D_VDD | 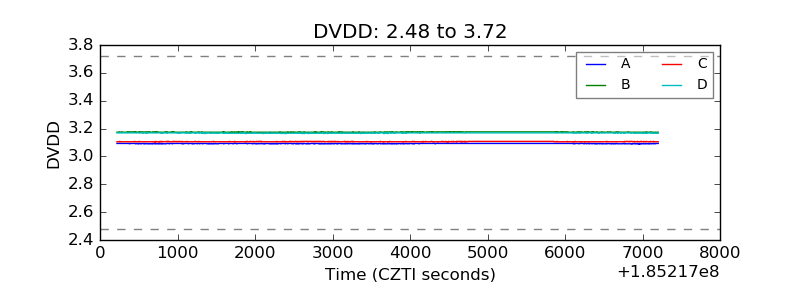 |
| Temperature 1 | 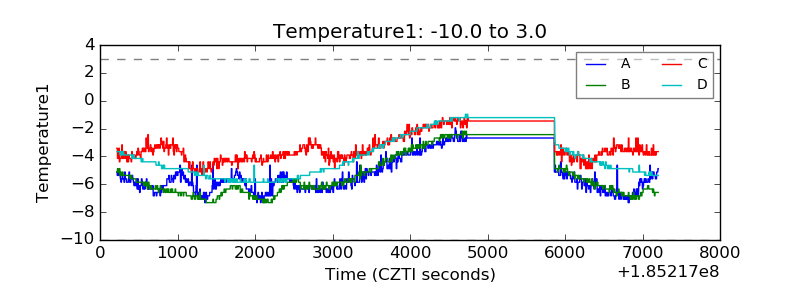 |
| Veto HV Monitor |  |
| Veto LLD | 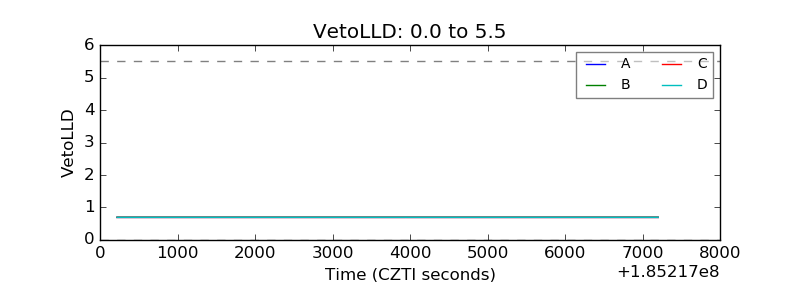 |
| Alpha Counter | 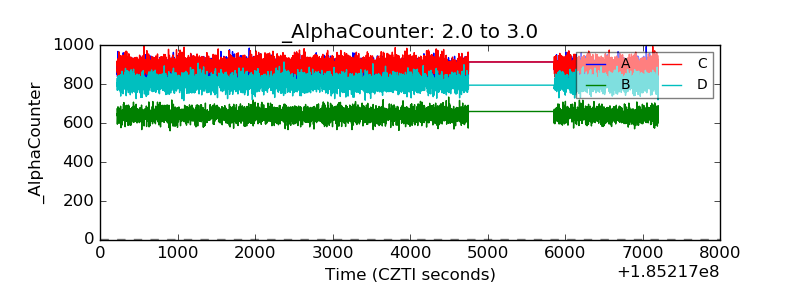 |
| _CPM_Rate | 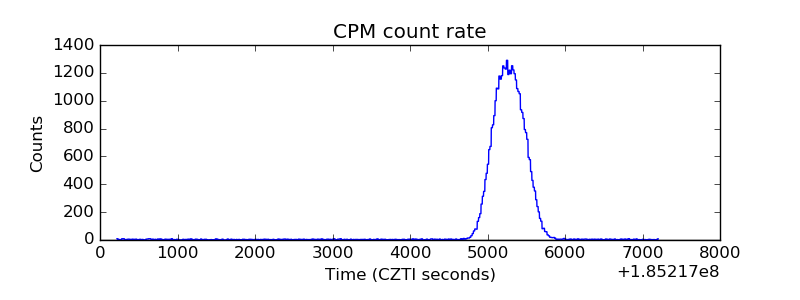 |
| CZT Counter | 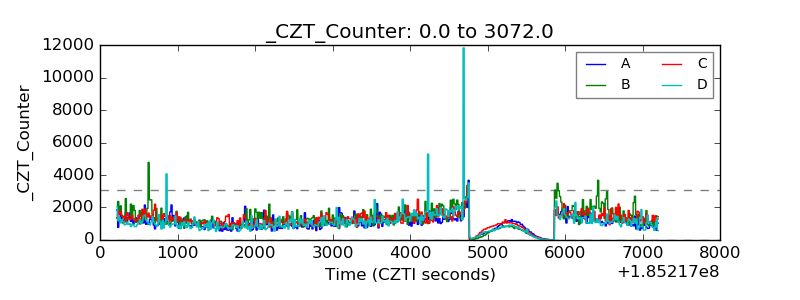 |
| +2.5 Volts monitor |  |
| +5 Volts monitor |  |
| _ROLL_ROT | 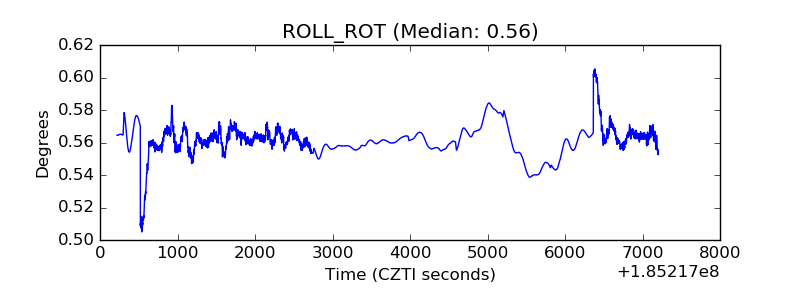 |
| _Roll_DEC | 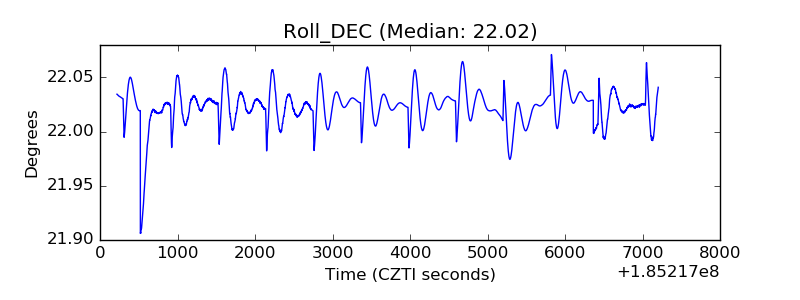 |
| _Roll_RA | 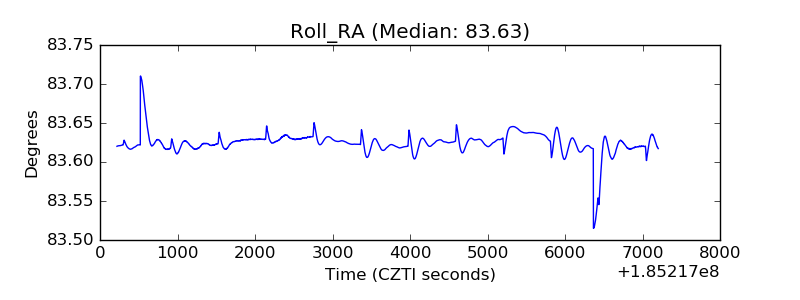 |
| Veto Counter | 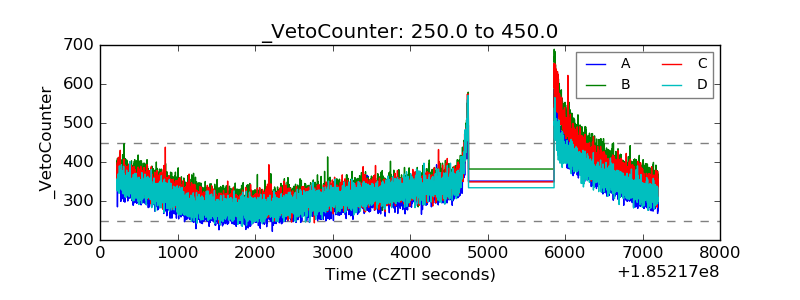 |