| Param | Original file | Final file |
|---|---|---|
| Filename | modeM0/AS1P01_141T01_9000000104_00707cztM0_level2.evt | modeM0/AS1P01_141T01_9000000104_00707cztM0_level2_quad_clean.evt |
| Size (bytes) | 977,299,200 | 82,270,080 |
| Size | 932.0 MB | 78.5 MB |
| Events in quadrant A | 6,734,004 | 526,716 |
| Events in quadrant B | 7,825,248 | 533,974 |
| Events in quadrant C | 7,845,575 | 521,401 |
| Events in quadrant D | 6,805,055 | 500,409 |
| Mode M9 | |||
|---|---|---|---|
| Quadrant | BADHDUFLAG | Total packets | Discarded packets |
| A | 0 | 12 | 0 |
| B | 0 | 12 | 0 |
| C | 0 | 12 | 0 |
| D | 0 | 12 | 0 |
| Mode M0 | |||
|---|---|---|---|
| Quadrant | BADHDUFLAG | Total packets | Discarded packets |
| A | 0 | 24186 | 1 |
| B | 0 | 27394 | 2 |
| C | 0 | 27438 | 1 |
| D | 0 | 24419 | 1 |
| Mode SS | |||
|---|---|---|---|
| Quadrant | BADHDUFLAG | Total packets | Discarded packets |
| A | 0 | 118 | 0 |
| B | 0 | 118 | 0 |
| C | 0 | 118 | 0 |
| D | 0 | 118 | 0 |
| Quadrant | Total seconds | Saturated seconds | Saturation percentage |
|---|---|---|---|
| A | 5853 | 28 | 0.478387% |
| B | 5852 | 54 | 0.922761% |
| C | 5853 | 8 | 0.136682% |
| D | 5853 | 53 | 0.905519% |
Noise dominated data is calculated using 1-second bins in cleaned event files. If a bin has >2000 counts, and if more than 50% of those come from <1% of pixels, then it is considered to be noise-dominated and hence unusable.
| Quadrant | # 1 sec bins | Bins with >0 counts | Bins with >2000 counts | High rate bins dominated by noise | Noise dominated (total time) | Noise dominated (detector-on time) | Marked lightcurve |
|---|---|---|---|---|---|---|---|
| A | 7043 | 5854 | 169 | 169 | 2.40% | 2.89% | 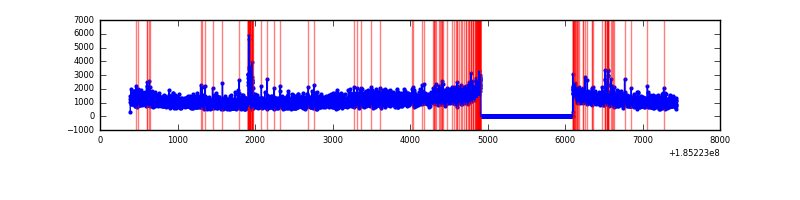 |
| B | 7042 | 5853 | 436 | 436 | 6.19% | 7.45% | 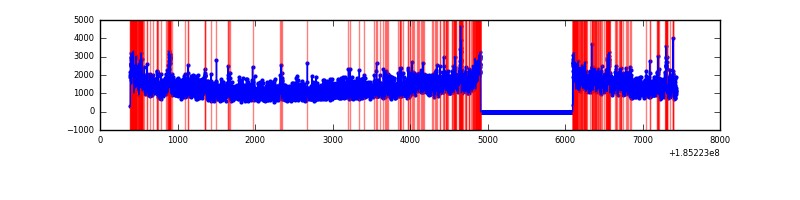 |
| C | 7043 | 5854 | 219 | 219 | 3.11% | 3.74% | 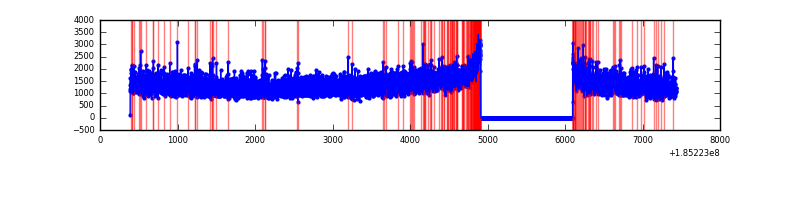 |
| D | 7043 | 5854 | 289 | 289 | 4.10% | 4.94% | 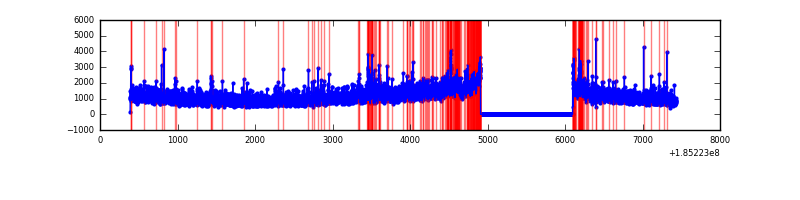 |
Top three noisy pixels from each quadrant. If the there are fewer than three noisy pixels in the level2.evt file, extra rows are filled as -1
| Pixel properties | Quadrant properties | ||||||
|---|---|---|---|---|---|---|---|
| Quadrant | DetID | PixID | Counts | Sigma | Mean | Median | Sigma |
| A | 15 | 171 | 115722 | 277.49 | 1717 | 1732 | 410.8 |
| A | 13 | 8 | 21374 | 47.82 | 1717 | 1732 | 410.8 |
| A | 15 | 69 | 7864 | 14.93 | 1717 | 1732 | 410.8 |
| B | 5 | 247 | 495217 | 1171.96 | 1819 | 1832 | 421.0 |
| B | 5 | 191 | 240534 | 567.0 | 1819 | 1832 | 421.0 |
| B | 7 | 221 | 69199 | 160.02 | 1819 | 1832 | 421.0 |
| C | 3 | 31 | 294036 | 635.77 | 1655 | 1718 | 459.8 |
| C | 3 | 95 | 258847 | 559.24 | 1655 | 1718 | 459.8 |
| C | 3 | 15 | 235837 | 509.19 | 1655 | 1718 | 459.8 |
| D | 6 | 226 | 411593 | 850.71 | 1561 | 1615 | 481.9 |
| D | 0 | 25 | 248577 | 512.45 | 1561 | 1615 | 481.9 |
| D | 12 | 188 | 120937 | 247.6 | 1561 | 1615 | 481.9 |
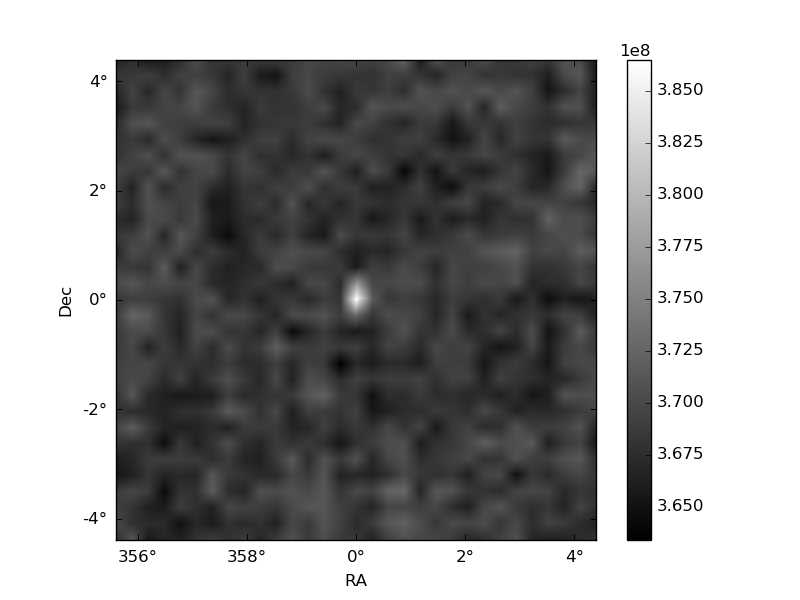
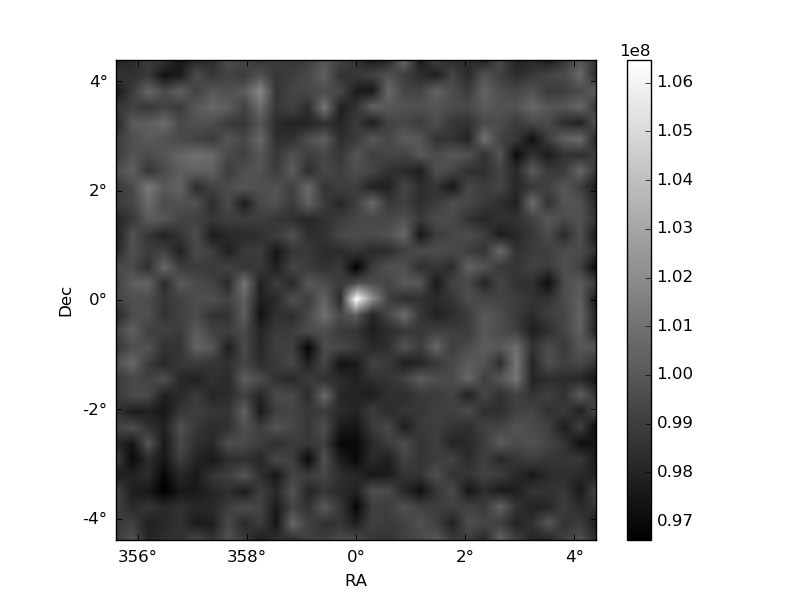
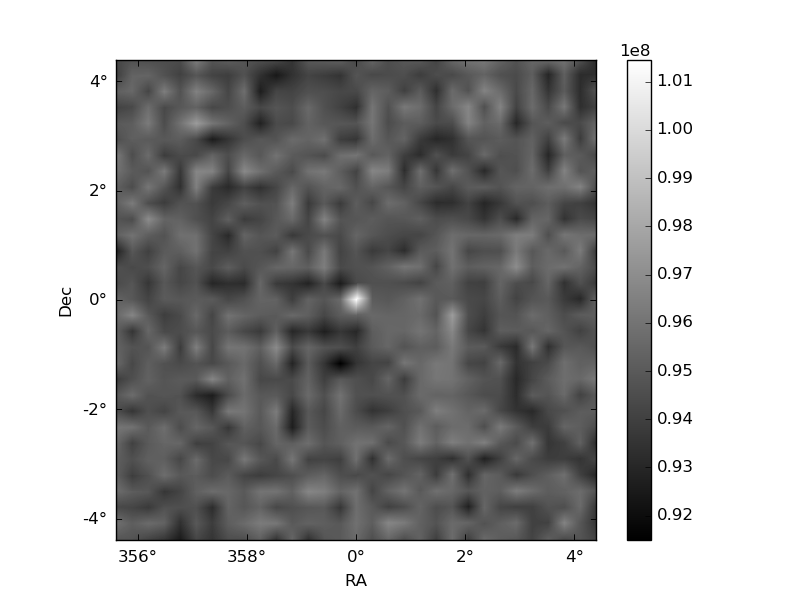
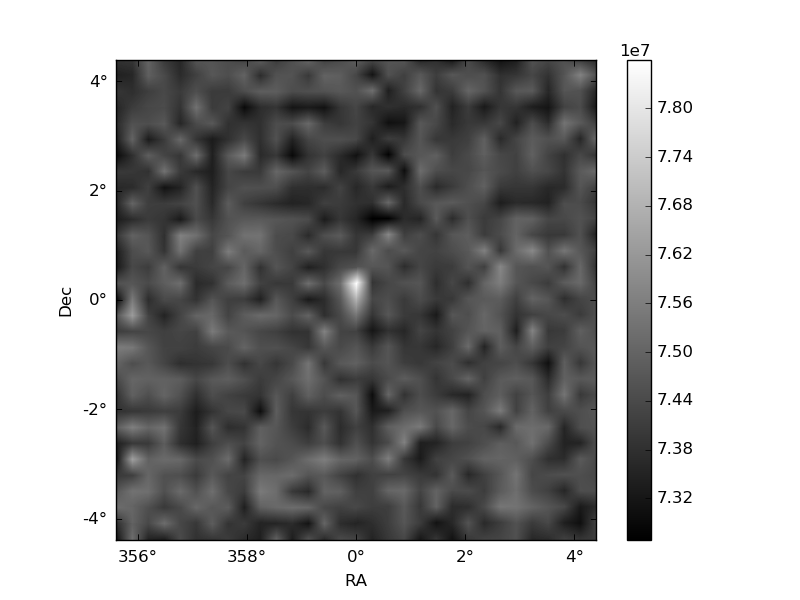
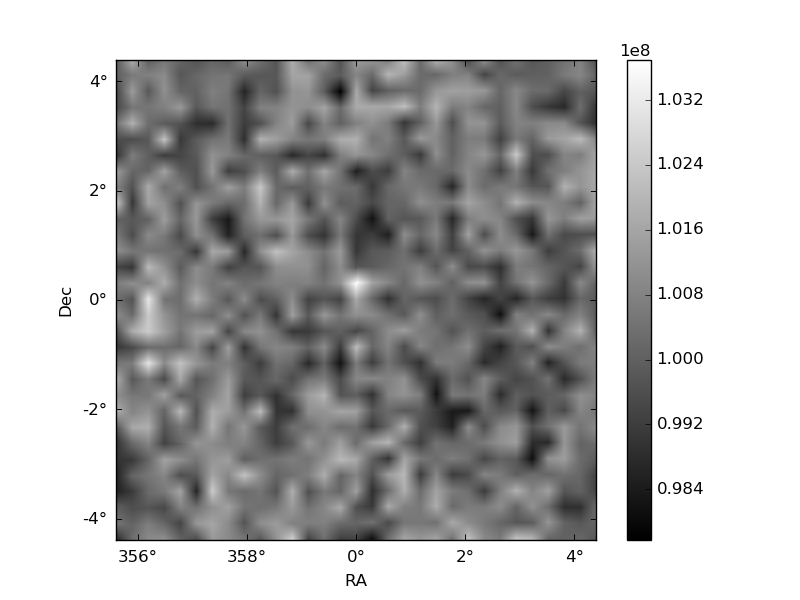
Histogram calculated using DETX and DETY for each event in the final _common_clean file
| Quadrant A | 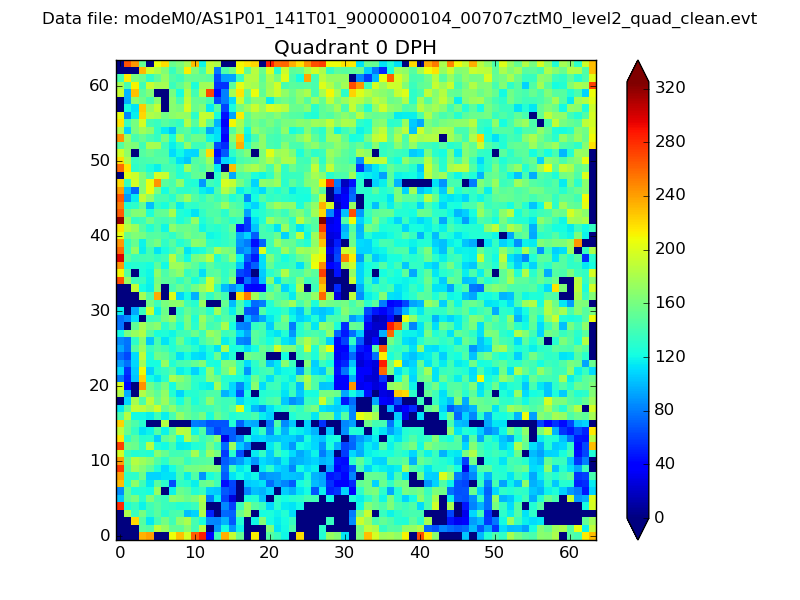 |
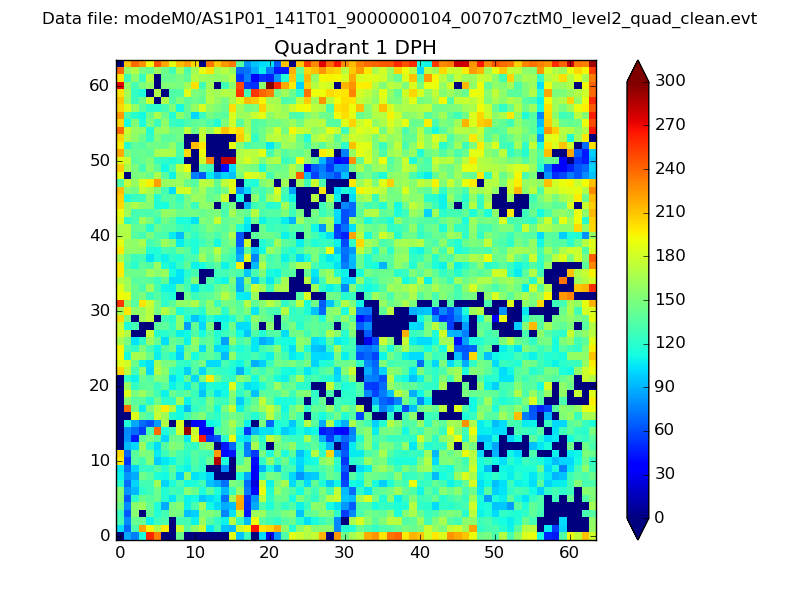 |
Quadrant B |
|---|---|---|---|
| Quadrant D | 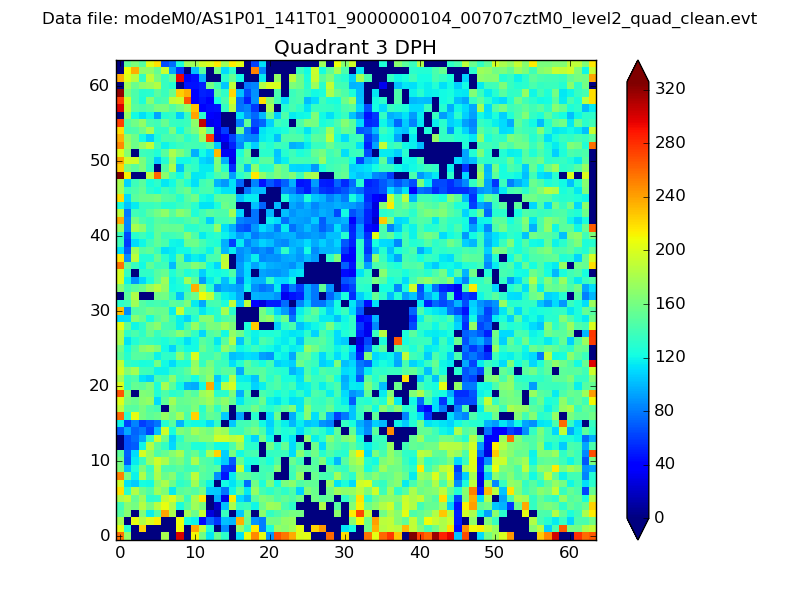 |
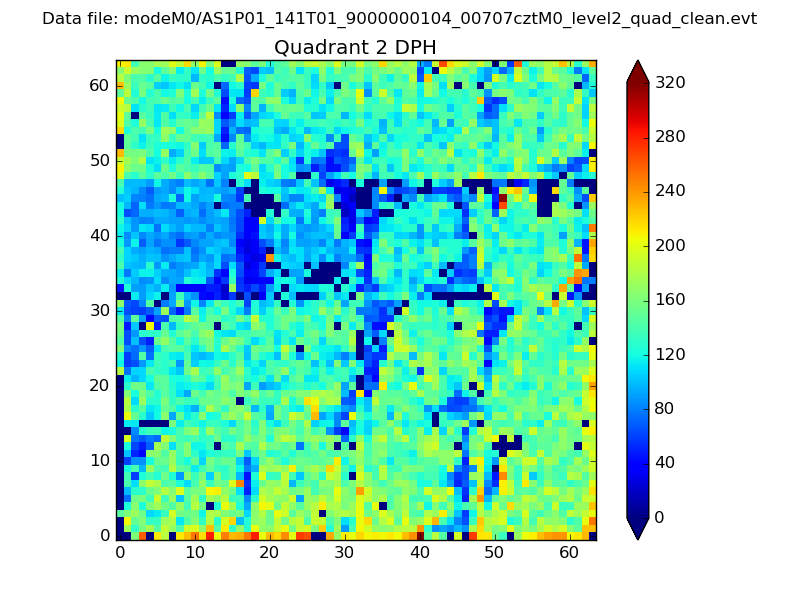 |
Quadrant C |
| Plot type | Count rate plots | Images |
|---|---|---|
| Comparison with Poisson distribution Blue bars denote a histogram of data divided into 1 sec bins. Red curve is a Poisson curve with rate = median count rate of data. |
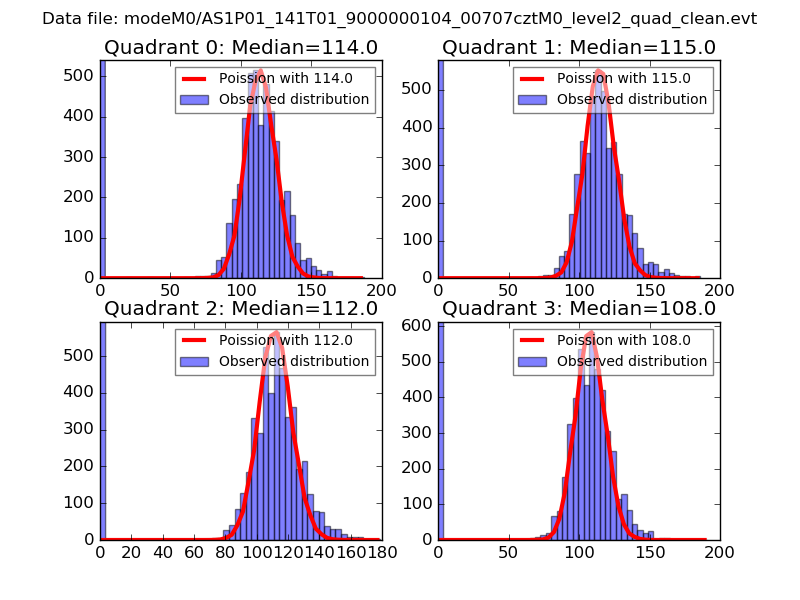 |
 |
| Quadrant-wise count rates Data is divided into 100 sec bins |
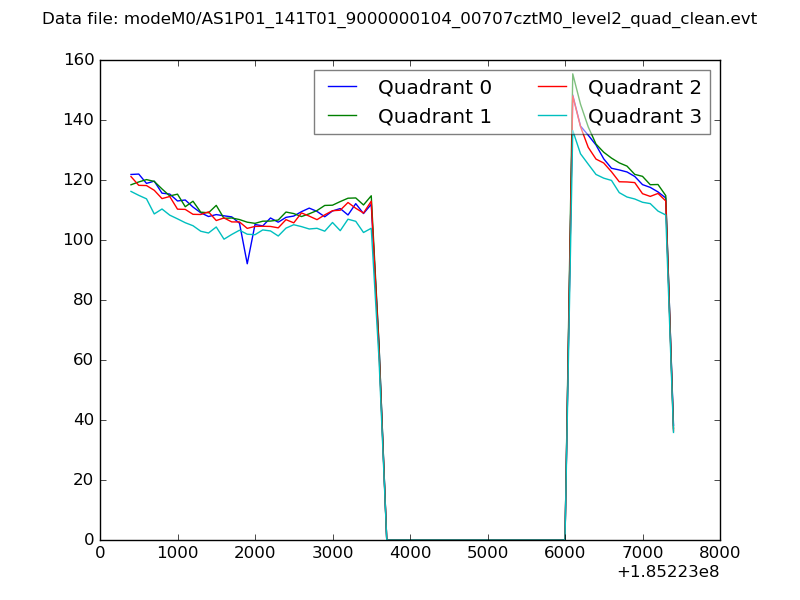 |
|
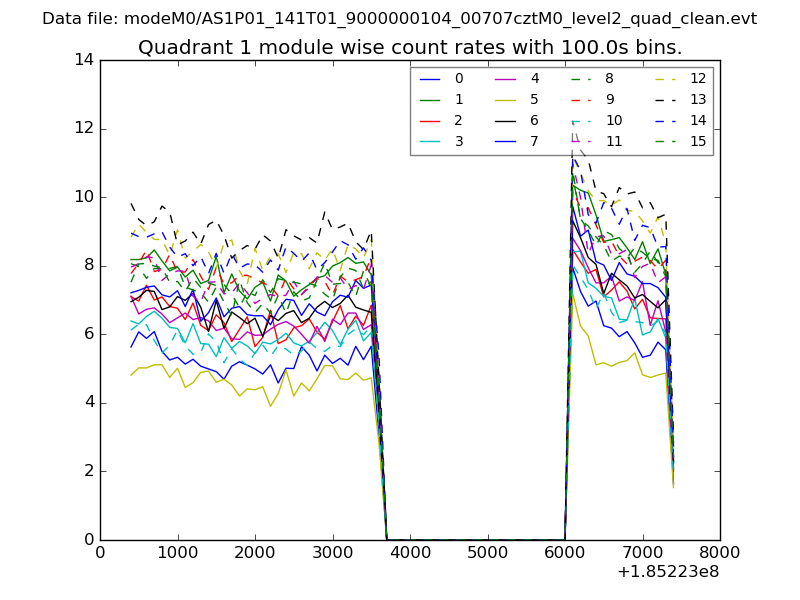
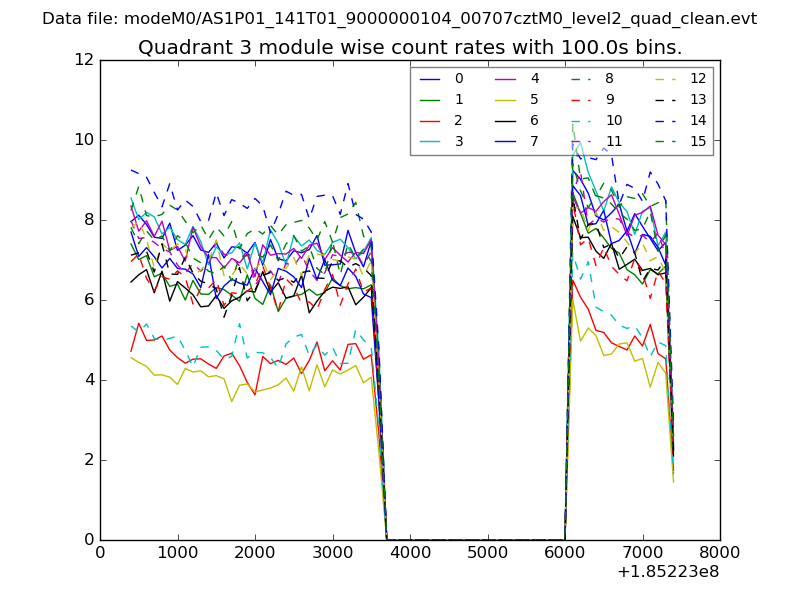
| Module-wise count rates for Quadrant A Data is divided into 100 sec bins |
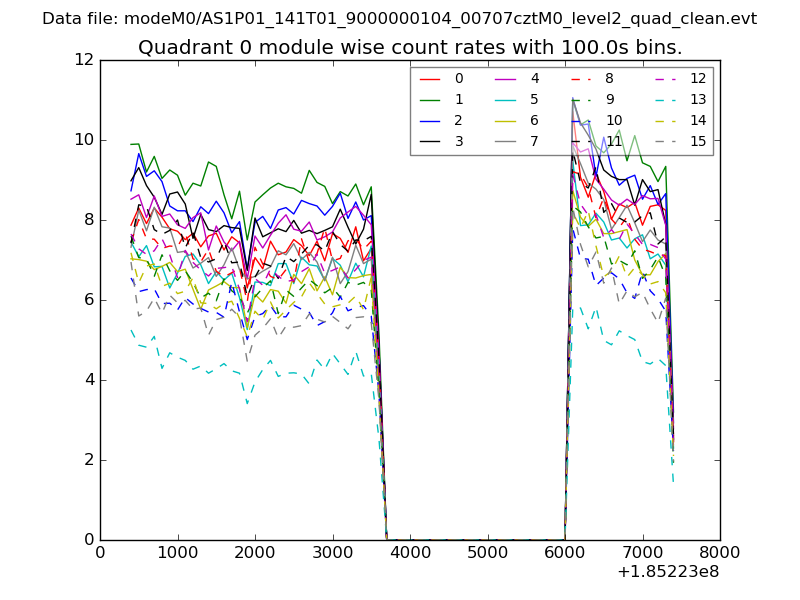 |
 |
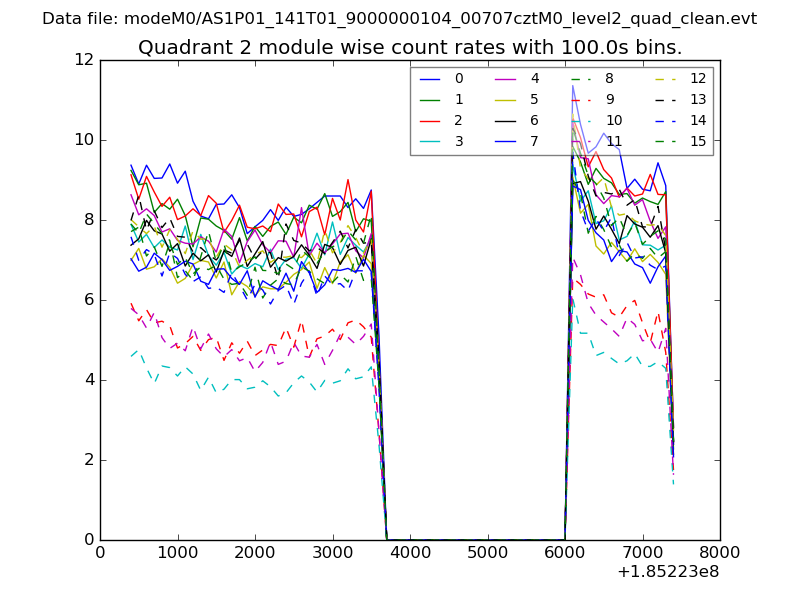
| Module-wise count rates for Quadrant B Data is divided into 100 sec bins |
 |
 |
| Module-wise count rates for Quadrant C Data is divided into 100 sec bins |
 |
 |
| Module-wise count rates for Quadrant D Data is divided into 100 sec bins |
 |
 |
| Parameter | Plot |
|---|---|
| CZT HV Monitor | 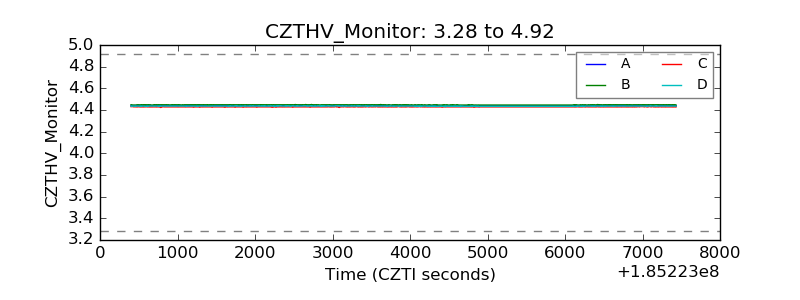 |
| D_VDD | 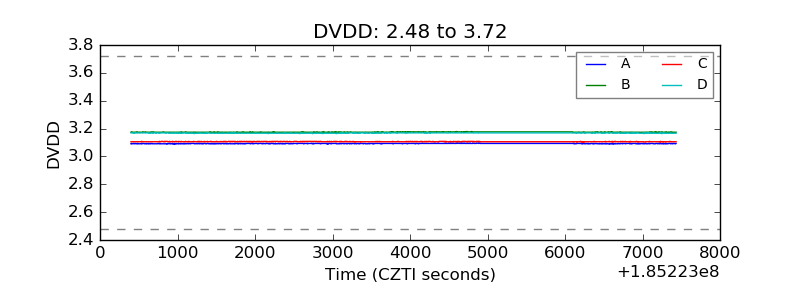 |
| Temperature 1 | 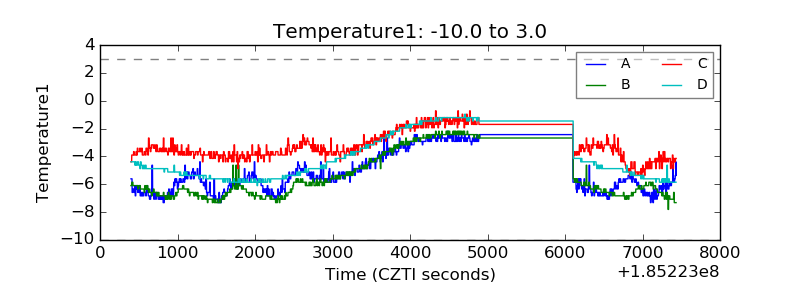 |
| Veto HV Monitor | 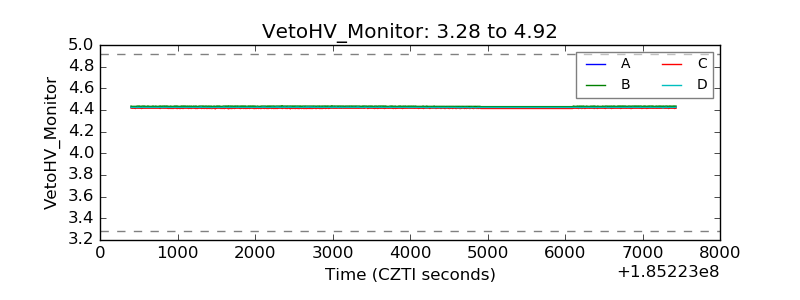 |
| Veto LLD | 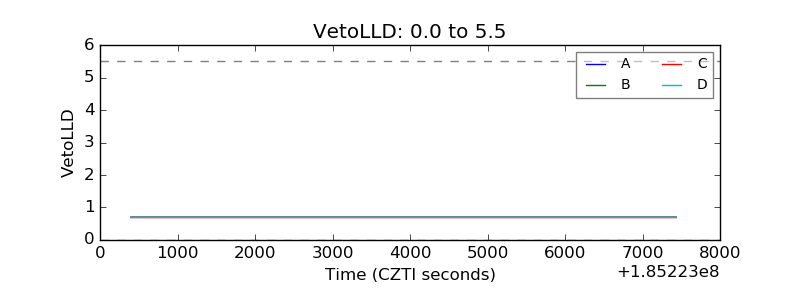 |
| Alpha Counter | 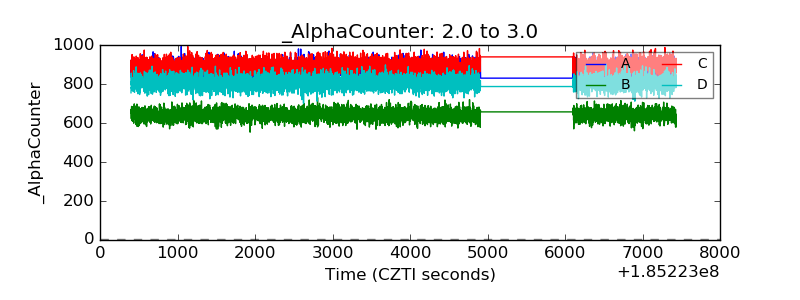 |
| _CPM_Rate | 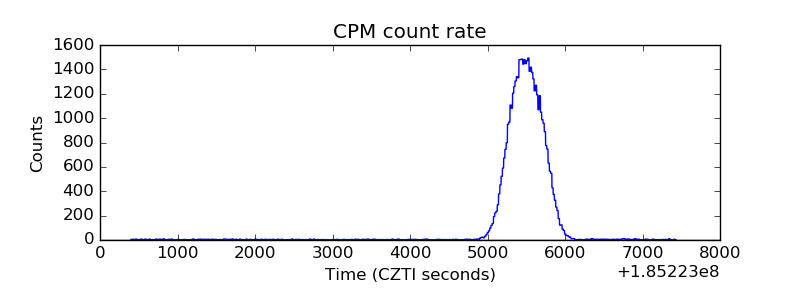 |
| CZT Counter | 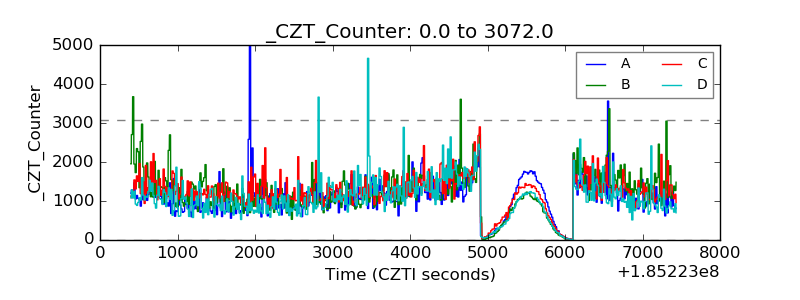 |
| +2.5 Volts monitor |  |
| +5 Volts monitor |  |
| _ROLL_ROT | 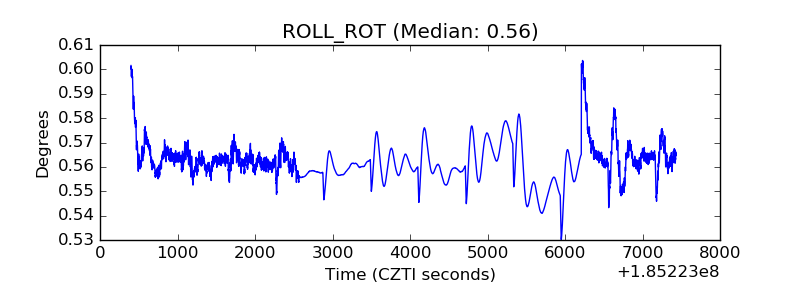 |
| _Roll_DEC | 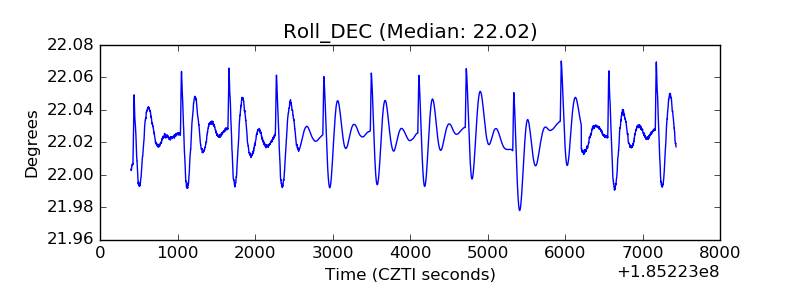 |
| _Roll_RA | 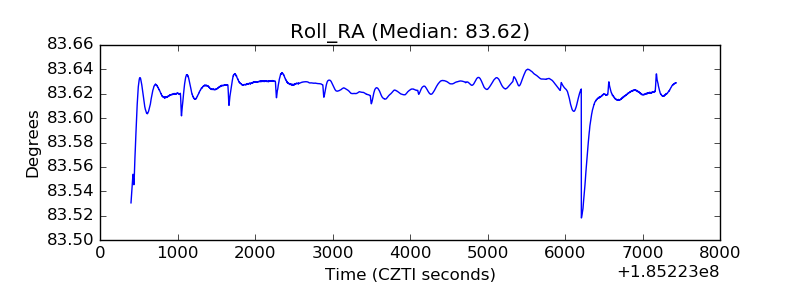 |
| Veto Counter | 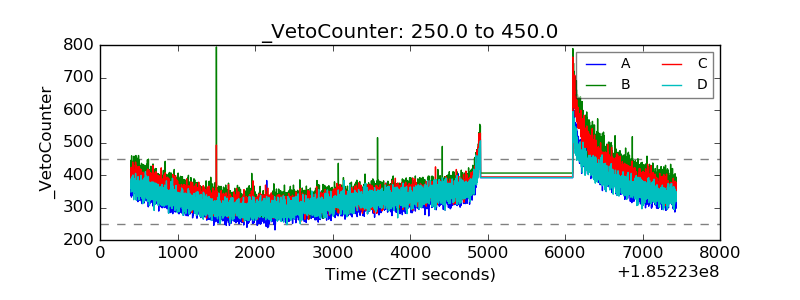 |