| Param | Original file | Final file |
|---|---|---|
| Filename | modeM0/AS1P01_141T01_9000000104_00708cztM0_level2.evt | modeM0/AS1P01_141T01_9000000104_00708cztM0_level2_quad_clean.evt |
| Size (bytes) | 919,900,800 | 73,964,160 |
| Size | 877.3 MB | 70.5 MB |
| Events in quadrant A | 6,487,531 | 466,184 |
| Events in quadrant B | 7,153,664 | 476,122 |
| Events in quadrant C | 7,410,348 | 460,711 |
| Events in quadrant D | 6,434,183 | 443,041 |
| Mode M9 | |||
|---|---|---|---|
| Quadrant | BADHDUFLAG | Total packets | Discarded packets |
| A | 0 | 24 | 12 |
| B | 0 | 24 | 12 |
| C | 0 | 24 | 12 |
| D | 0 | 24 | 12 |
| Mode M0 | |||
|---|---|---|---|
| Quadrant | BADHDUFLAG | Total packets | Discarded packets |
| A | 0 | 46564 | 23283 |
| B | 0 | 50454 | 25234 |
| C | 0 | 51934 | 25968 |
| D | 0 | 46307 | 23161 |
| Mode SS | |||
|---|---|---|---|
| Quadrant | BADHDUFLAG | Total packets | Discarded packets |
| A | 0 | 228 | 114 |
| B | 0 | 228 | 114 |
| C | 0 | 228 | 114 |
| D | 0 | 228 | 114 |
| Quadrant | Total seconds | Saturated seconds | Saturation percentage |
|---|---|---|---|
| A | 5630 | 23 | 0.408526% |
| B | 5629 | 19 | 0.337538% |
| C | 5630 | 11 | 0.195382% |
| D | 5629 | 48 | 0.852727% |
Noise dominated data is calculated using 1-second bins in cleaned event files. If a bin has >2000 counts, and if more than 50% of those come from <1% of pixels, then it is considered to be noise-dominated and hence unusable.
| Quadrant | # 1 sec bins | Bins with >0 counts | Bins with >2000 counts | High rate bins dominated by noise | Noise dominated (total time) | Noise dominated (detector-on time) | Marked lightcurve |
|---|---|---|---|---|---|---|---|
| A | 6875 | 5631 | 176 | 176 | 2.56% | 3.13% | 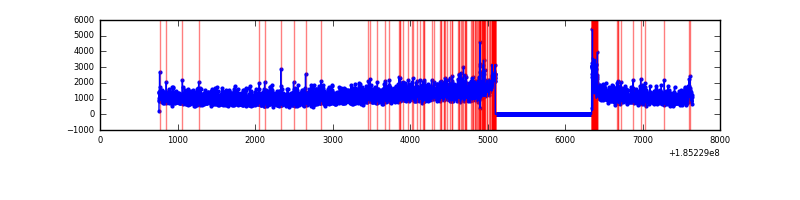 |
| B | 6875 | 5631 | 262 | 262 | 3.81% | 4.65% | 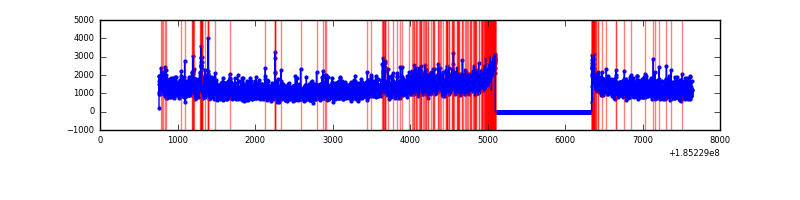 |
| C | 6875 | 5631 | 240 | 240 | 3.49% | 4.26% | 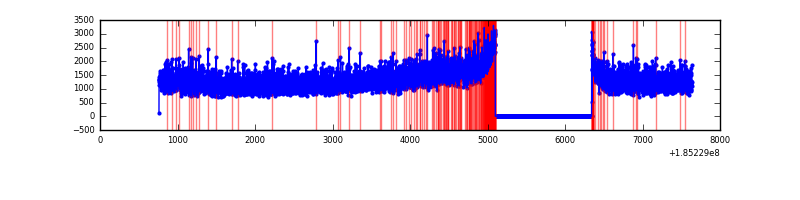 |
| D | 6875 | 5631 | 271 | 271 | 3.94% | 4.81% | 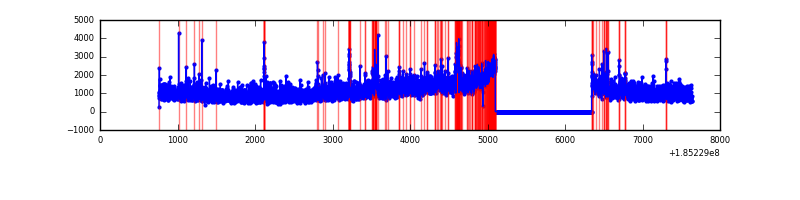 |
Top three noisy pixels from each quadrant. If the there are fewer than three noisy pixels in the level2.evt file, extra rows are filled as -1
| Pixel properties | Quadrant properties | ||||||
|---|---|---|---|---|---|---|---|
| Quadrant | DetID | PixID | Counts | Sigma | Mean | Median | Sigma |
| A | 15 | 171 | 107048 | 265.7 | 1660 | 1674 | 396.6 |
| A | 12 | 251 | 7298 | 14.18 | 1660 | 1674 | 396.6 |
| A | 11 | 79 | 6340 | 11.77 | 1660 | 1674 | 396.6 |
| B | 5 | 247 | 286704 | 698.25 | 1757 | 1769 | 408.1 |
| B | 7 | 221 | 117275 | 283.05 | 1757 | 1769 | 408.1 |
| B | 5 | 191 | 26002 | 59.38 | 1757 | 1769 | 408.1 |
| C | 3 | 31 | 266476 | 607.34 | 1579 | 1637 | 436.1 |
| C | 3 | 15 | 221437 | 504.06 | 1579 | 1637 | 436.1 |
| C | 3 | 175 | 213722 | 486.36 | 1579 | 1637 | 436.1 |
| D | 6 | 226 | 398020 | 859.48 | 1503 | 1554 | 461.3 |
| D | 0 | 25 | 187666 | 403.46 | 1503 | 1554 | 461.3 |
| D | 1 | 4 | 75472 | 160.24 | 1503 | 1554 | 461.3 |
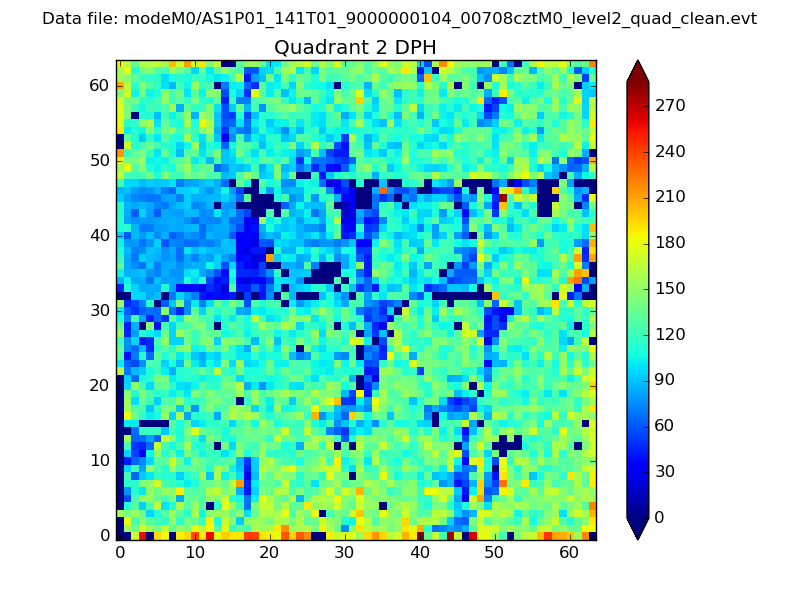
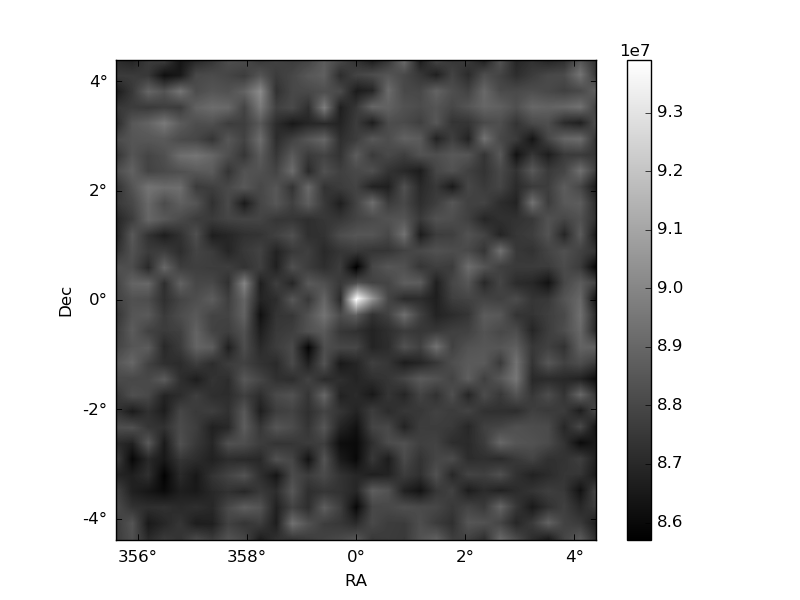
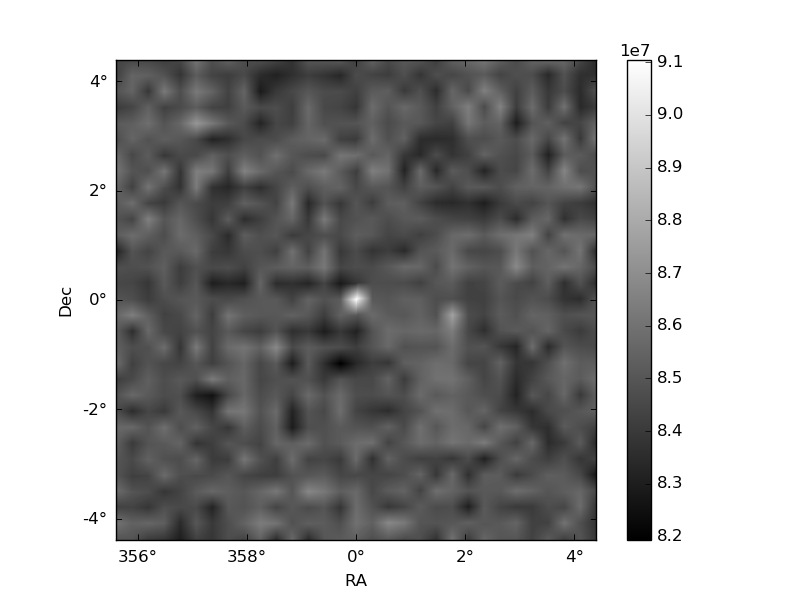
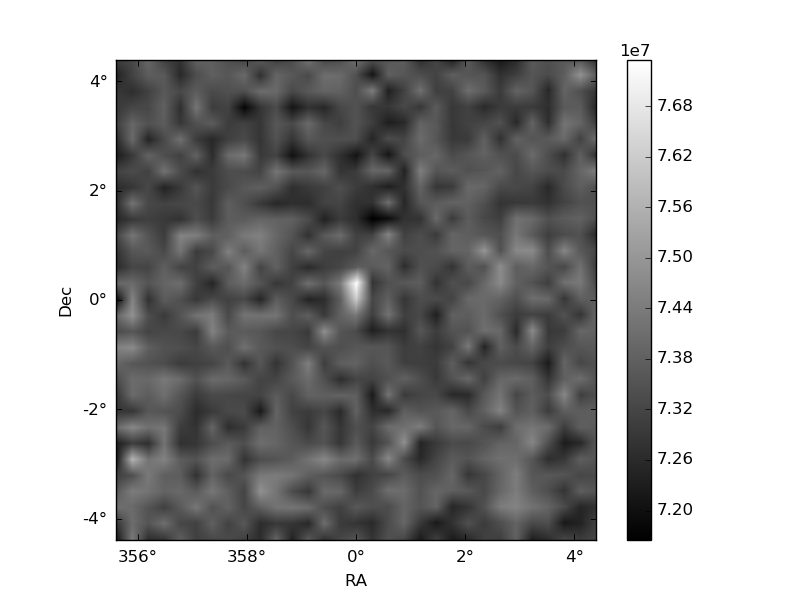
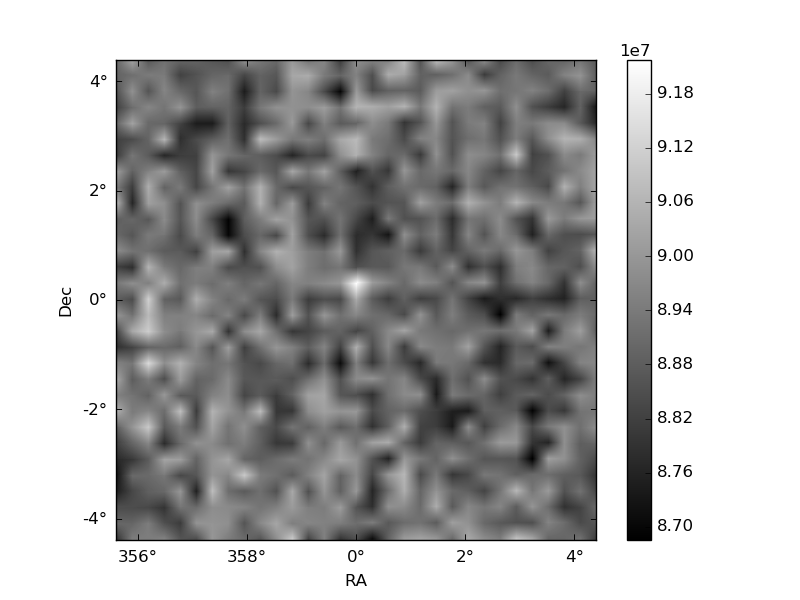
Histogram calculated using DETX and DETY for each event in the final _common_clean file
| Quadrant A | 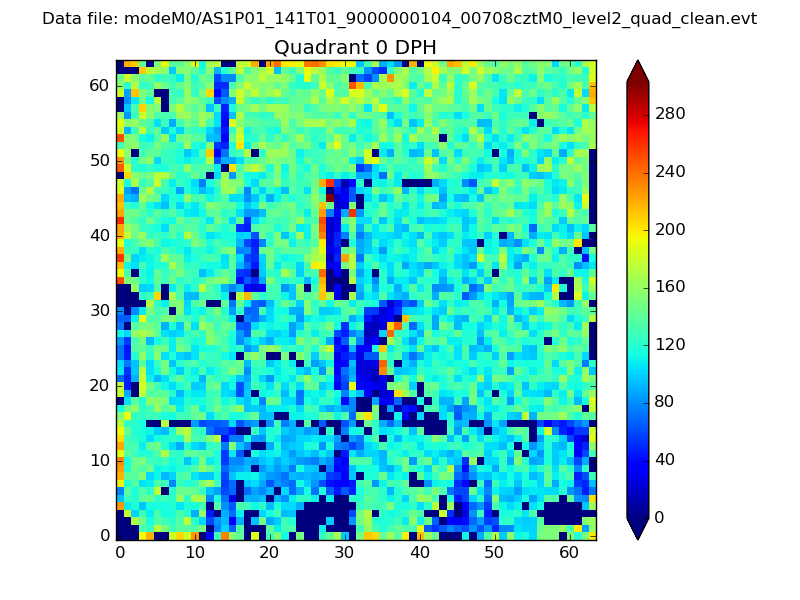 |
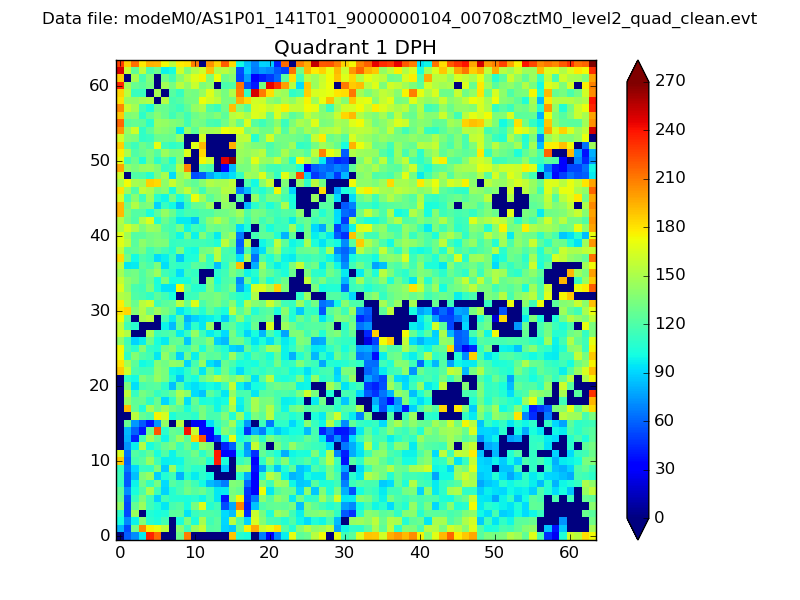 |
Quadrant B |
|---|---|---|---|
| Quadrant D | 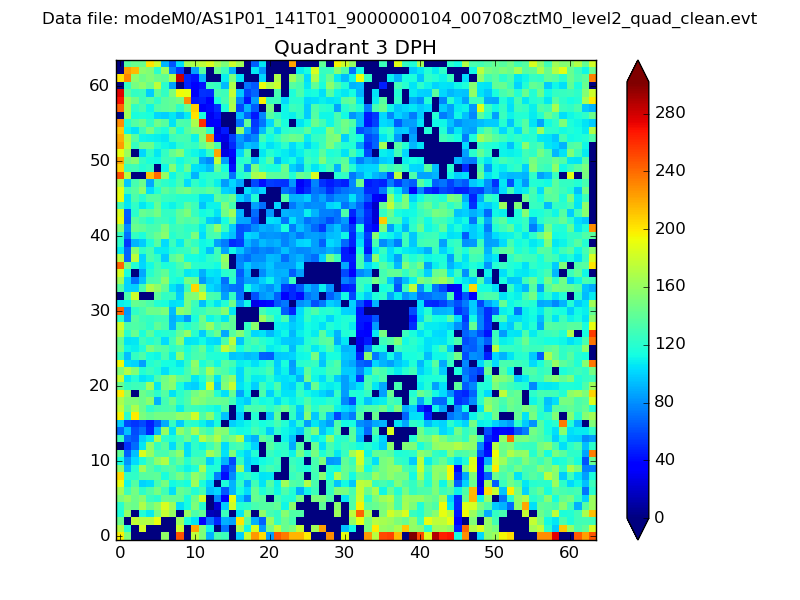 |
 |
Quadrant C |
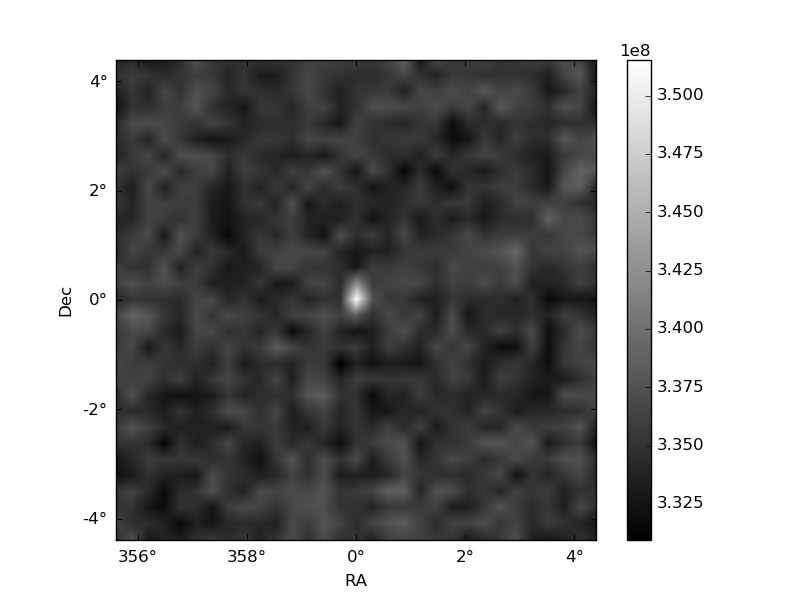
| Plot type | Count rate plots | Images |
|---|---|---|
| Comparison with Poisson distribution Blue bars denote a histogram of data divided into 1 sec bins. Red curve is a Poisson curve with rate = median count rate of data. |
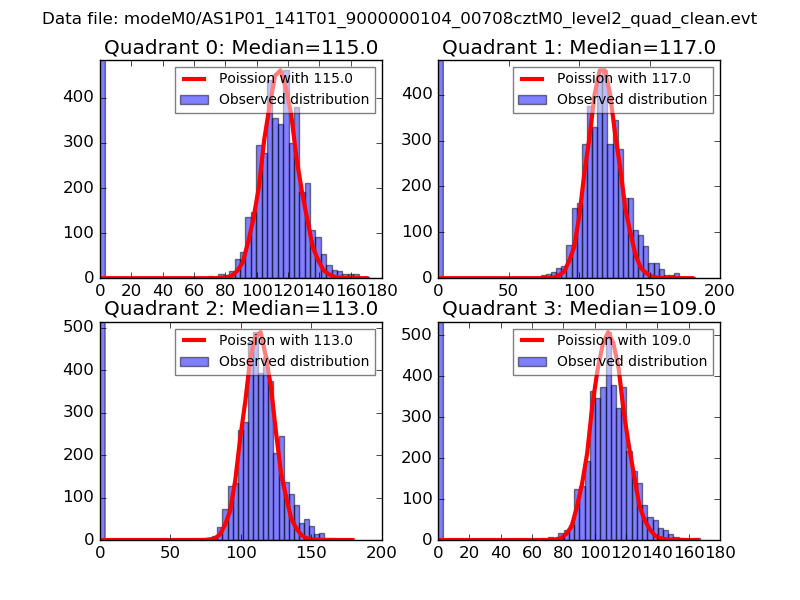 |
 |
| Quadrant-wise count rates Data is divided into 100 sec bins |
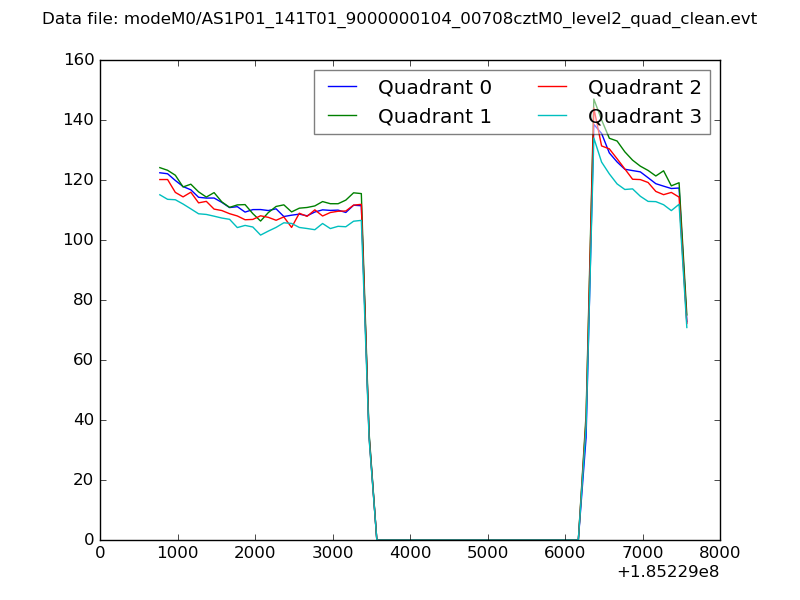 |
|
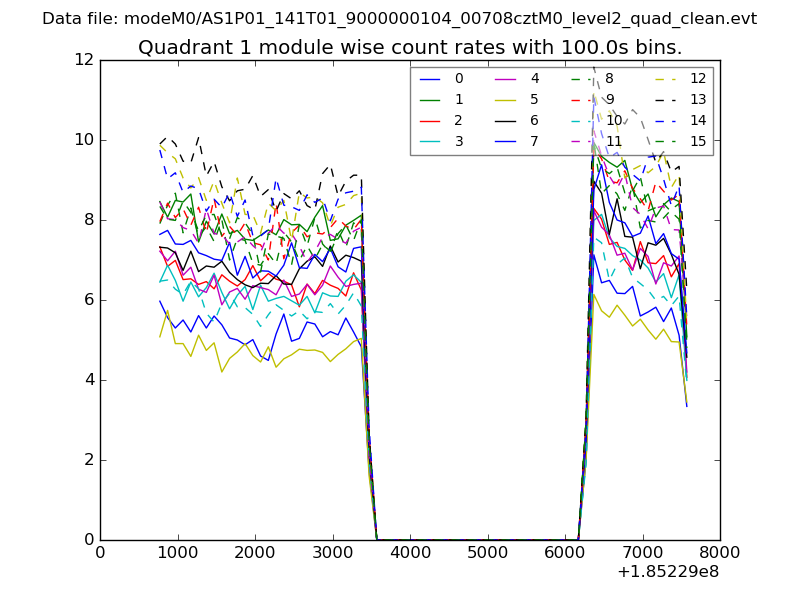
| Module-wise count rates for Quadrant A Data is divided into 100 sec bins |
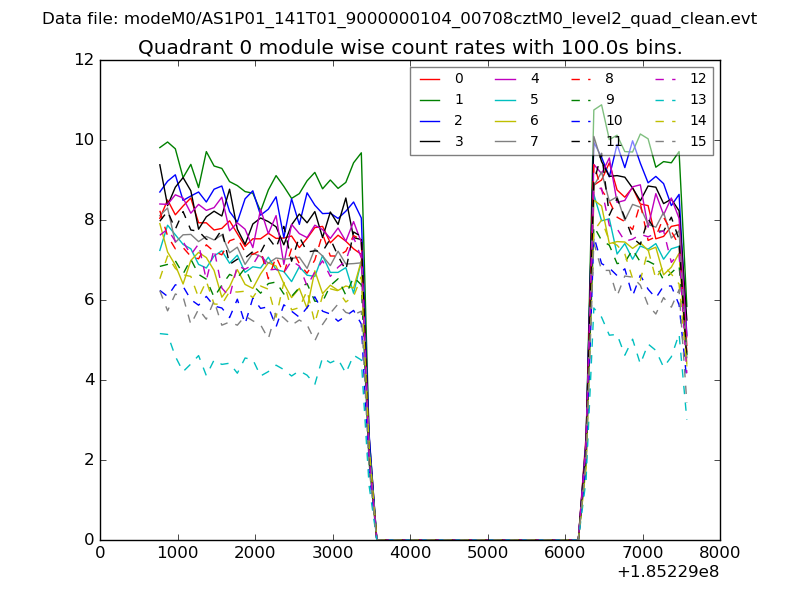 |
 |
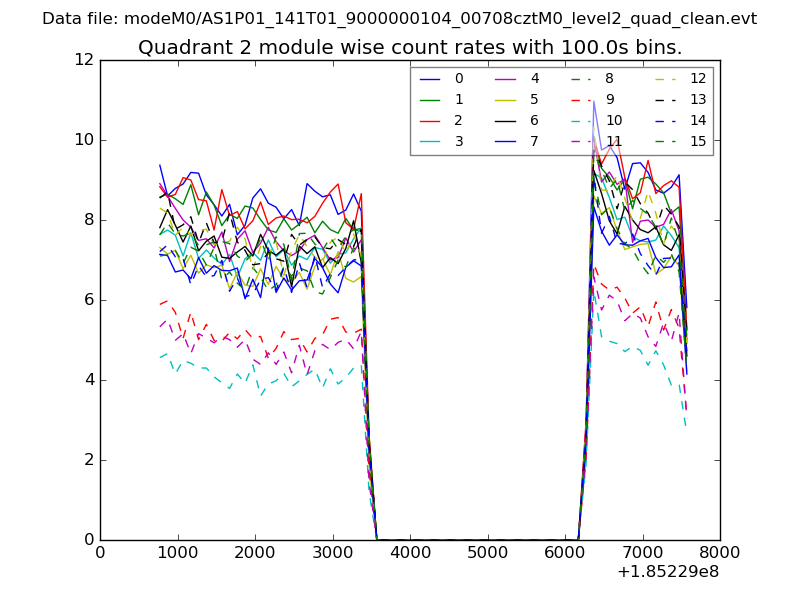
| Module-wise count rates for Quadrant B Data is divided into 100 sec bins |
 |
 |
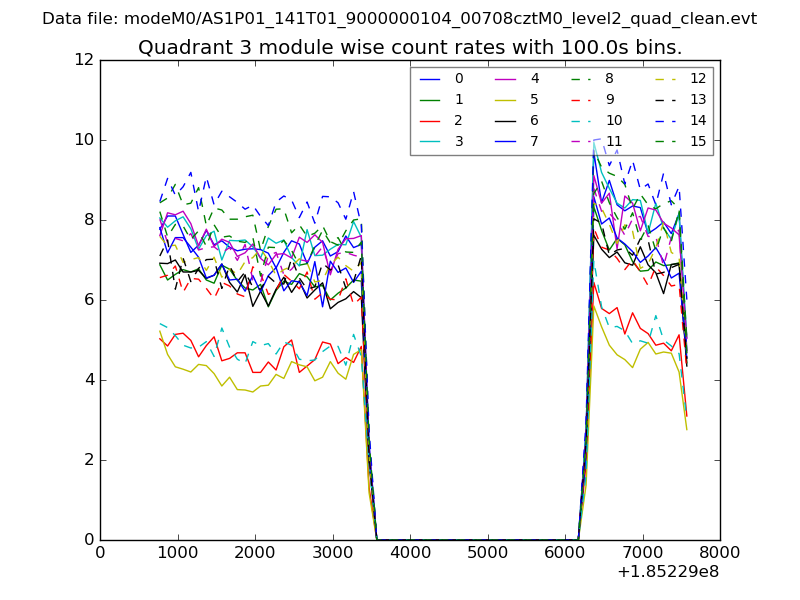
| Module-wise count rates for Quadrant C Data is divided into 100 sec bins |
 |
 |
| Module-wise count rates for Quadrant D Data is divided into 100 sec bins |
 |
 |
| Parameter | Plot |
|---|---|
| CZT HV Monitor | 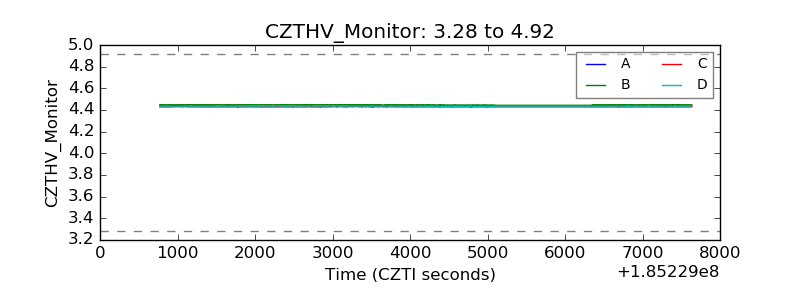 |
| D_VDD | 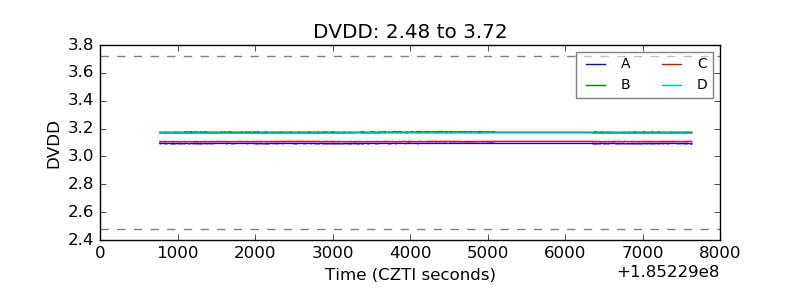 |
| Temperature 1 | 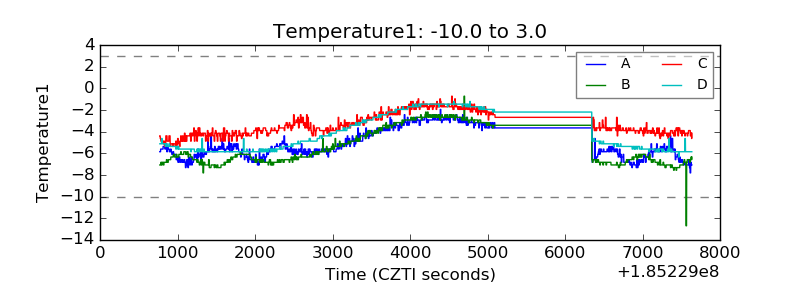 |
| Veto HV Monitor | 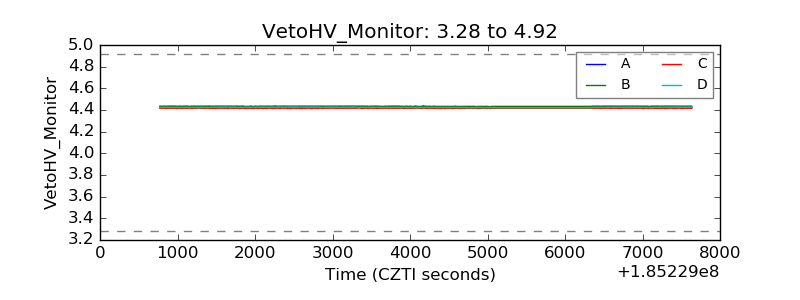 |
| Veto LLD | 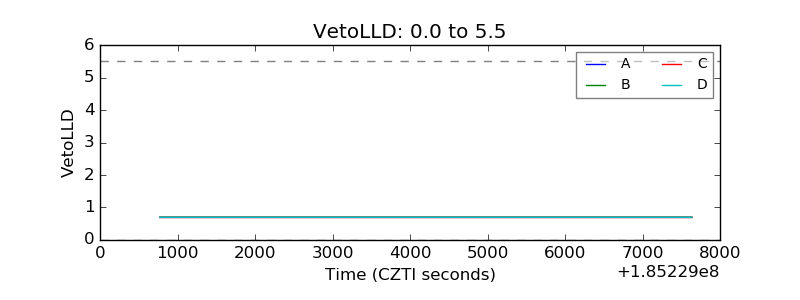 |
| Alpha Counter | 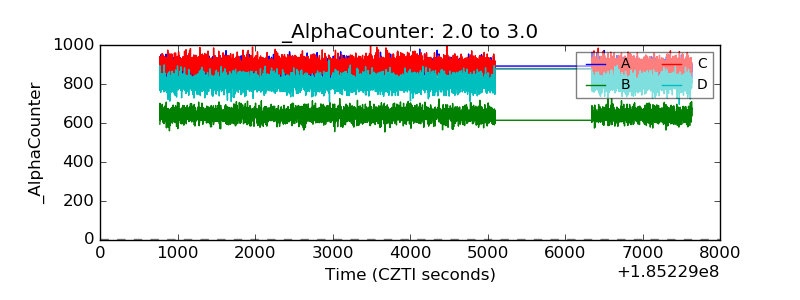 |
| _CPM_Rate | 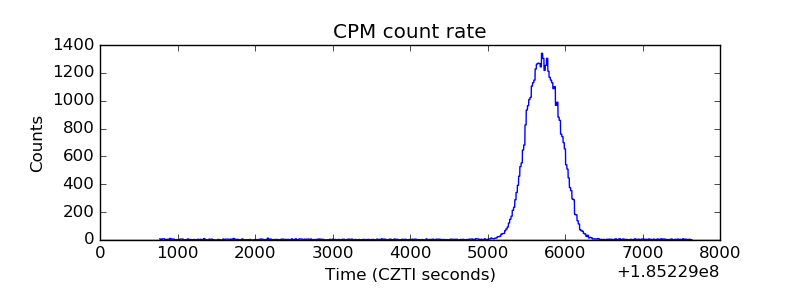 |
| CZT Counter | 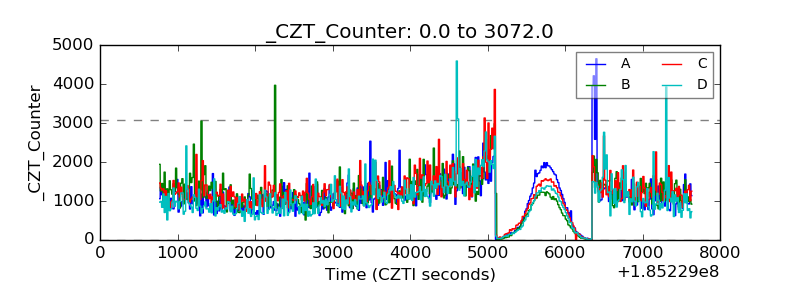 |
| +2.5 Volts monitor |  |
| +5 Volts monitor |  |
| _ROLL_ROT | 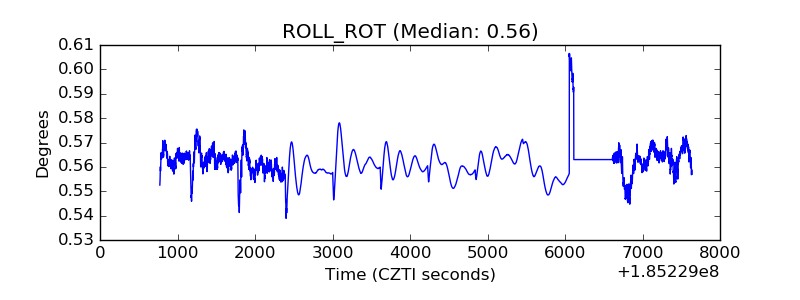 |
| _Roll_DEC | 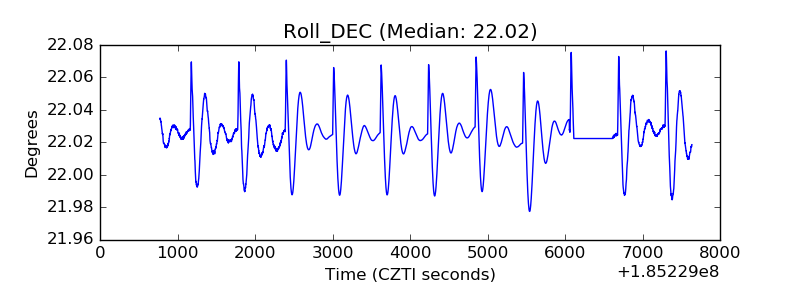 |
| _Roll_RA | 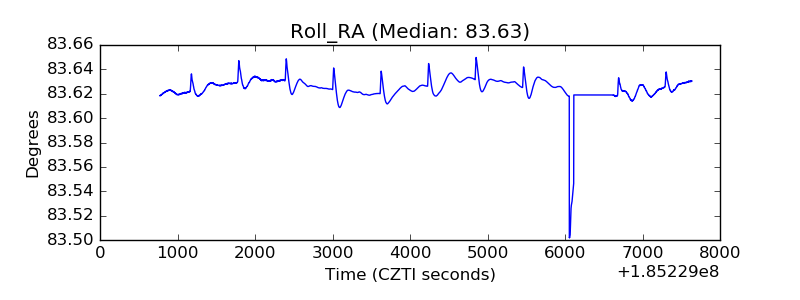 |
| Veto Counter | 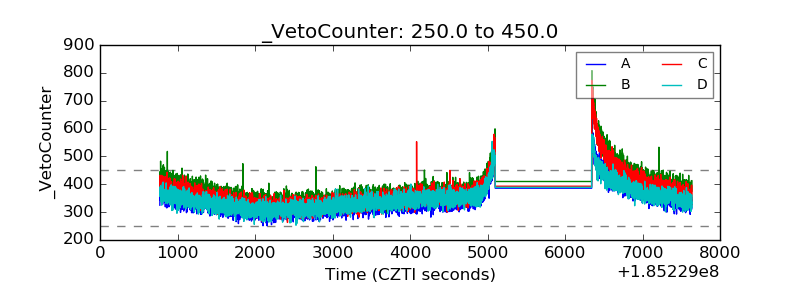 |