| Param | Original file | Final file |
|---|---|---|
| Filename | modeM0/AS1P01_141T01_9000000104_00710cztM0_level2.evt | modeM0/AS1P01_141T01_9000000104_00710cztM0_level2_quad_clean.evt |
| Size (bytes) | 1,002,625,920 | 69,598,080 |
| Size | 956.2 MB | 66.4 MB |
| Events in quadrant A | 7,748,623 | 426,835 |
| Events in quadrant B | 7,494,806 | 433,003 |
| Events in quadrant C | 7,980,639 | 421,835 |
| Events in quadrant D | 6,740,655 | 404,205 |
| Mode M9 | |||
|---|---|---|---|
| Quadrant | BADHDUFLAG | Total packets | Discarded packets |
| A | 0 | 11 | 0 |
| B | 0 | 11 | 0 |
| C | 0 | 11 | 0 |
| D | 0 | 11 | 0 |
| Mode M0 | |||
|---|---|---|---|
| Quadrant | BADHDUFLAG | Total packets | Discarded packets |
| A | 0 | 27322 | 1 |
| B | 0 | 26536 | 1 |
| C | 0 | 27970 | 1 |
| D | 0 | 24303 | 1 |
| Mode SS | |||
|---|---|---|---|
| Quadrant | BADHDUFLAG | Total packets | Discarded packets |
| A | 0 | 124 | 0 |
| B | 0 | 124 | 0 |
| C | 0 | 124 | 0 |
| D | 0 | 124 | 0 |
| Quadrant | Total seconds | Saturated seconds | Saturation percentage |
|---|---|---|---|
| A | 6029 | 183 | 3.035329% |
| B | 6029 | 24 | 0.398076% |
| C | 6030 | 8 | 0.132670% |
| D | 6030 | 46 | 0.762852% |
Noise dominated data is calculated using 1-second bins in cleaned event files. If a bin has >2000 counts, and if more than 50% of those come from <1% of pixels, then it is considered to be noise-dominated and hence unusable.
| Quadrant | # 1 sec bins | Bins with >0 counts | Bins with >2000 counts | High rate bins dominated by noise | Noise dominated (total time) | Noise dominated (detector-on time) | Marked lightcurve |
|---|---|---|---|---|---|---|---|
| A | 7179 | 6030 | 524 | 524 | 7.30% | 8.69% | 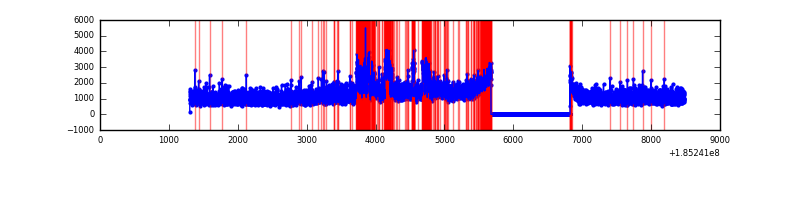 |
| B | 7179 | 6030 | 265 | 265 | 3.69% | 4.39% | 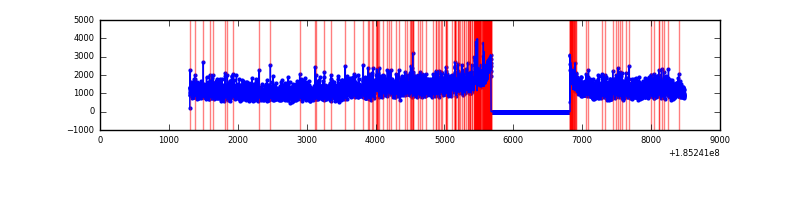 |
| C | 7180 | 6031 | 281 | 281 | 3.91% | 4.66% | 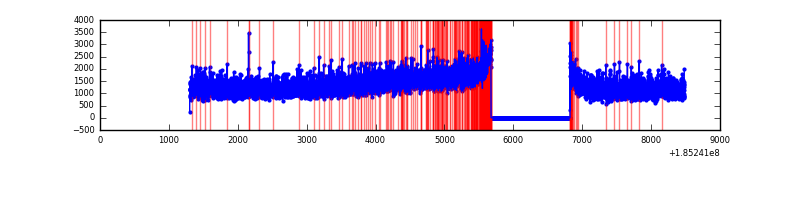 |
| D | 7180 | 6031 | 248 | 248 | 3.45% | 4.11% | 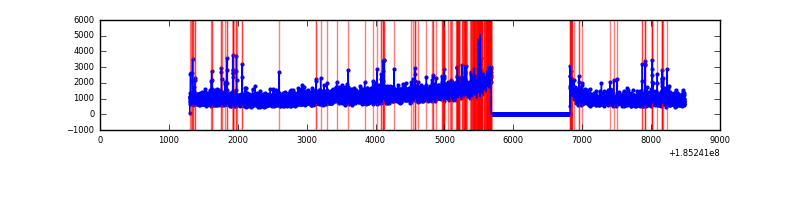 |
Top three noisy pixels from each quadrant. If the there are fewer than three noisy pixels in the level2.evt file, extra rows are filled as -1
| Pixel properties | Quadrant properties | ||||||
|---|---|---|---|---|---|---|---|
| Quadrant | DetID | PixID | Counts | Sigma | Mean | Median | Sigma |
| A | 15 | 171 | 851291 | 1964.7 | 1798 | 1818 | 432.4 |
| A | 11 | 79 | 5333 | 8.13 | 1798 | 1818 | 432.4 |
| A | 3 | 111 | 5320 | 8.1 | 1798 | 1818 | 432.4 |
| B | 5 | 247 | 220467 | 498.89 | 1870 | 1886 | 438.1 |
| B | 5 | 191 | 80655 | 179.78 | 1870 | 1886 | 438.1 |
| B | 7 | 221 | 29152 | 62.23 | 1870 | 1886 | 438.1 |
| C | 3 | 31 | 290387 | 612.89 | 1692 | 1763 | 470.9 |
| C | 3 | 95 | 251716 | 530.77 | 1692 | 1763 | 470.9 |
| C | 3 | 15 | 239031 | 503.84 | 1692 | 1763 | 470.9 |
| D | 0 | 25 | 195950 | 383.51 | 1640 | 1700 | 506.5 |
| D | 1 | 4 | 194409 | 380.47 | 1640 | 1700 | 506.5 |
| D | 6 | 226 | 124793 | 243.02 | 1640 | 1700 | 506.5 |
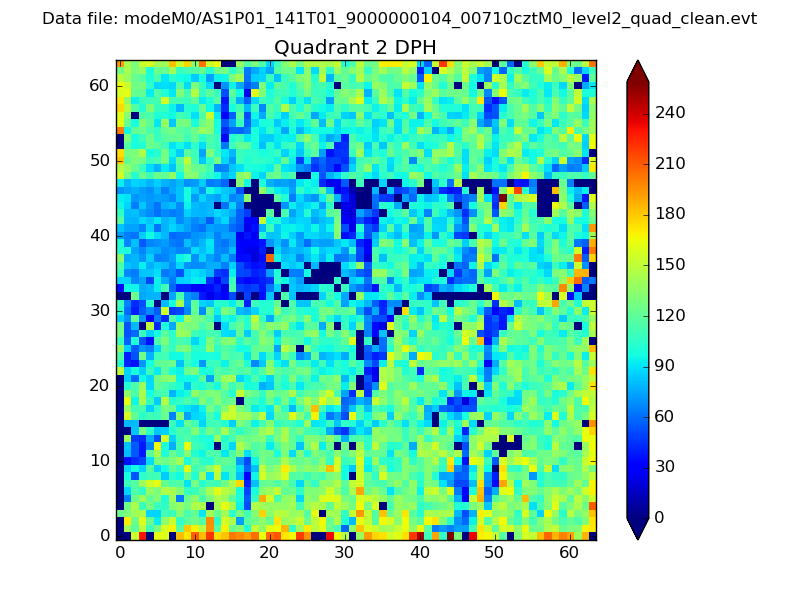
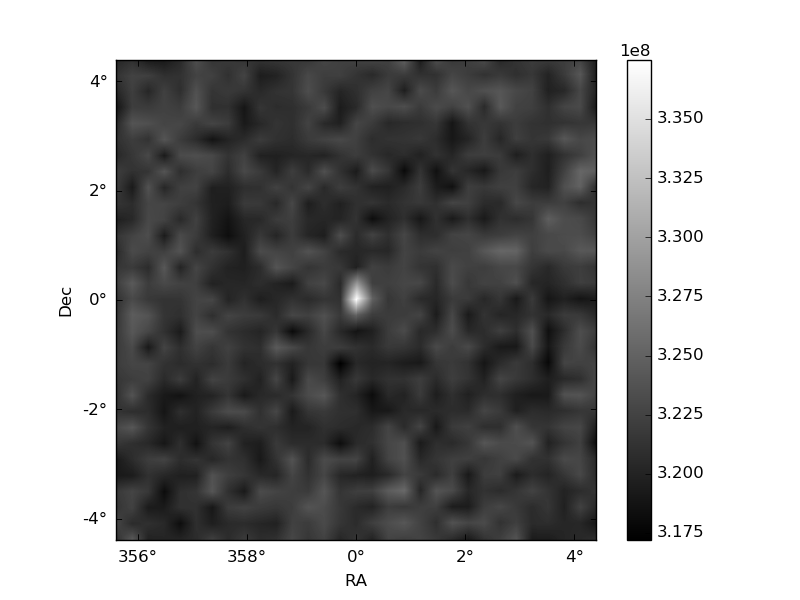
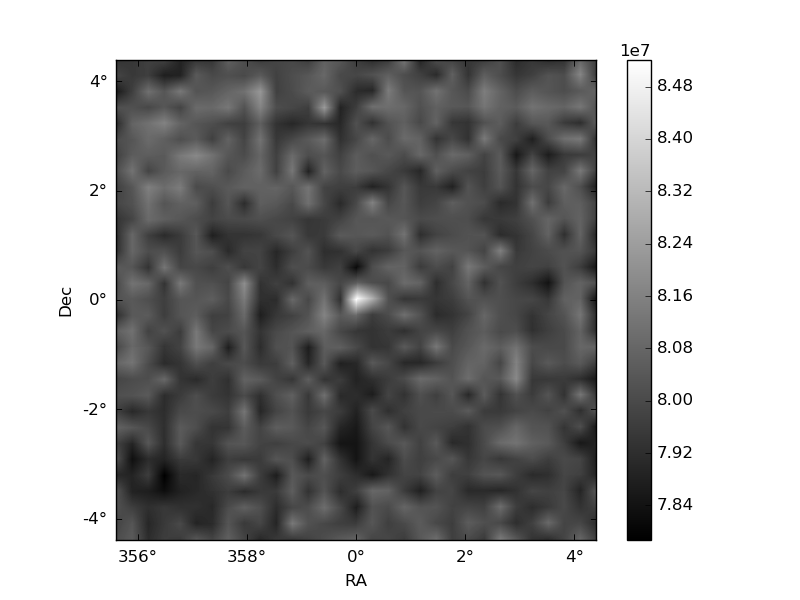
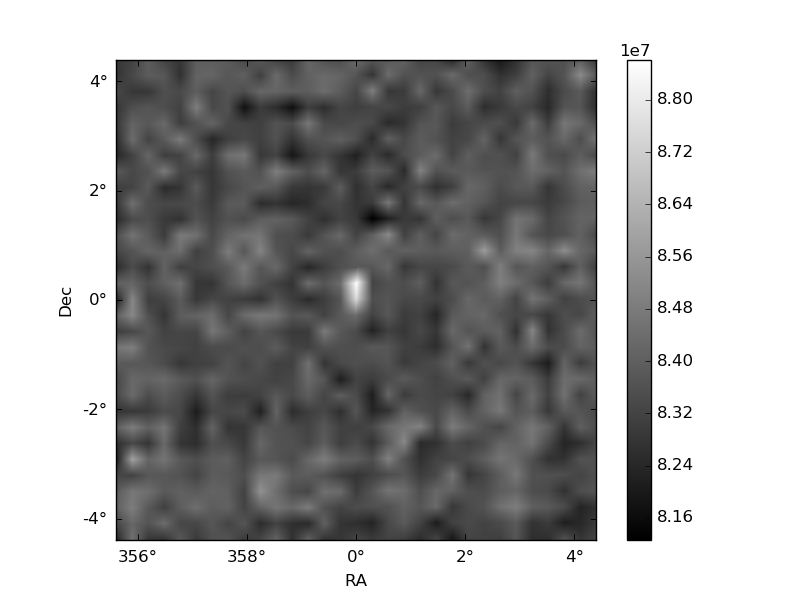
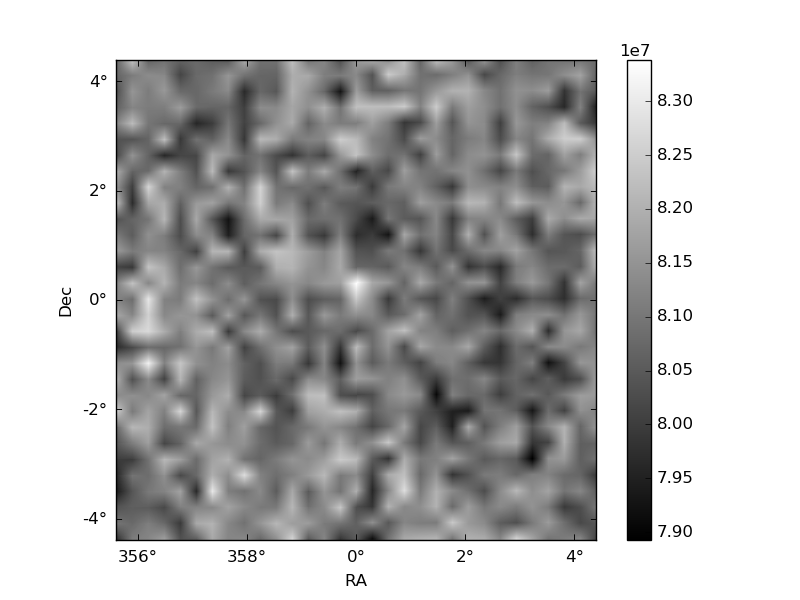
Histogram calculated using DETX and DETY for each event in the final _common_clean file
| Quadrant A | 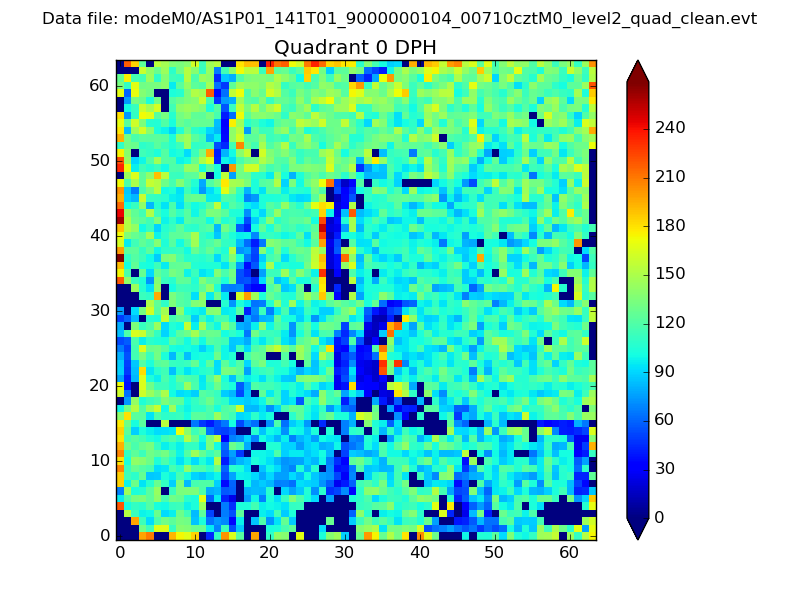 |
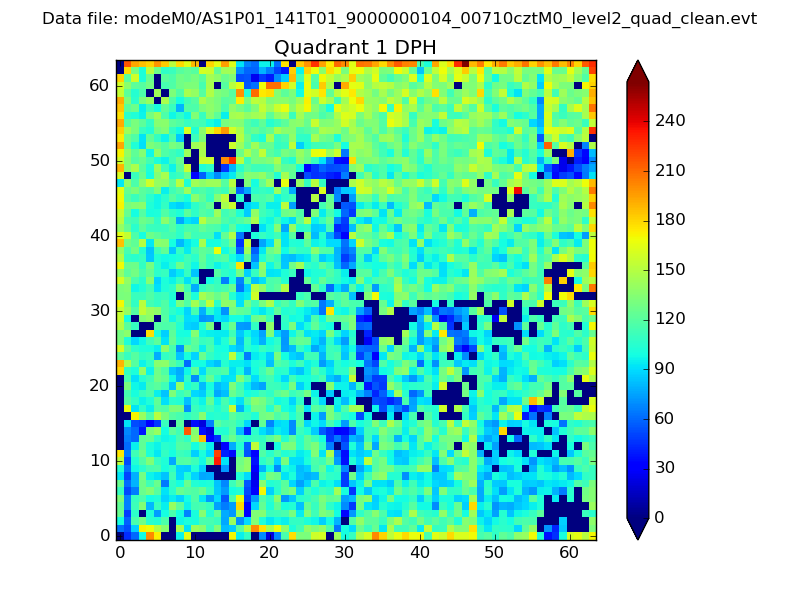 |
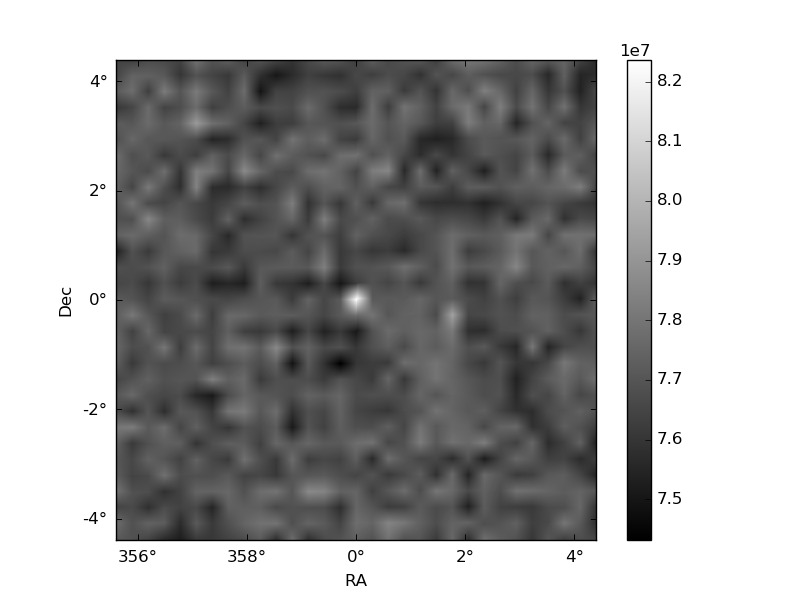
Quadrant B |
|---|---|---|---|
| Quadrant D | 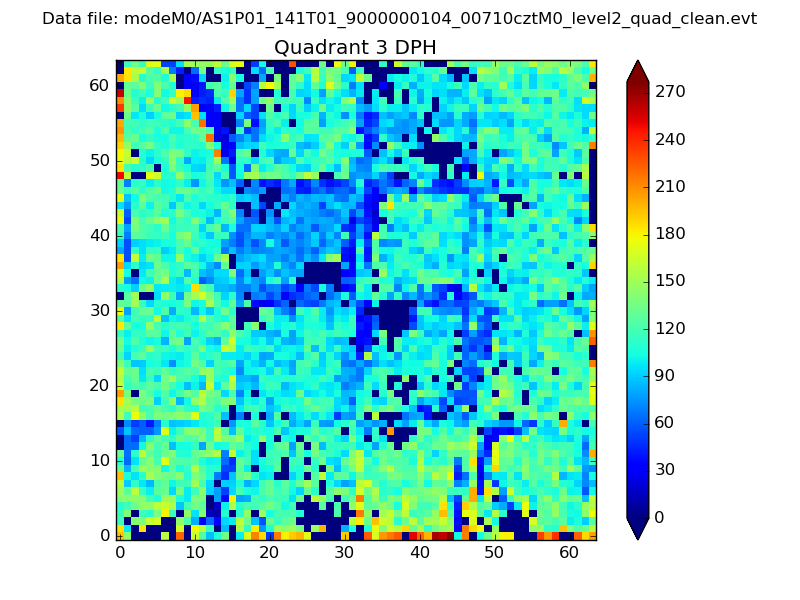 |
 |
Quadrant C |
| Plot type | Count rate plots | Images |
|---|---|---|
| Comparison with Poisson distribution Blue bars denote a histogram of data divided into 1 sec bins. Red curve is a Poisson curve with rate = median count rate of data. |
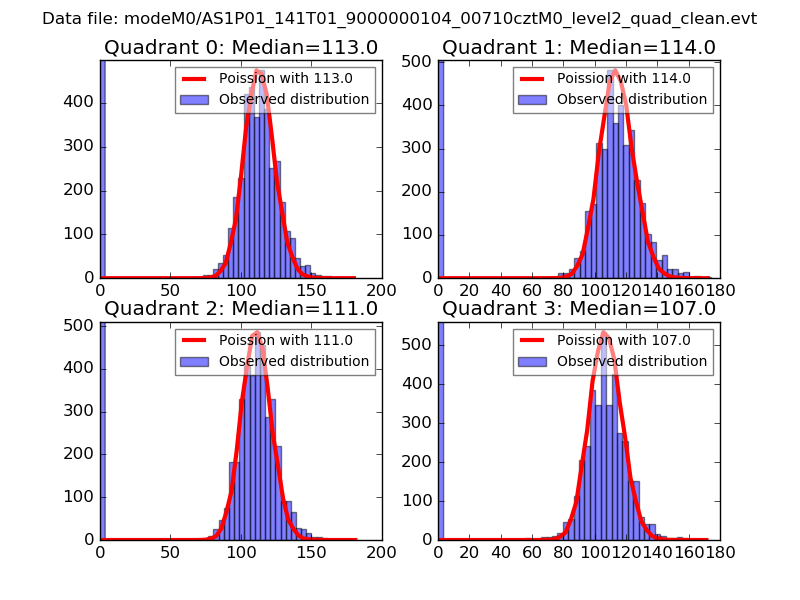 |
 |
| Quadrant-wise count rates Data is divided into 100 sec bins |
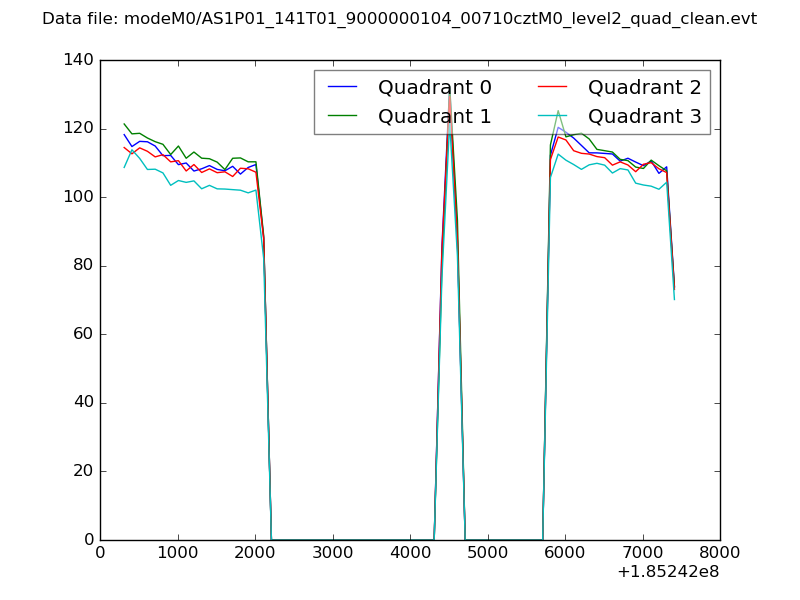 |
|
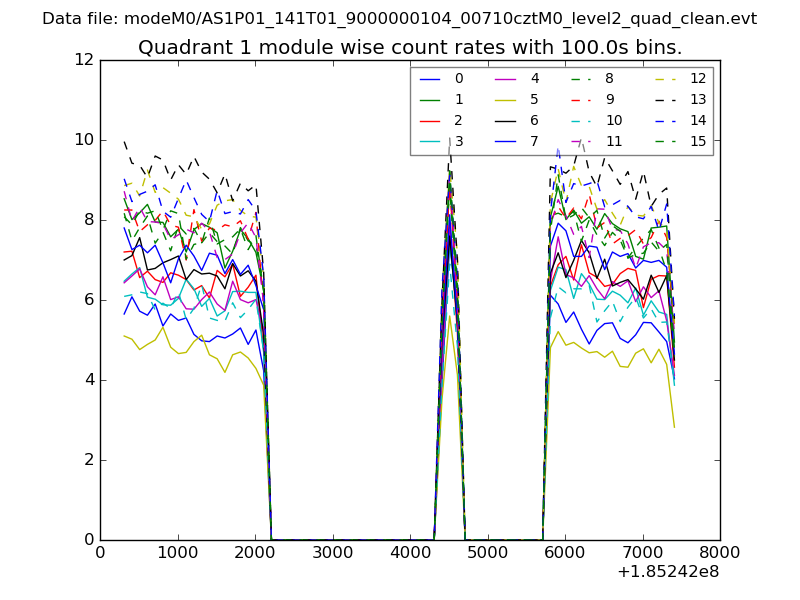
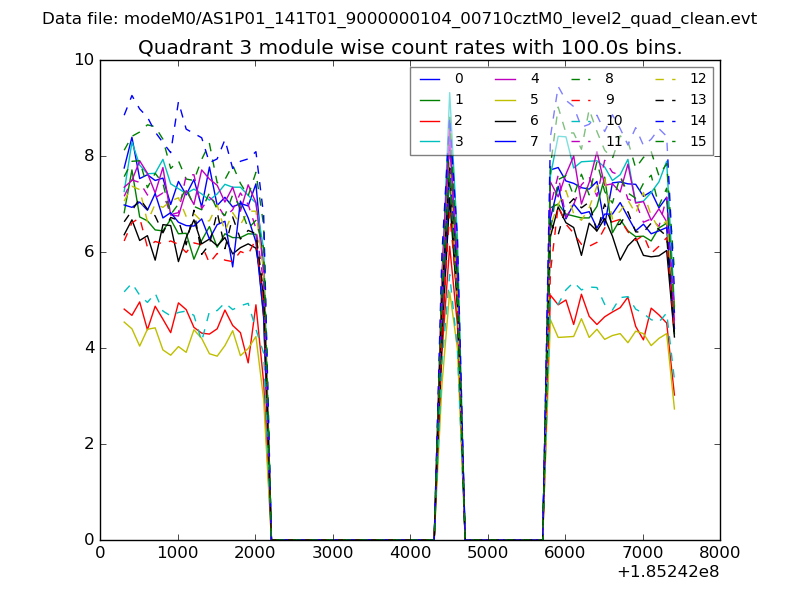
| Module-wise count rates for Quadrant A Data is divided into 100 sec bins |
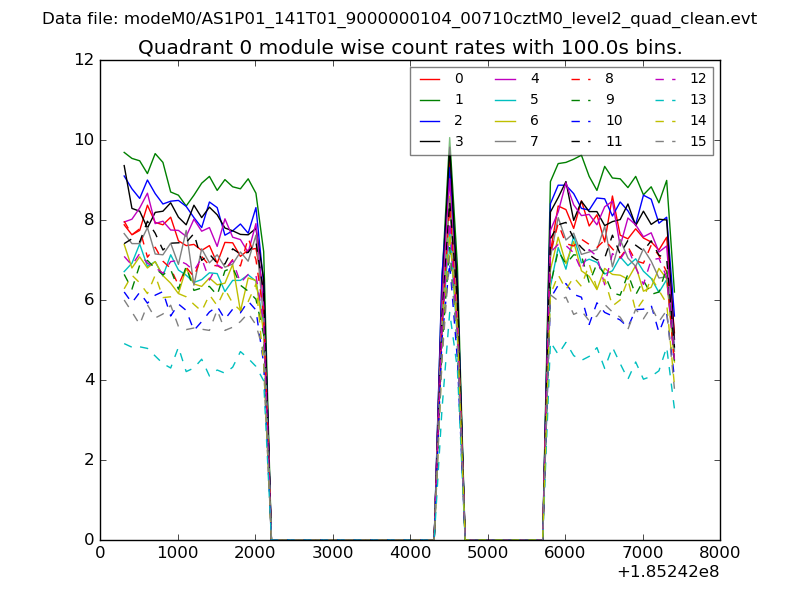 |
 |
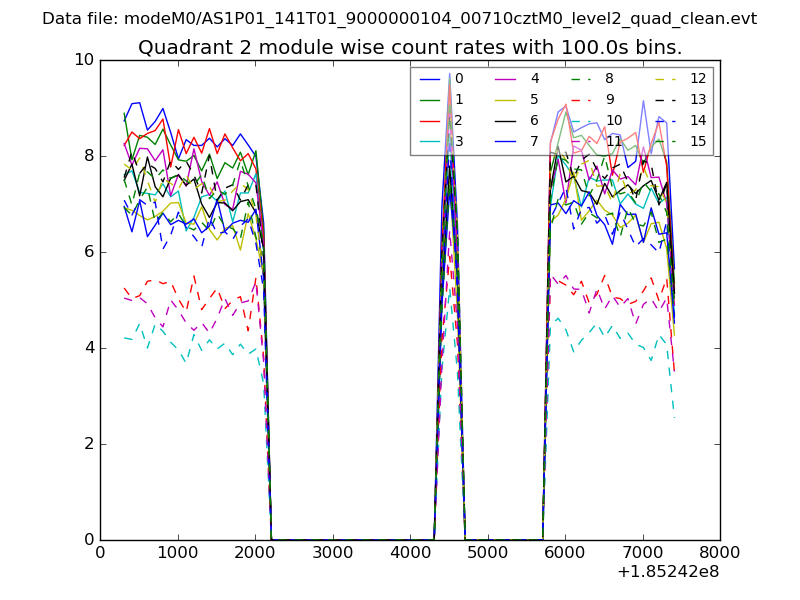
| Module-wise count rates for Quadrant B Data is divided into 100 sec bins |
 |
 |
| Module-wise count rates for Quadrant C Data is divided into 100 sec bins |
 |
 |
| Module-wise count rates for Quadrant D Data is divided into 100 sec bins |
 |
 |
| Parameter | Plot |
|---|---|
| CZT HV Monitor | 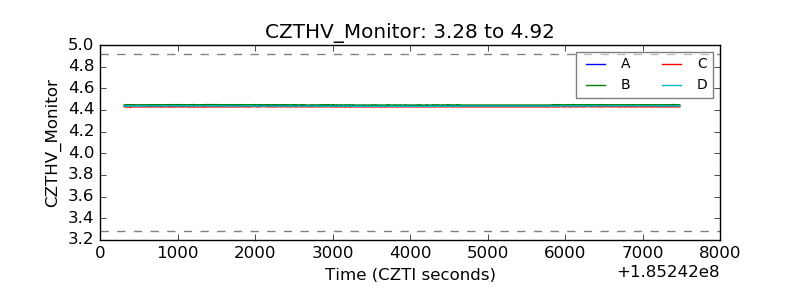 |
| D_VDD | 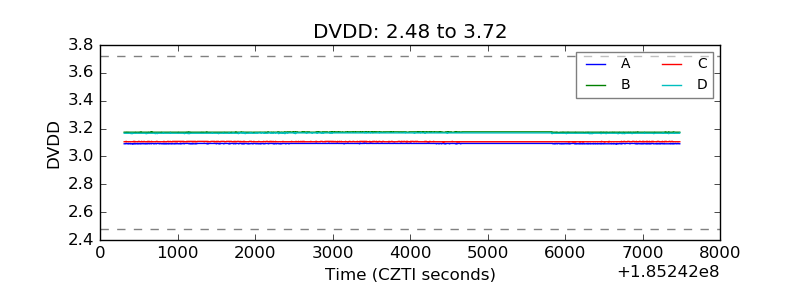 |
| Temperature 1 | 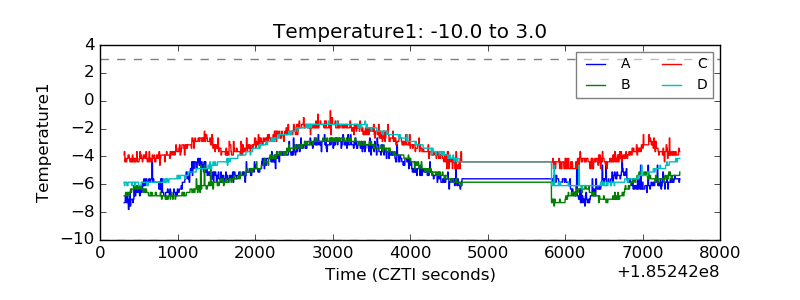 |
| Veto HV Monitor | 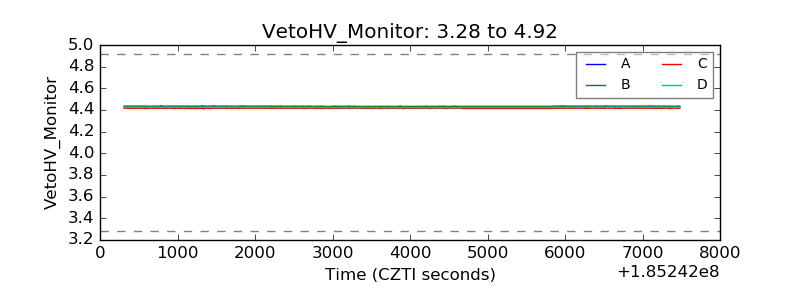 |
| Veto LLD | 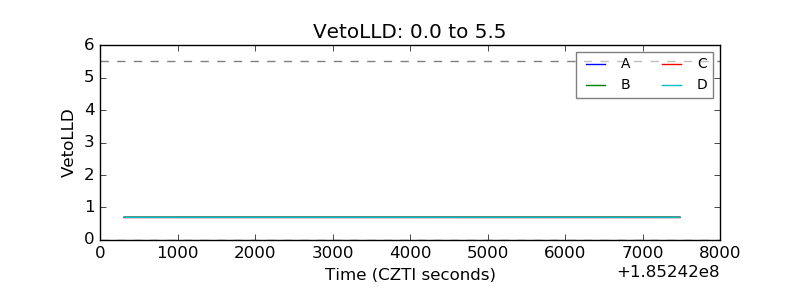 |
| Alpha Counter | 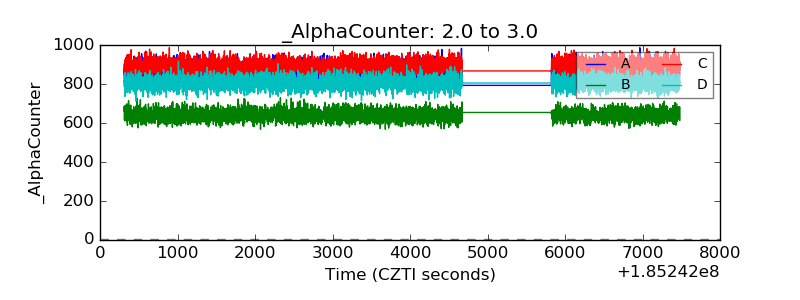 |
| _CPM_Rate |  |
| CZT Counter | 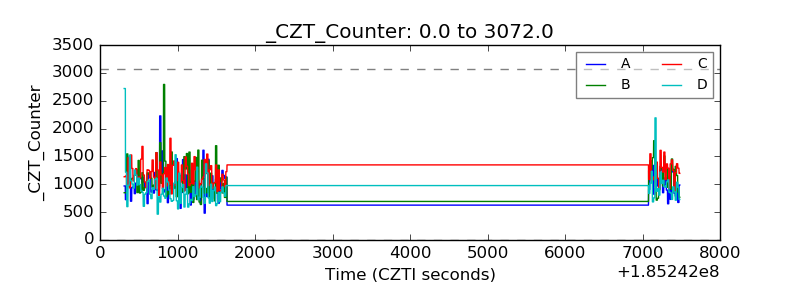 |
| +2.5 Volts monitor |  |
| +5 Volts monitor |  |
| _ROLL_ROT | 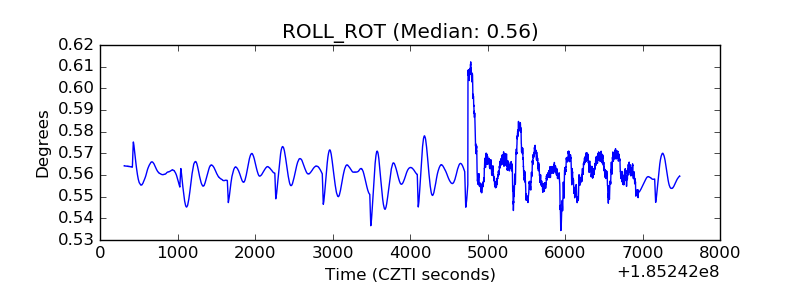 |
| _Roll_DEC | 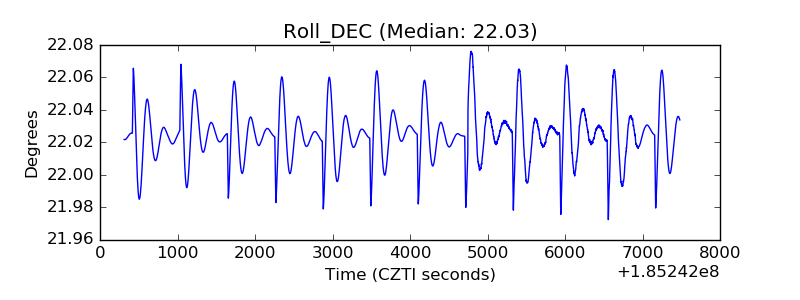 |
| _Roll_RA | 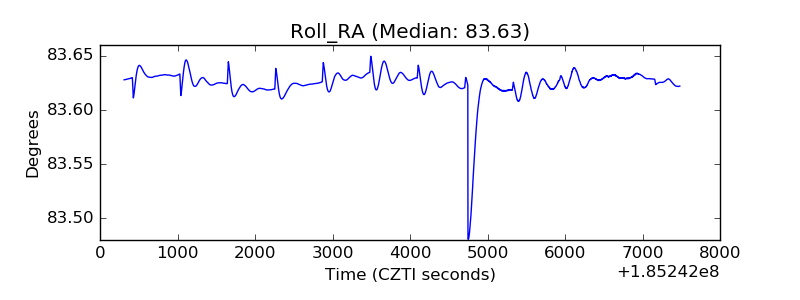 |
| Veto Counter | 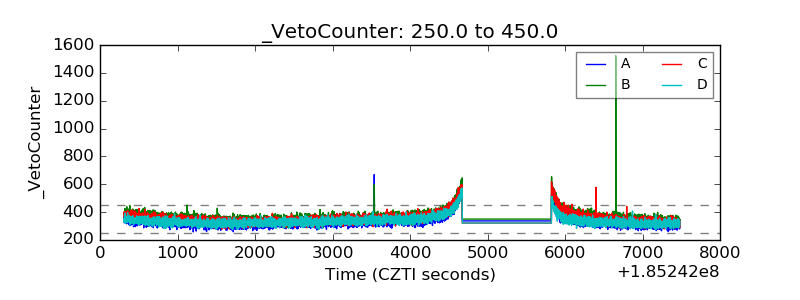 |