| Param | Original file | Final file |
|---|---|---|
| Filename | modeM0/AS1P01_141T01_9000000104_00712cztM0_level2.evt | modeM0/AS1P01_141T01_9000000104_00712cztM0_level2_quad_clean.evt |
| Size (bytes) | 1,146,968,640 | 76,786,560 |
| Size | 1.1 GB | 73.2 MB |
| Events in quadrant A | 7,926,009 | 469,277 |
| Events in quadrant B | 9,287,804 | 473,176 |
| Events in quadrant C | 8,855,306 | 465,153 |
| Events in quadrant D | 8,218,288 | 444,600 |
| Mode M9 | |||
|---|---|---|---|
| Quadrant | BADHDUFLAG | Total packets | Discarded packets |
| A | 0 | 9 | 0 |
| B | 0 | 9 | 0 |
| C | 0 | 9 | 0 |
| D | 0 | 9 | 0 |
| Mode M0 | |||
|---|---|---|---|
| Quadrant | BADHDUFLAG | Total packets | Discarded packets |
| A | 0 | 28425 | 1 |
| B | 0 | 32395 | 1 |
| C | 0 | 31143 | 1 |
| D | 0 | 29231 | 1 |
| Mode SS | |||
|---|---|---|---|
| Quadrant | BADHDUFLAG | Total packets | Discarded packets |
| A | 0 | 138 | 0 |
| B | 0 | 138 | 0 |
| C | 0 | 138 | 0 |
| D | 0 | 138 | 0 |
| Quadrant | Total seconds | Saturated seconds | Saturation percentage |
|---|---|---|---|
| A | 6784 | 8 | 0.117925% |
| B | 6784 | 12 | 0.176887% |
| C | 6784 | 13 | 0.191627% |
| D | 6784 | 78 | 1.149764% |
Noise dominated data is calculated using 1-second bins in cleaned event files. If a bin has >2000 counts, and if more than 50% of those come from <1% of pixels, then it is considered to be noise-dominated and hence unusable.
| Quadrant | # 1 sec bins | Bins with >0 counts | Bins with >2000 counts | High rate bins dominated by noise | Noise dominated (total time) | Noise dominated (detector-on time) | Marked lightcurve |
|---|---|---|---|---|---|---|---|
| A | 7689 | 6785 | 179 | 179 | 2.33% | 2.64% | 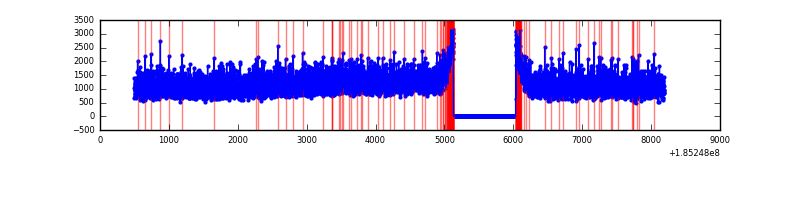 |
| B | 7689 | 6785 | 483 | 483 | 6.28% | 7.12% | 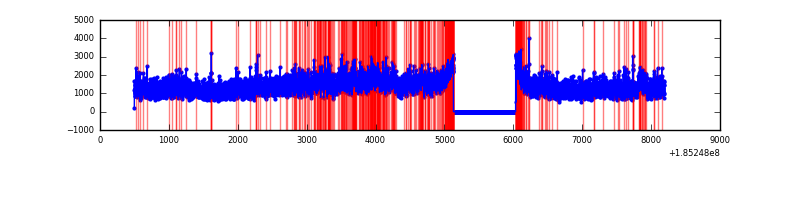 |
| C | 7689 | 6785 | 297 | 297 | 3.86% | 4.38% | 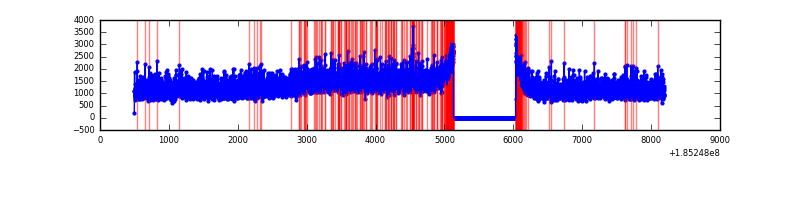 |
| D | 7689 | 6785 | 457 | 457 | 5.94% | 6.74% | 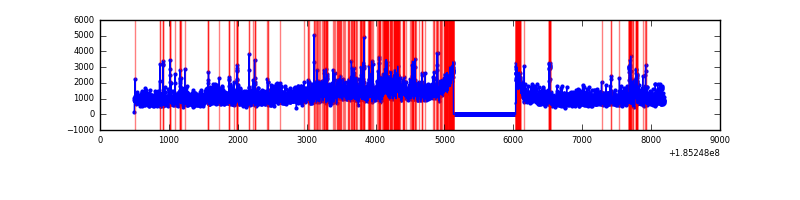 |
Top three noisy pixels from each quadrant. If the there are fewer than three noisy pixels in the level2.evt file, extra rows are filled as -1
| Pixel properties | Quadrant properties | ||||||
|---|---|---|---|---|---|---|---|
| Quadrant | DetID | PixID | Counts | Sigma | Mean | Median | Sigma |
| A | 11 | 79 | 6813 | 9.51 | 2065 | 2082 | 497.6 |
| A | 3 | 111 | 6290 | 8.46 | 2065 | 2082 | 497.6 |
| A | 15 | 69 | 5342 | 6.55 | 2065 | 2082 | 497.6 |
| B | 5 | 247 | 960605 | 1927.35 | 2109 | 2120 | 497.3 |
| B | 0 | 220 | 78372 | 153.33 | 2109 | 2120 | 497.3 |
| B | 14 | 50 | 63639 | 123.7 | 2109 | 2120 | 497.3 |
| C | 3 | 31 | 303211 | 565.3 | 1906 | 1978 | 532.9 |
| C | 3 | 15 | 263716 | 491.18 | 1906 | 1978 | 532.9 |
| C | 3 | 175 | 255154 | 475.11 | 1906 | 1978 | 532.9 |
| D | 0 | 25 | 243055 | 417.47 | 1864 | 1931 | 577.6 |
| D | 11 | 131 | 225329 | 386.78 | 1864 | 1931 | 577.6 |
| D | 7 | 207 | 152876 | 261.34 | 1864 | 1931 | 577.6 |
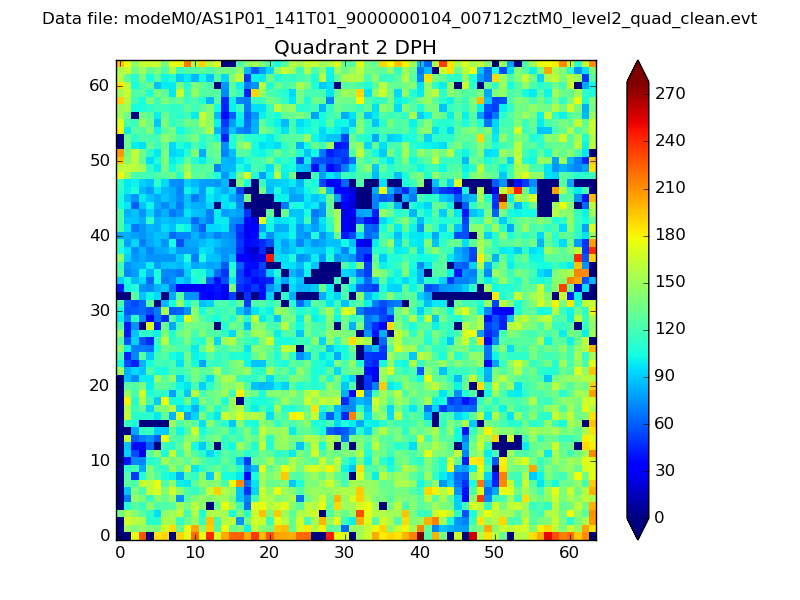
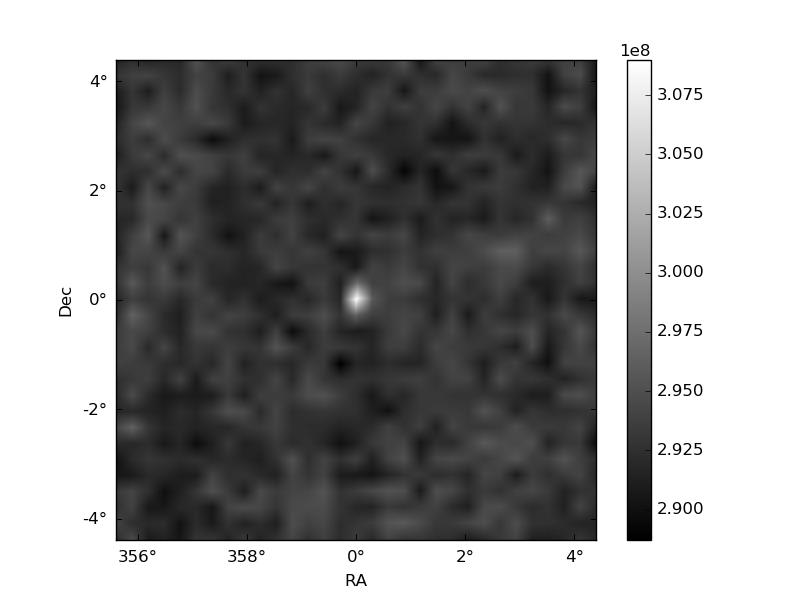
Histogram calculated using DETX and DETY for each event in the final _common_clean file
| Quadrant A | 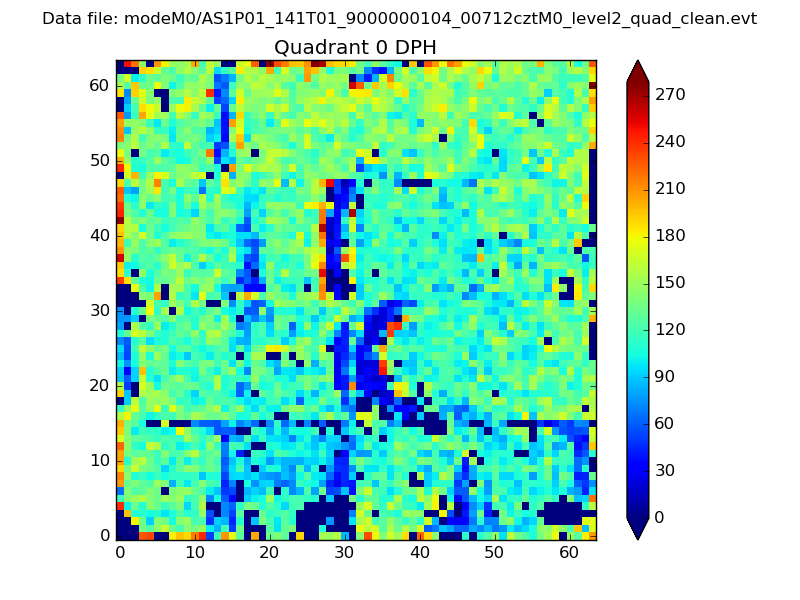 |
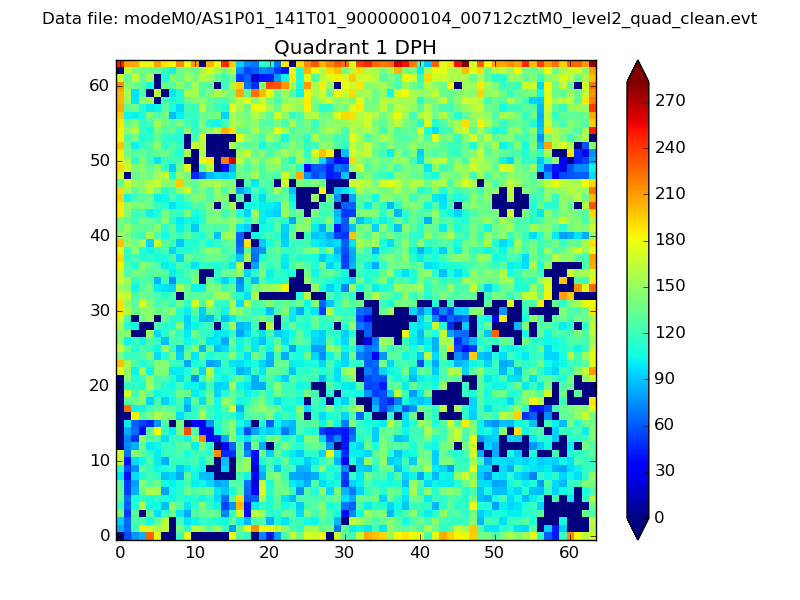 |
Quadrant B |
|---|---|---|---|
| Quadrant D | 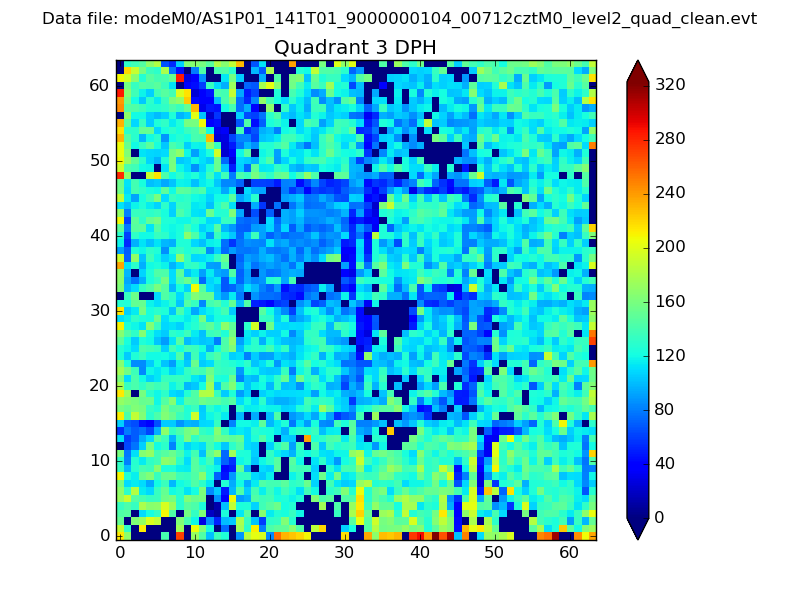 |
 |
Quadrant C |
| Plot type | Count rate plots | Images |
|---|---|---|
| Comparison with Poisson distribution Blue bars denote a histogram of data divided into 1 sec bins. Red curve is a Poisson curve with rate = median count rate of data. |
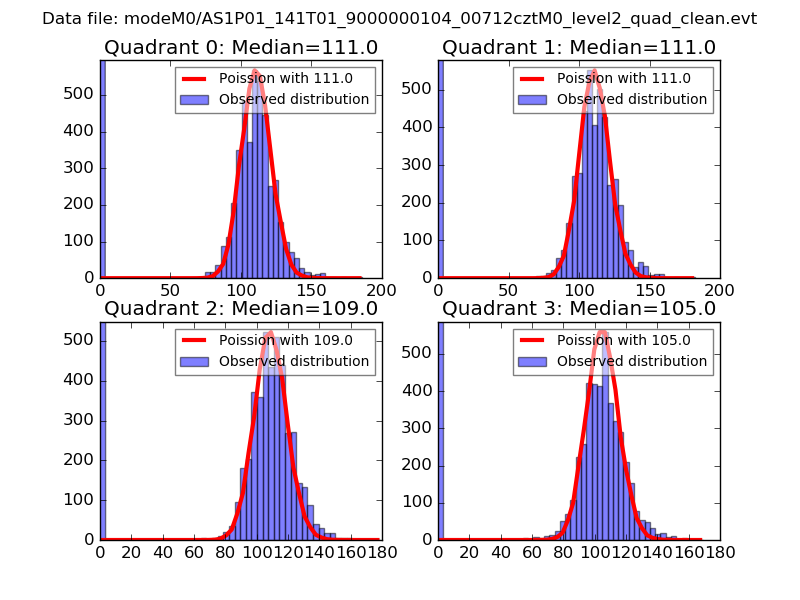 |
 |
| Quadrant-wise count rates Data is divided into 100 sec bins |
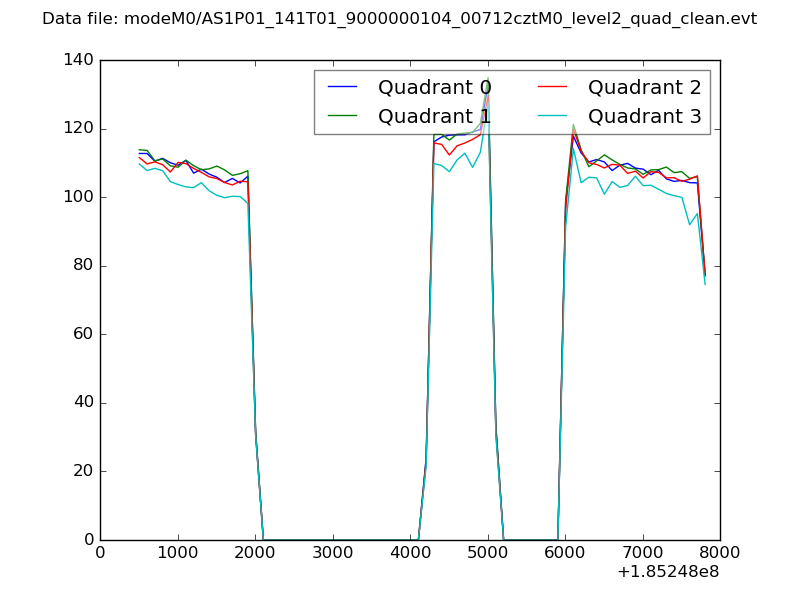 |
|
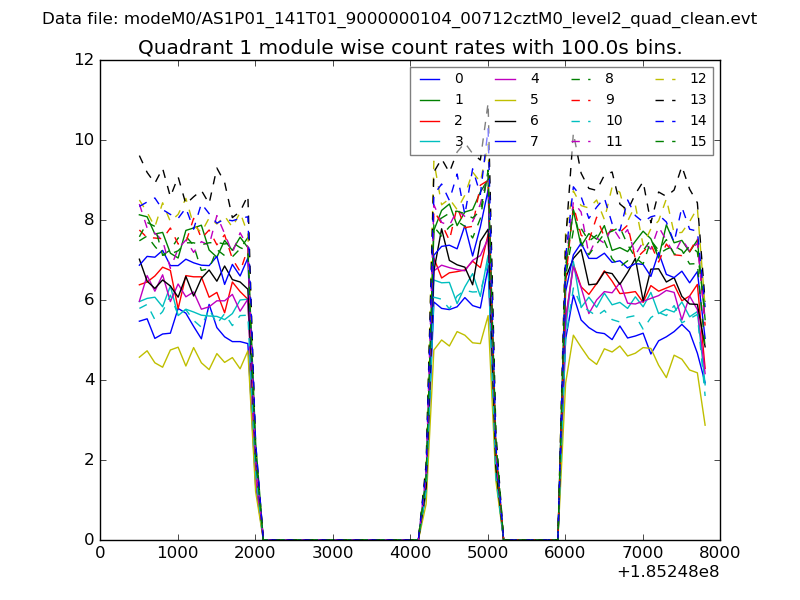
| Module-wise count rates for Quadrant A Data is divided into 100 sec bins |
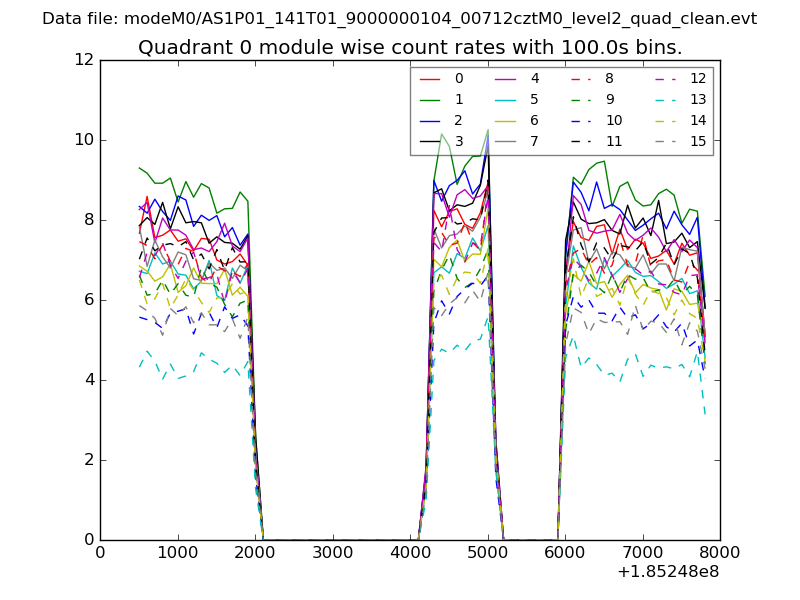 |
 |
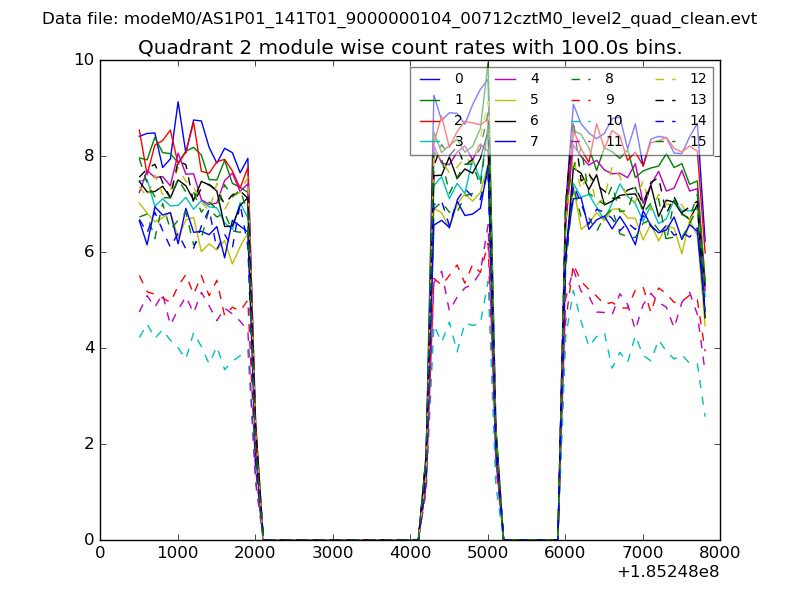
| Module-wise count rates for Quadrant B Data is divided into 100 sec bins |
 |
 |
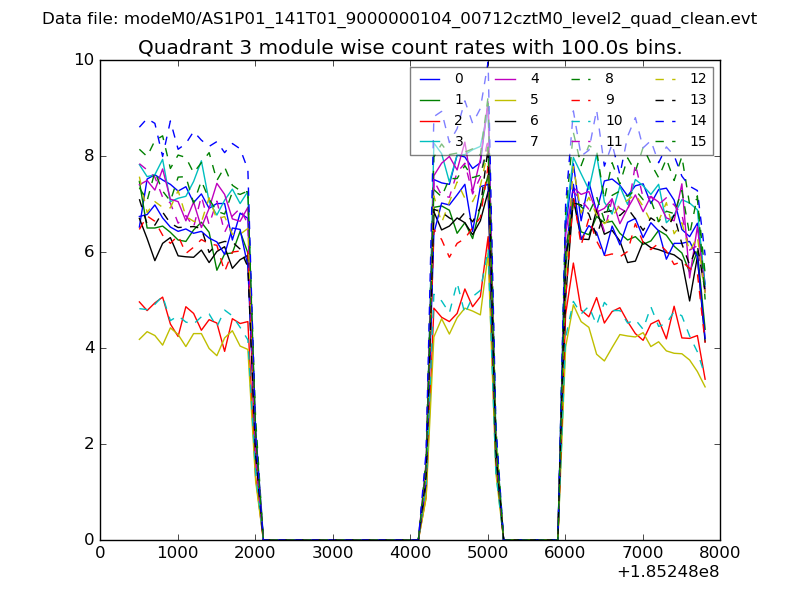
| Module-wise count rates for Quadrant C Data is divided into 100 sec bins |
 |
 |
| Module-wise count rates for Quadrant D Data is divided into 100 sec bins |
 |
 |
| Parameter | Plot |
|---|---|
| CZT HV Monitor | 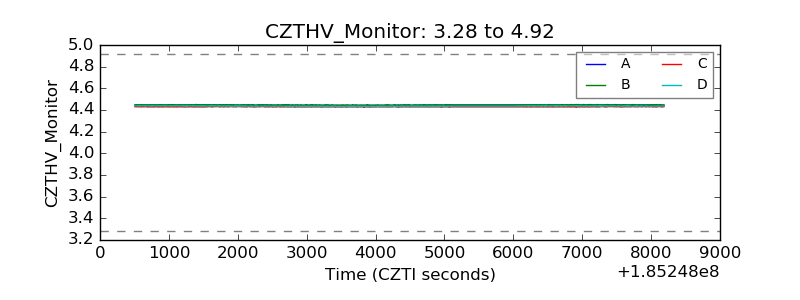 |
| D_VDD |  |
| Temperature 1 | 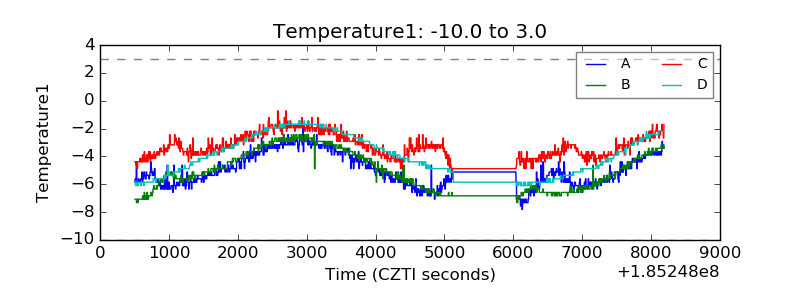 |
| Veto HV Monitor | 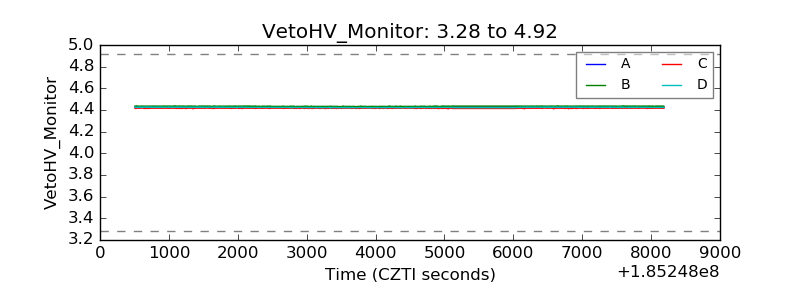 |
| Veto LLD | 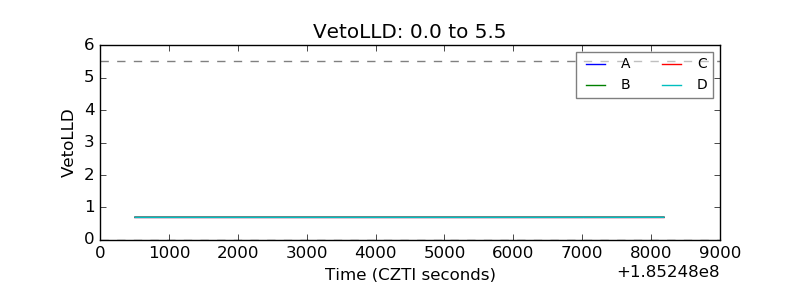 |
| Alpha Counter | 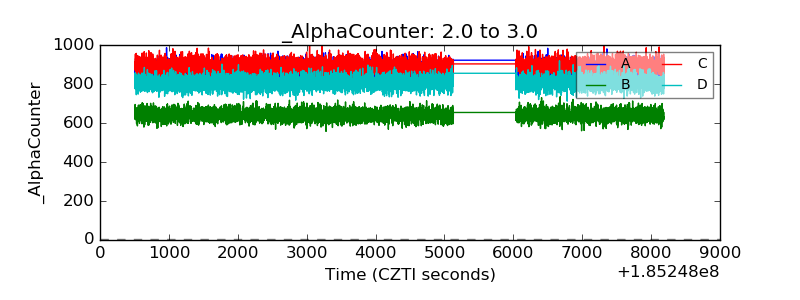 |
| _CPM_Rate | 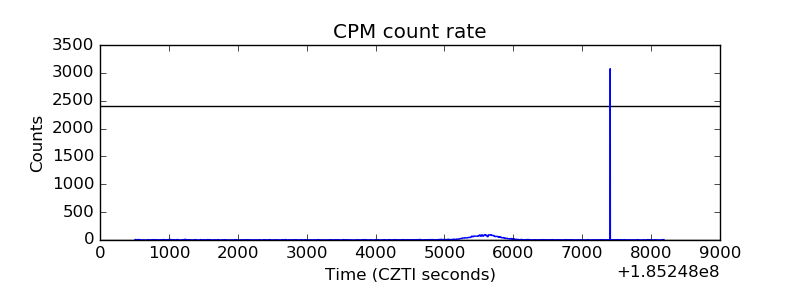 |
| CZT Counter | 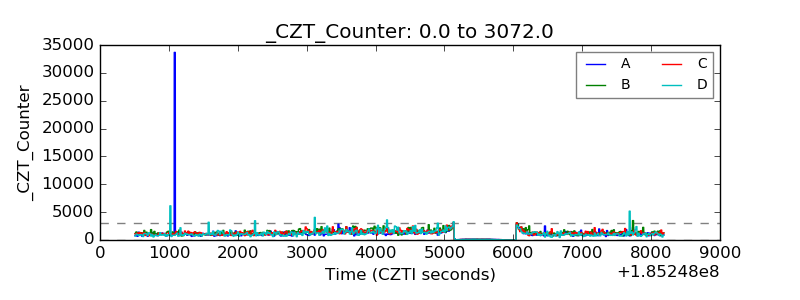 |
| +2.5 Volts monitor |  |
| +5 Volts monitor |  |
| _ROLL_ROT | 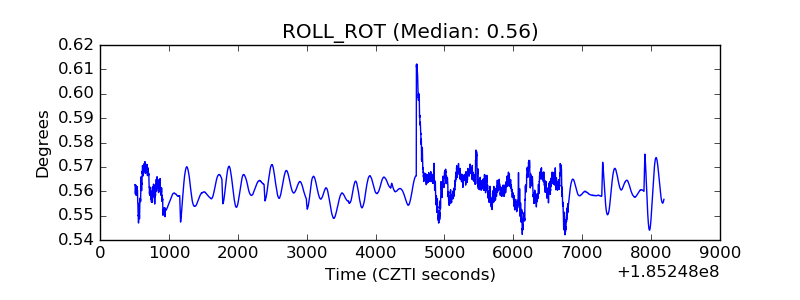 |
| _Roll_DEC | 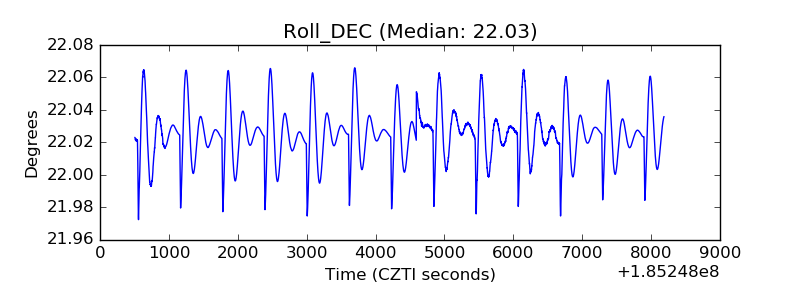 |
| _Roll_RA |  |
| Veto Counter | 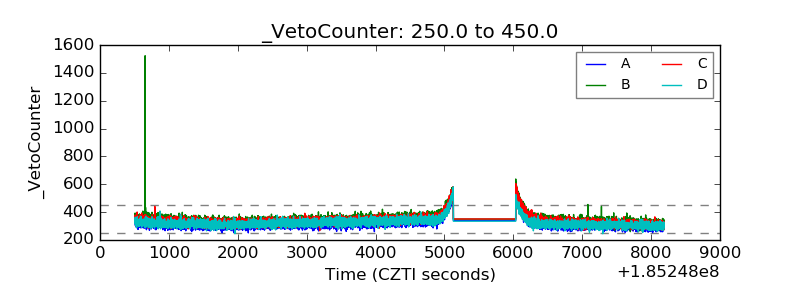 |