| Param | Original file | Final file |
|---|---|---|
| Filename | modeM0/AS1P01_142T01_9000000102cztM0_level2.fits | modeM0/AS1P01_142T01_9000000102cztM0_level2_quad_clean.evt |
| Size (bytes) | 68,711,040 | 76,821,120 |
| Size | 65.5 MB | 73.3 MB |
| Events in quadrant A | 388,996 | 454,049 |
| Events in quadrant B | 389,414 | 455,222 |
| Events in quadrant C | 381,230 | 428,101 |
| Events in quadrant D | 331,238 | 398,256 |
| Mode SS | |||
|---|---|---|---|
| Quadrant | BADHDUFLAG | Total packets | Discarded packets |
| A | 0 | 174 | 0 |
| B | 0 | 174 | 0 |
| C | 0 | 174 | 0 |
| D | 0 | 174 | 0 |
| Mode M0 | |||
|---|---|---|---|
| Quadrant | BADHDUFLAG | Total packets | Discarded packets |
| A | 0 | 36681 | 0 |
| B | 0 | 39426 | 0 |
| C | 0 | 39419 | 0 |
| D | 0 | 36859 | 0 |
| Mode M9 | |||
|---|---|---|---|
| Quadrant | BADHDUFLAG | Total packets | Discarded packets |
| A | 0 | 15 | 0 |
| B | 0 | 15 | 0 |
| C | 0 | 15 | 0 |
| D | 0 | 15 | 0 |
| Quadrant | Total seconds | Saturated seconds | Saturation percentage |
|---|---|---|---|
| A | 8497 | 64 | 0.753207% |
| B | 8497 | 207 | 2.436154% |
| C | 8497 | 14 | 0.164764% |
| D | 8497 | 58 | 0.682594% |
Noise dominated data is calculated using 1-second bins in cleaned event files. If a bin has >2000 counts, and if more than 50% of those come from <1% of pixels, then it is considered to be noise-dominated and hence unusable.
| Quadrant | # 1 sec bins | Bins with >0 counts | Bins with >2000 counts | High rate bins dominated by noise | Noise dominated (total time) | Noise dominated (detector-on time) | Marked lightcurve |
|---|---|---|---|---|---|---|---|
| A | 10012 | 8496 | 0 | 0 | 0.00% | 0.00% |  |
| B | 10012 | 8497 | 0 | 0 | 0.00% | 0.00% |  |
| C | 10012 | 8497 | 0 | 0 | 0.00% | 0.00% | 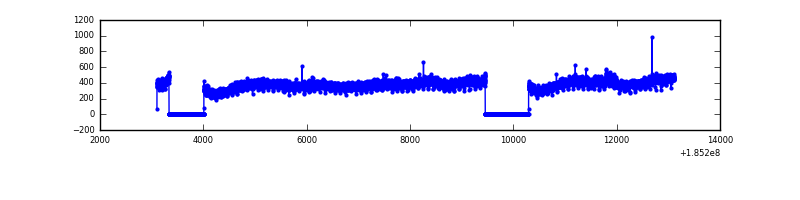 |
| D | 10012 | 8497 | 0 | 0 | 0.00% | 0.00% |  |
Top three noisy pixels from each quadrant. If the there are fewer than three noisy pixels in the level2.evt file, extra rows are filled as -1
| Pixel properties | Quadrant properties | ||||||
|---|---|---|---|---|---|---|---|
| Quadrant | DetID | PixID | Counts | Sigma | Mean | Median | Sigma |
| A | 0 | 29 | 360 | 9.98 | 101 | 95 | 26.6 |
| A | 7 | 110 | 356 | 9.83 | 101 | 95 | 26.6 |
| A | 9 | 19 | 304 | 7.87 | 101 | 95 | 26.6 |
| B | 2 | 9 | 332 | 10.82 | 102 | 97 | 21.7 |
| B | 3 | 17 | 252 | 7.14 | 102 | 97 | 21.7 |
| B | 5 | 225 | 250 | 7.05 | 102 | 97 | 21.7 |
| C | 2 | 191 | 271 | 6.6 | 100 | 92 | 27.1 |
| C | 9 | 233 | 261 | 6.23 | 100 | 92 | 27.1 |
| C | 12 | 241 | 248 | 5.75 | 100 | 92 | 27.1 |
| D | 6 | 231 | 249 | 6.56 | 94 | 86 | 24.8 |
| D | 6 | 44 | 247 | 6.48 | 94 | 86 | 24.8 |
| D | 11 | 82 | 225 | 5.59 | 94 | 86 | 24.8 |
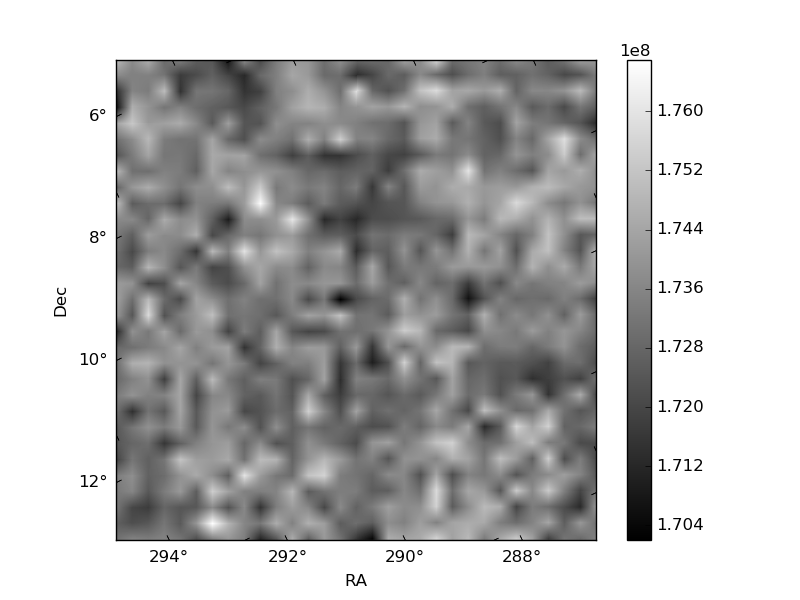
Histogram calculated using DETX and DETY for each event in the final _common_clean file
| Quadrant A |  |
 |
Quadrant B |
|---|---|---|---|
| Quadrant D |  |
 |
Quadrant C |
| Plot type | Count rate plots | Images |
|---|---|---|
| Comparison with Poisson distribution Blue bars denote a histogram of data divided into 1 sec bins. Red curve is a Poisson curve with rate = median count rate of data. |
 |
 |
| Quadrant-wise count rates Data is divided into 100 sec bins |
 |
|
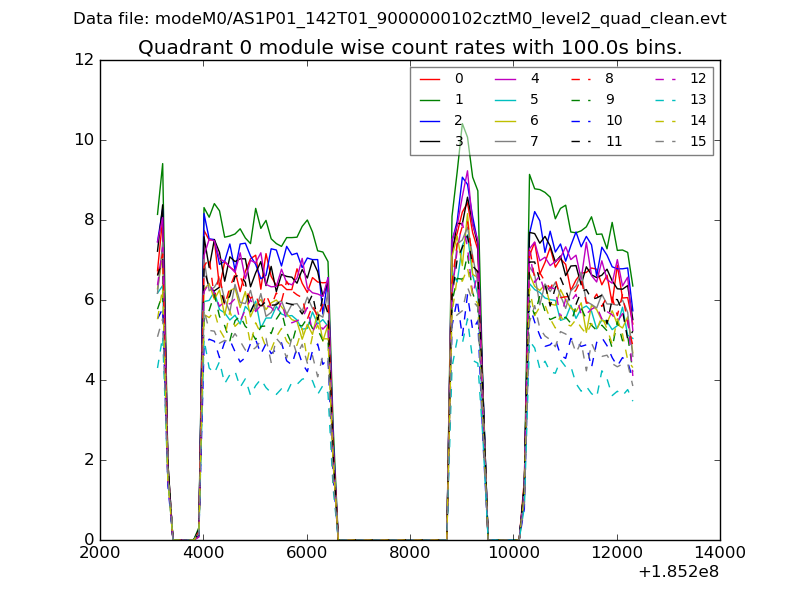
| Module-wise count rates for Quadrant A Data is divided into 100 sec bins |
 |
 |
| Module-wise count rates for Quadrant B Data is divided into 100 sec bins |
 |
 |
| Module-wise count rates for Quadrant C Data is divided into 100 sec bins |
 |
 |
| Module-wise count rates for Quadrant D Data is divided into 100 sec bins |
 |
 |
| Parameter | Plot |
|---|---|
| CZT HV Monitor |  |
| D_VDD | 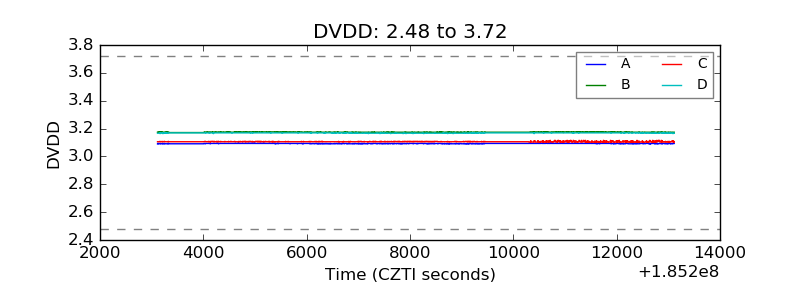 |
| Temperature 1 |  |
| Veto HV Monitor | 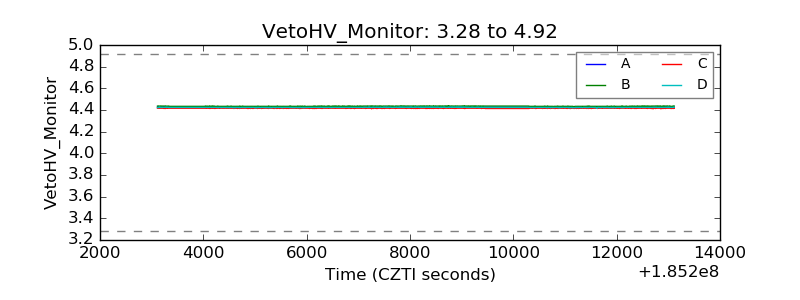 |
| Veto LLD |  |
| Alpha Counter |  |
| _CPM_Rate |  |
| CZT Counter | 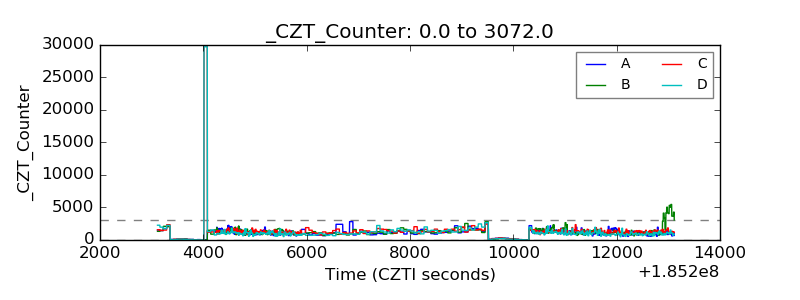 |
| +2.5 Volts monitor |  |
| +5 Volts monitor | 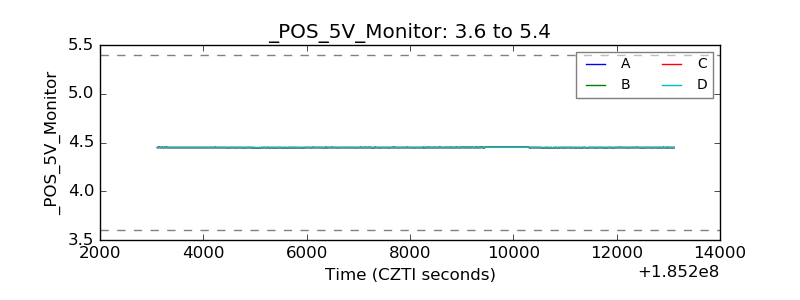 |
| _ROLL_ROT |  |
| _Roll_DEC |  |
| _Roll_RA |  |
| Veto Counter |  |