| Param | Original file | Final file |
|---|---|---|
| Filename | modeM0/AS1P01_142T01_9000000102_00703cztM0_level2.evt | modeM0/AS1P01_142T01_9000000102_00703cztM0_level2_quad_clean.evt |
| Size (bytes) | 1,023,664,320 | 61,894,080 |
| Size | 976.2 MB | 59.0 MB |
| Events in quadrant A | 7,277,480 | 369,994 |
| Events in quadrant B | 7,822,372 | 369,238 |
| Events in quadrant C | 8,017,057 | 359,230 |
| Events in quadrant D | 7,485,385 | 353,912 |
| Mode SS | |||
|---|---|---|---|
| Quadrant | BADHDUFLAG | Total packets | Discarded packets |
| A | 0 | 122 | 0 |
| B | 0 | 122 | 0 |
| C | 0 | 122 | 0 |
| D | 0 | 122 | 0 |
| Mode M0 | |||
|---|---|---|---|
| Quadrant | BADHDUFLAG | Total packets | Discarded packets |
| A | 0 | 25917 | 1 |
| B | 0 | 27469 | 1 |
| C | 0 | 28098 | 2 |
| D | 0 | 26542 | 1 |
| Mode M9 | |||
|---|---|---|---|
| Quadrant | BADHDUFLAG | Total packets | Discarded packets |
| A | 0 | 8 | 0 |
| B | 0 | 8 | 0 |
| C | 0 | 8 | 0 |
| D | 0 | 8 | 0 |
| Quadrant | Total seconds | Saturated seconds | Saturation percentage |
|---|---|---|---|
| A | 6038 | 37 | 0.612786% |
| B | 6038 | 8 | 0.132494% |
| C | 6037 | 5 | 0.082823% |
| D | 6037 | 24 | 0.397548% |
Noise dominated data is calculated using 1-second bins in cleaned event files. If a bin has >2000 counts, and if more than 50% of those come from <1% of pixels, then it is considered to be noise-dominated and hence unusable.
| Quadrant | # 1 sec bins | Bins with >0 counts | Bins with >2000 counts | High rate bins dominated by noise | Noise dominated (total time) | Noise dominated (detector-on time) | Marked lightcurve |
|---|---|---|---|---|---|---|---|
| A | 6878 | 6039 | 266 | 266 | 3.87% | 4.40% | 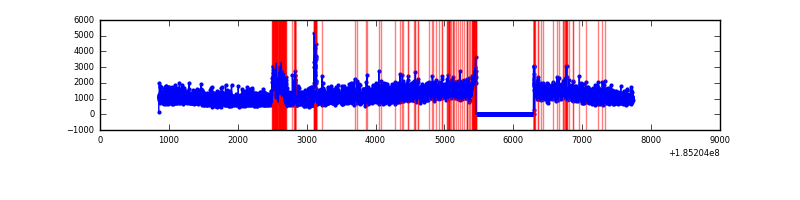 |
| B | 6878 | 6039 | 285 | 285 | 4.14% | 4.72% | 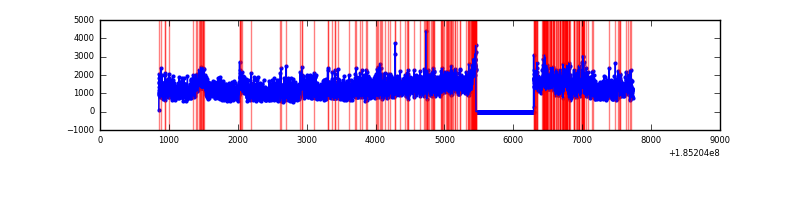 |
| C | 6877 | 6038 | 175 | 175 | 2.54% | 2.90% | 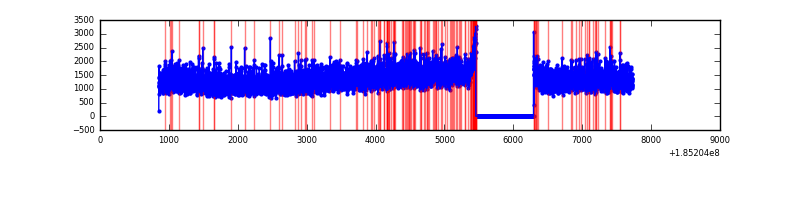 |
| D | 6877 | 6038 | 284 | 284 | 4.13% | 4.70% | 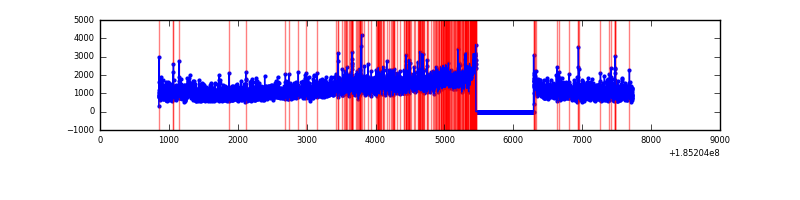 |
Top three noisy pixels from each quadrant. If the there are fewer than three noisy pixels in the level2.evt file, extra rows are filled as -1
| Pixel properties | Quadrant properties | ||||||
|---|---|---|---|---|---|---|---|
| Quadrant | DetID | PixID | Counts | Sigma | Mean | Median | Sigma |
| A | 10 | 216 | 313454 | 732.12 | 1775 | 1790 | 425.7 |
| A | 15 | 171 | 64086 | 146.34 | 1775 | 1790 | 425.7 |
| A | 12 | 133 | 55689 | 126.61 | 1775 | 1790 | 425.7 |
| B | 5 | 191 | 405640 | 915.6 | 1872 | 1880 | 441.0 |
| B | 5 | 247 | 202424 | 454.77 | 1872 | 1880 | 441.0 |
| B | 0 | 220 | 53215 | 116.41 | 1872 | 1880 | 441.0 |
| C | 3 | 31 | 318625 | 668.52 | 1701 | 1768 | 474.0 |
| C | 3 | 15 | 276794 | 580.27 | 1701 | 1768 | 474.0 |
| C | 3 | 175 | 239228 | 501.01 | 1701 | 1768 | 474.0 |
| D | 0 | 25 | 1024100 | 2011.34 | 1644 | 1703 | 508.3 |
| D | 12 | 188 | 204198 | 398.36 | 1644 | 1703 | 508.3 |
| D | 1 | 4 | 55708 | 106.24 | 1644 | 1703 | 508.3 |
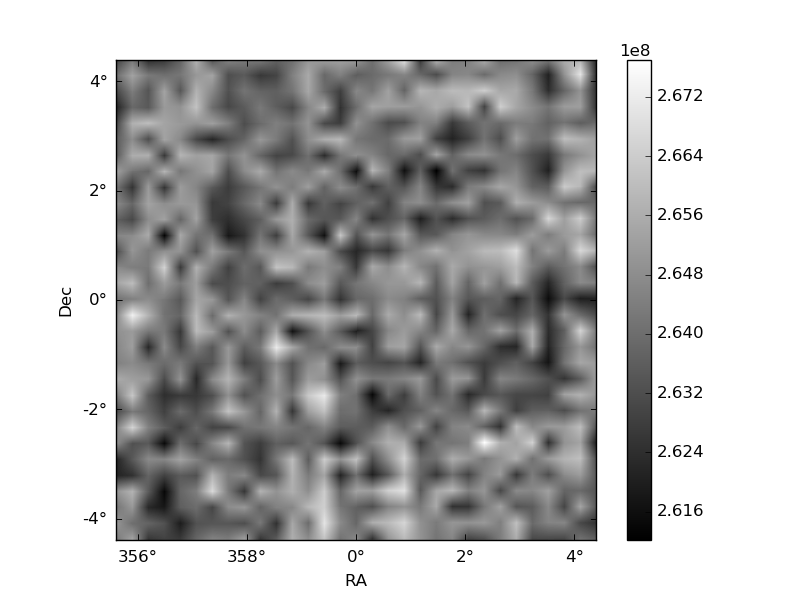
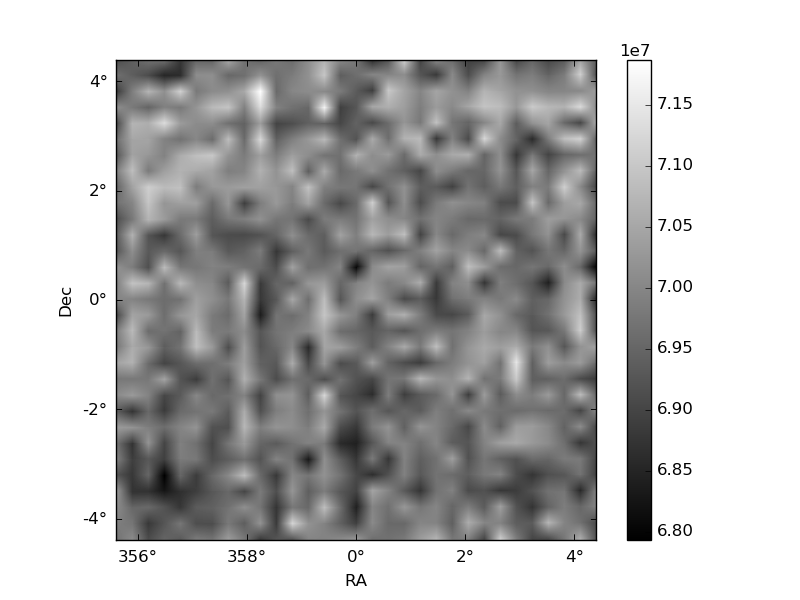
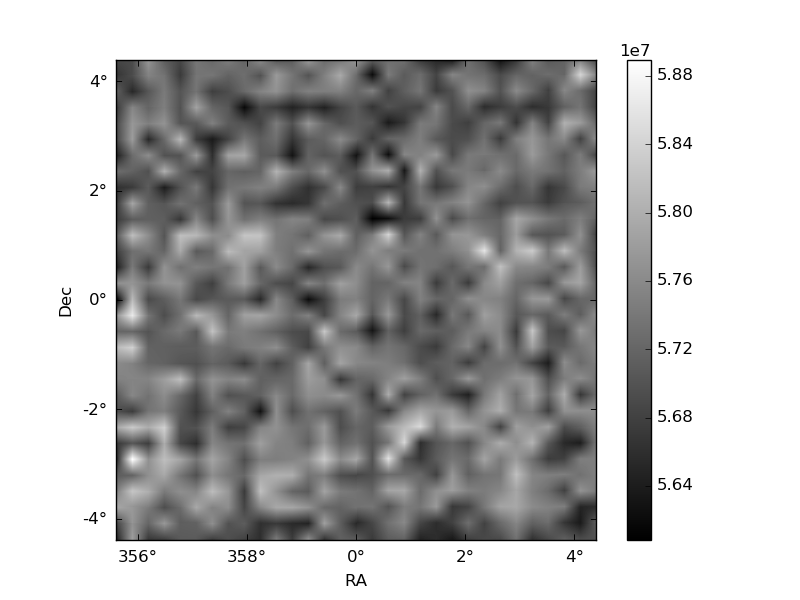
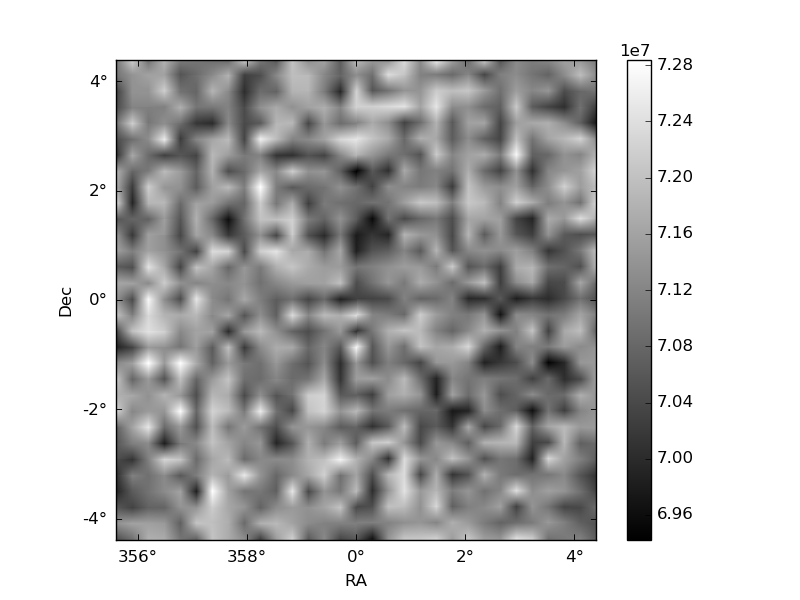
Histogram calculated using DETX and DETY for each event in the final _common_clean file
| Quadrant A | 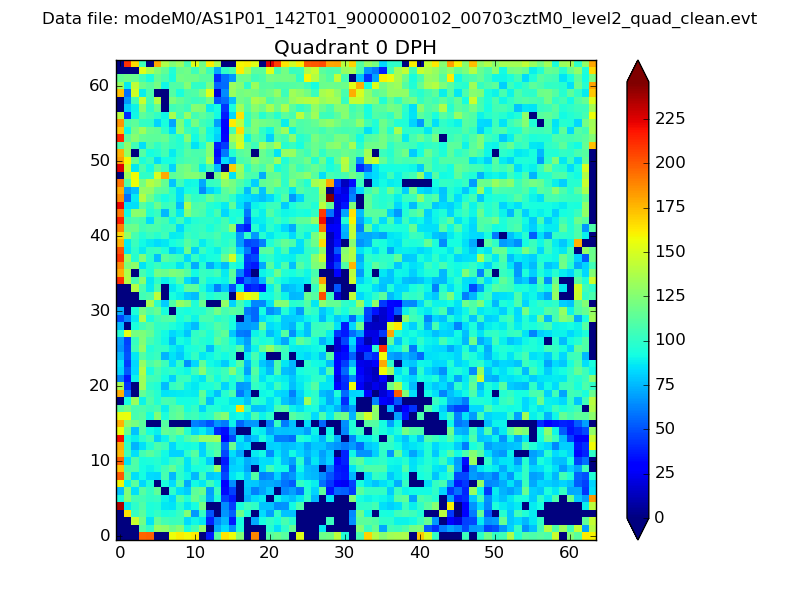 |
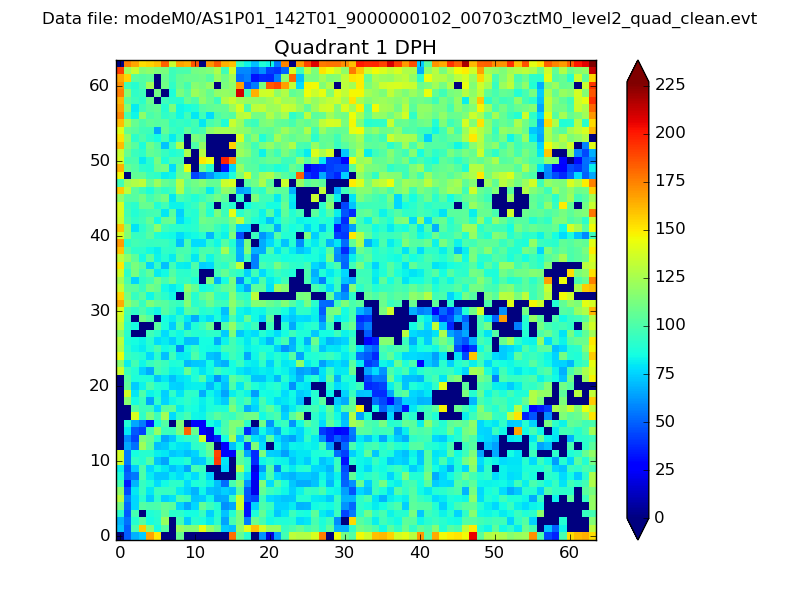 |
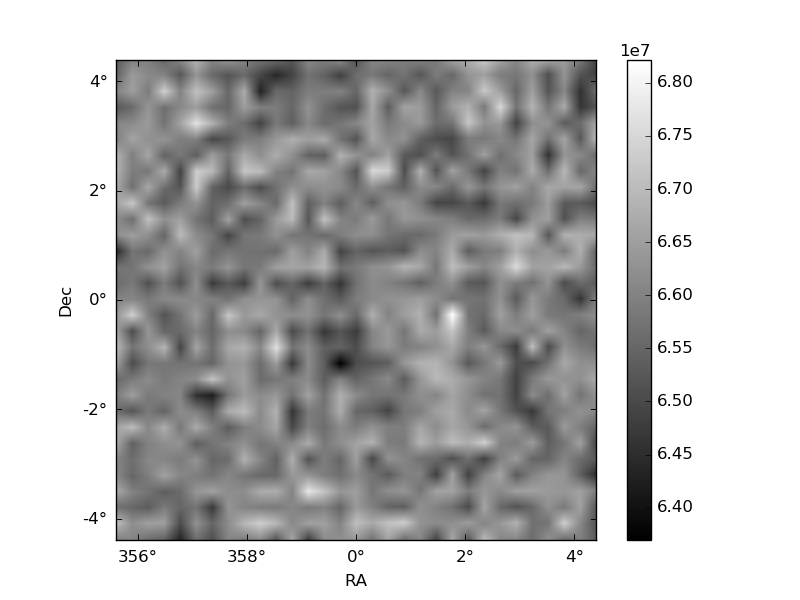
Quadrant B |
|---|---|---|---|
| Quadrant D | 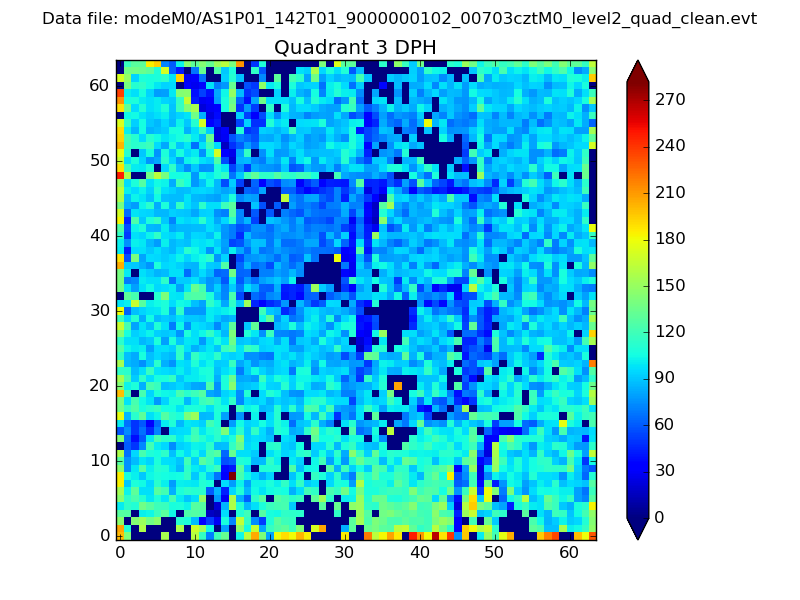 |
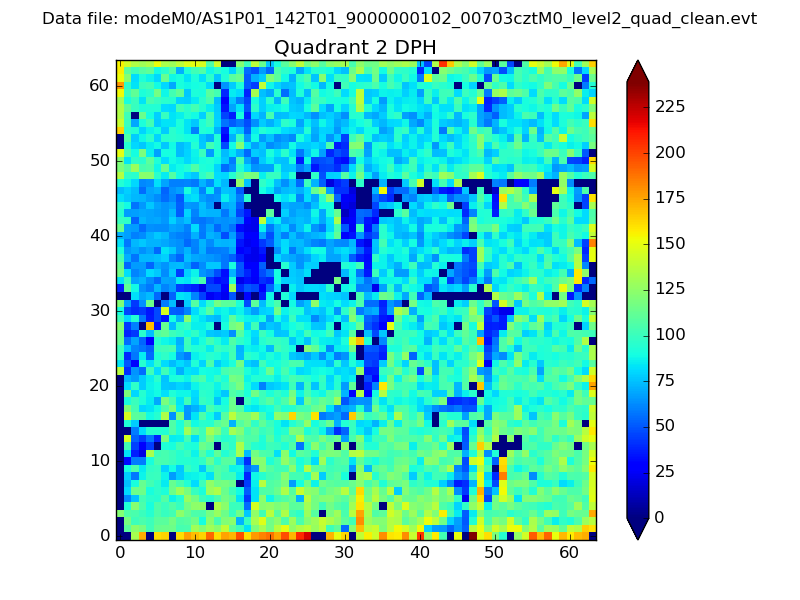 |
Quadrant C |
| Plot type | Count rate plots | Images |
|---|---|---|
| Comparison with Poisson distribution Blue bars denote a histogram of data divided into 1 sec bins. Red curve is a Poisson curve with rate = median count rate of data. |
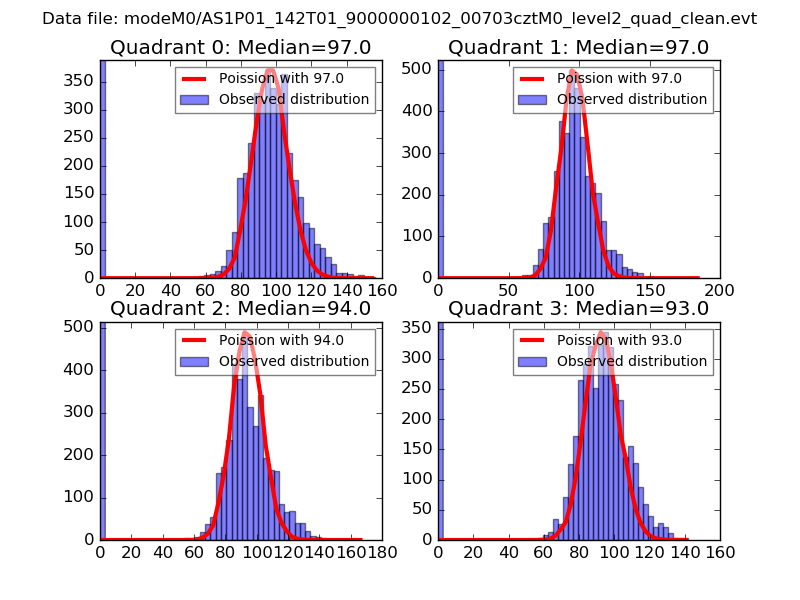 |
 |
| Quadrant-wise count rates Data is divided into 100 sec bins |
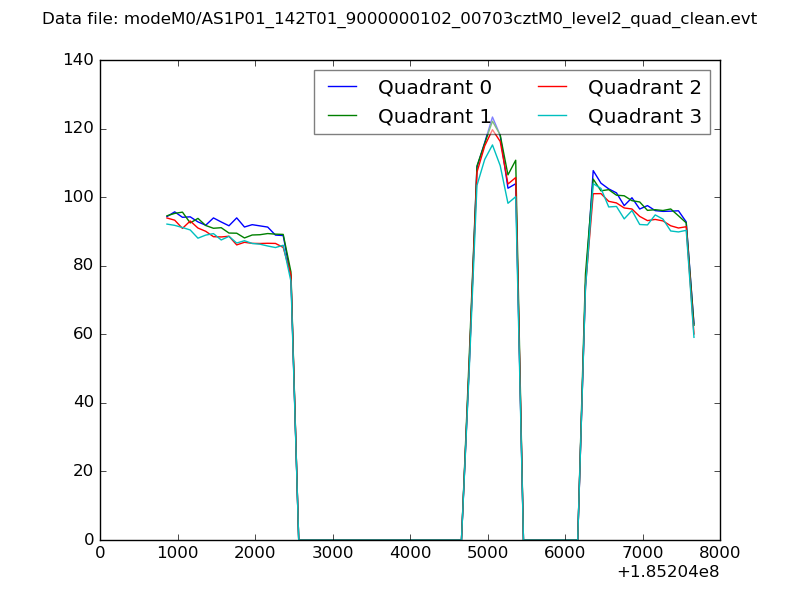 |
|
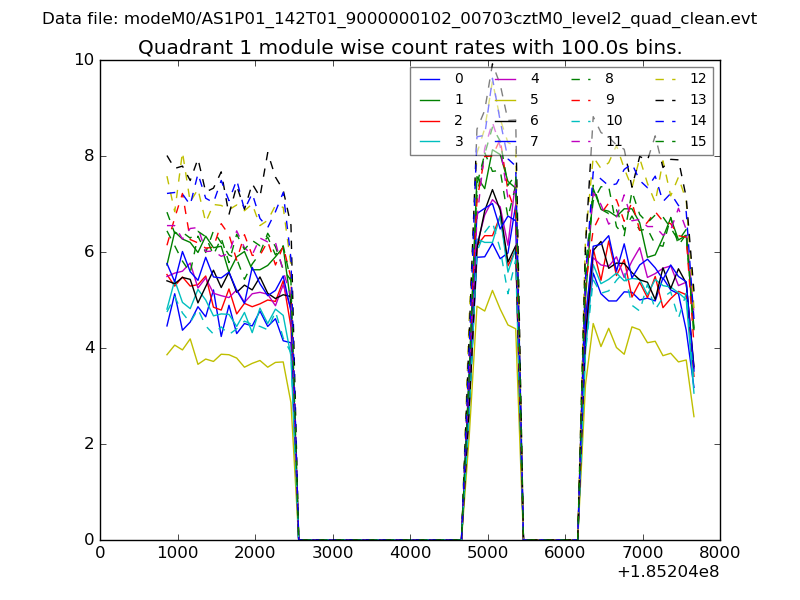
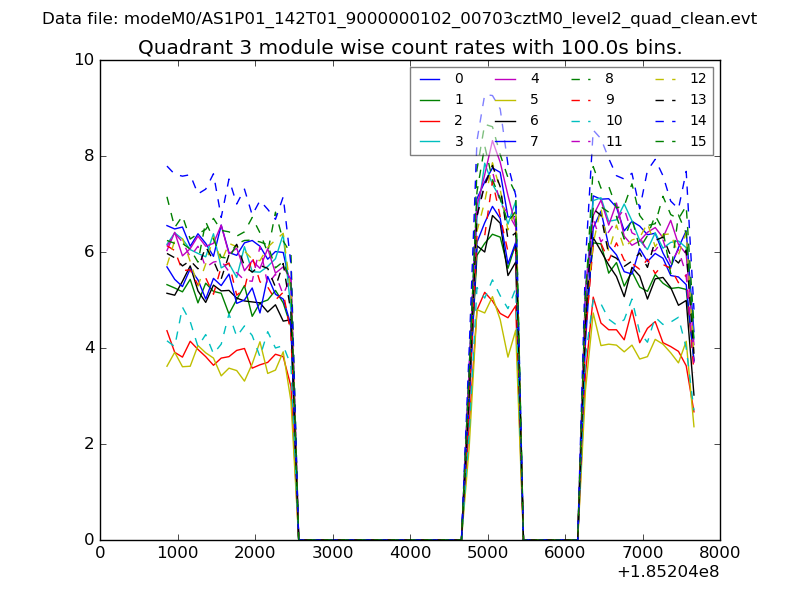
| Module-wise count rates for Quadrant A Data is divided into 100 sec bins |
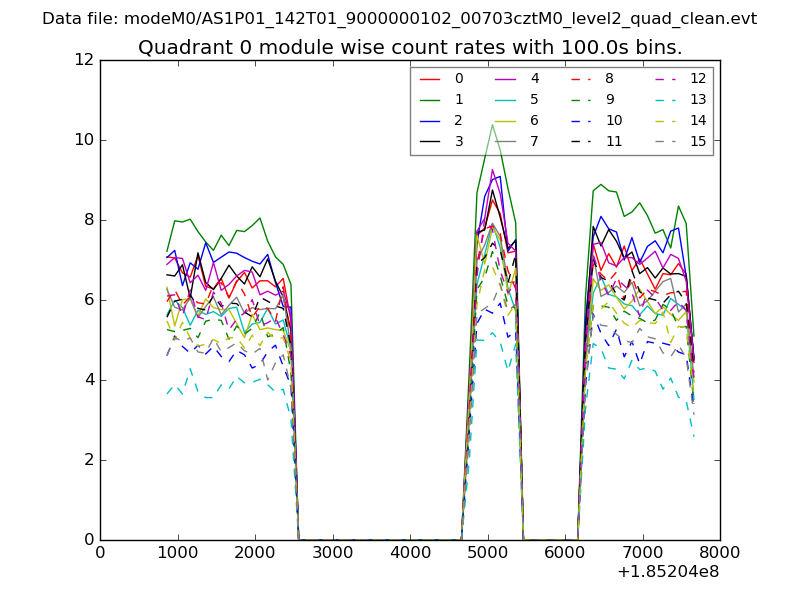 |
 |
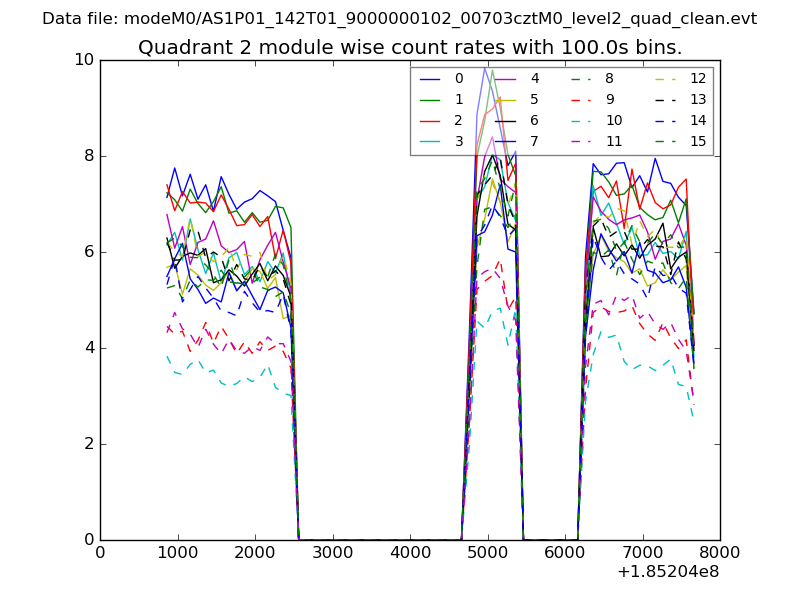
| Module-wise count rates for Quadrant B Data is divided into 100 sec bins |
 |
 |
| Module-wise count rates for Quadrant C Data is divided into 100 sec bins |
 |
 |
| Module-wise count rates for Quadrant D Data is divided into 100 sec bins |
 |
 |
| Parameter | Plot |
|---|---|
| CZT HV Monitor | 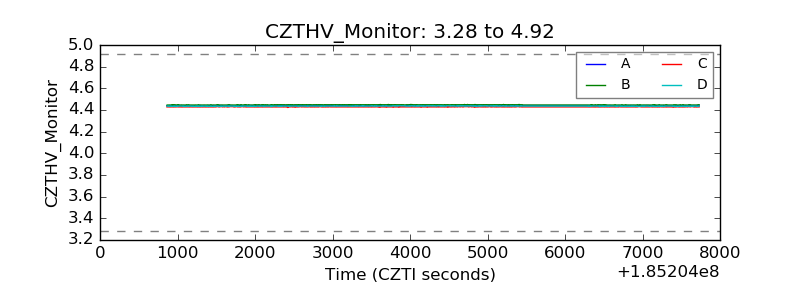 |
| D_VDD | 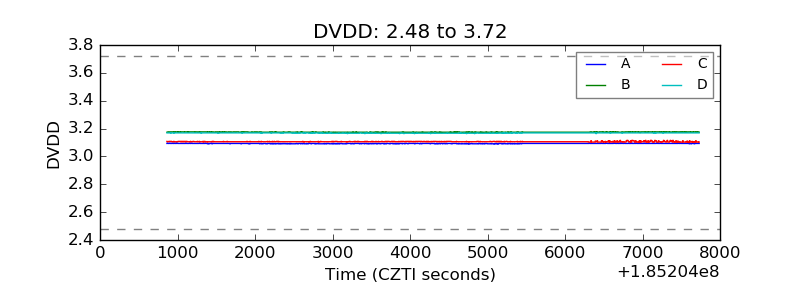 |
| Temperature 1 | 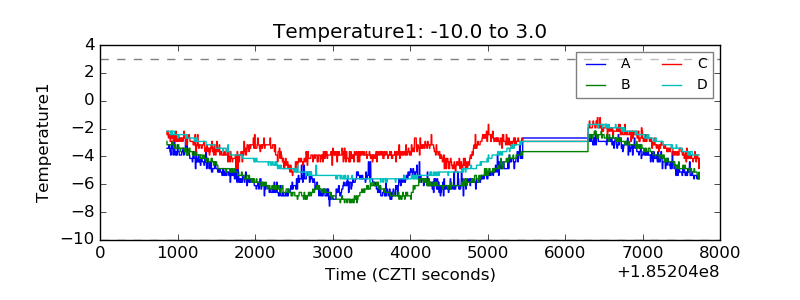 |
| Veto HV Monitor | 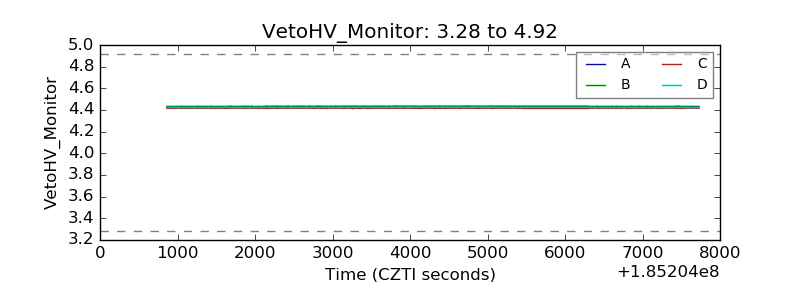 |
| Veto LLD | 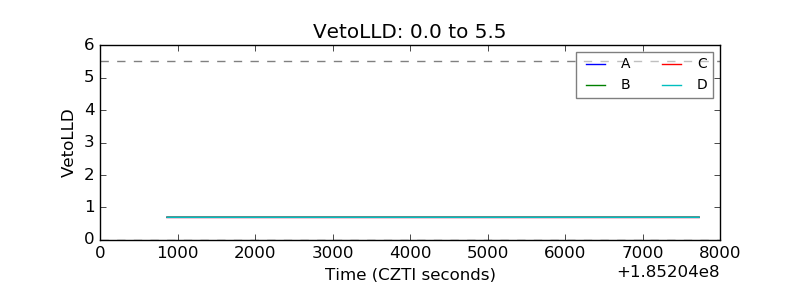 |
| Alpha Counter | 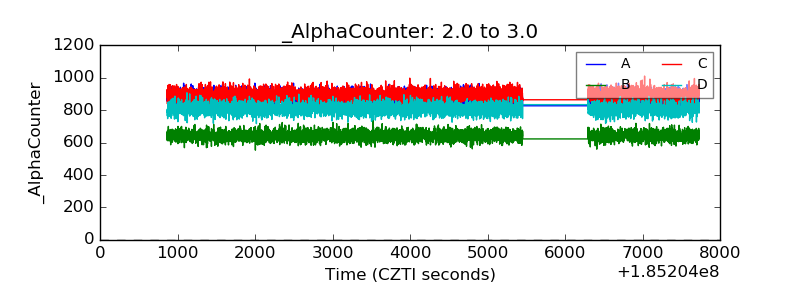 |
| _CPM_Rate | 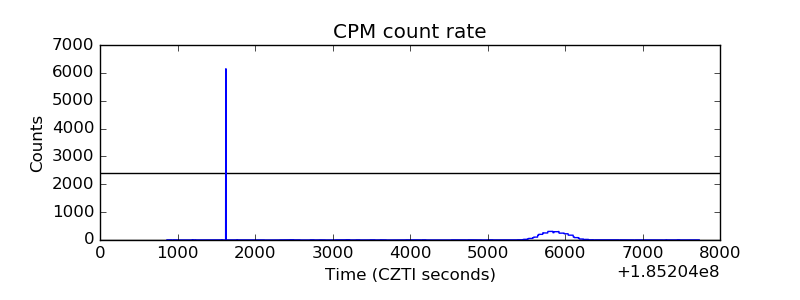 |
| CZT Counter | 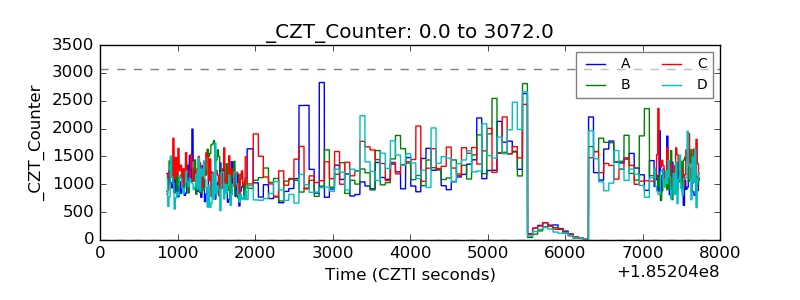 |
| +2.5 Volts monitor | 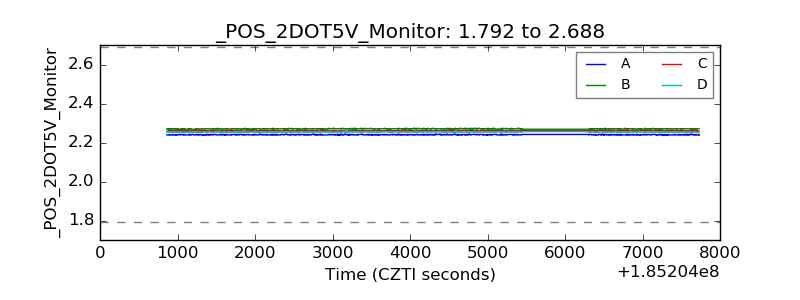 |
| +5 Volts monitor |  |
| _ROLL_ROT | 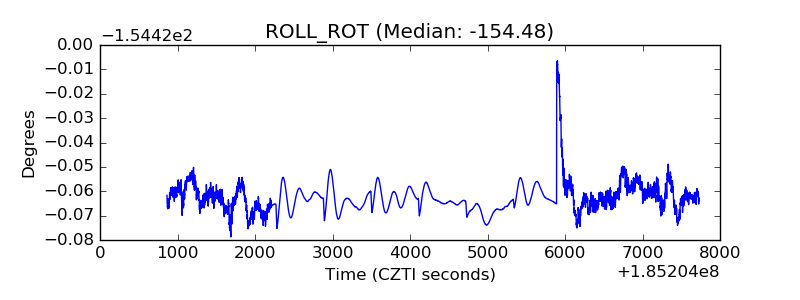 |
| _Roll_DEC | 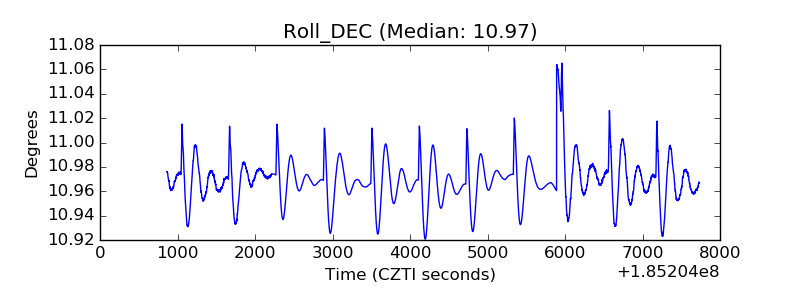 |
| _Roll_RA | 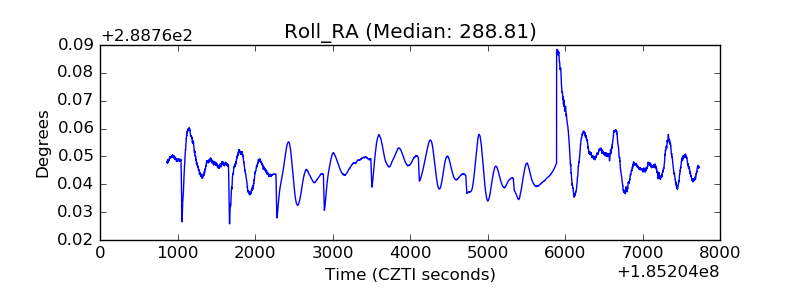 |
| Veto Counter | 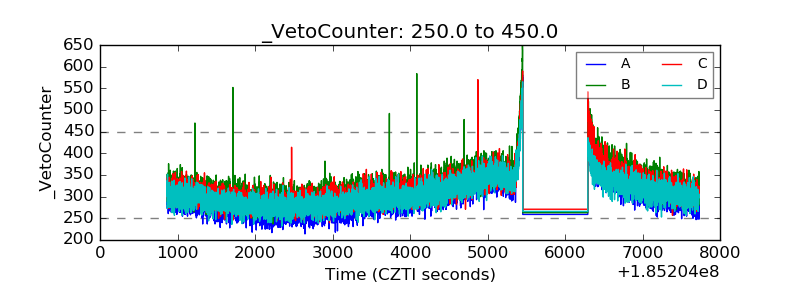 |