| Param | Original file | Final file |
|---|---|---|
| Filename | modeM0/AS1P01_147T01_9000000106cztM0_level2.fits | modeM0/AS1P01_147T01_9000000106cztM0_level2_quad_clean.evt |
| Size (bytes) | 555,255,360 | 570,493,440 |
| Size | 529.5 MB | 544.1 MB |
| Events in quadrant A | 3,198,482 | 3,325,394 |
| Events in quadrant B | 3,191,442 | 3,346,992 |
| Events in quadrant C | 3,134,506 | 3,156,561 |
| Events in quadrant D | 2,670,012 | 2,828,177 |
| Mode M9 | |||
|---|---|---|---|
| Quadrant | BADHDUFLAG | Total packets | Discarded packets |
| A | 0 | 83 | 0 |
| B | 0 | 83 | 0 |
| C | 0 | 83 | 0 |
| D | 0 | 83 | 0 |
| Mode SS | |||
|---|---|---|---|
| Quadrant | BADHDUFLAG | Total packets | Discarded packets |
| A | 0 | 1366 | 0 |
| B | 0 | 1366 | 0 |
| C | 0 | 1364 | 0 |
| D | 0 | 1364 | 0 |
| Mode M0 | |||
|---|---|---|---|
| Quadrant | BADHDUFLAG | Total packets | Discarded packets |
| A | 0 | 288185 | 0 |
| B | 0 | 302863 | 0 |
| C | 0 | 298034 | 0 |
| D | 0 | 314555 | 0 |
| Quadrant | Total seconds | Saturated seconds | Saturation percentage |
|---|---|---|---|
| A | 67415 | 442 | 0.655640% |
| B | 67392 | 447 | 0.663283% |
| C | 67330 | 268 | 0.398040% |
| D | 67399 | 2101 | 3.117257% |
Noise dominated data is calculated using 1-second bins in cleaned event files. If a bin has >2000 counts, and if more than 50% of those come from <1% of pixels, then it is considered to be noise-dominated and hence unusable.
| Quadrant | # 1 sec bins | Bins with >0 counts | Bins with >2000 counts | High rate bins dominated by noise | Noise dominated (total time) | Noise dominated (detector-on time) | Marked lightcurve |
|---|---|---|---|---|---|---|---|
| A | 82532 | 67475 | 0 | 0 | 0.00% | 0.00% |  |
| B | 82531 | 67459 | 0 | 0 | 0.00% | 0.00% |  |
| C | 82532 | 67397 | 0 | 0 | 0.00% | 0.00% |  |
| D | 82532 | 67451 | 0 | 0 | 0.00% | 0.00% |  |
Top three noisy pixels from each quadrant. If the there are fewer than three noisy pixels in the level2.evt file, extra rows are filled as -1
| Pixel properties | Quadrant properties | ||||||
|---|---|---|---|---|---|---|---|
| Quadrant | DetID | PixID | Counts | Sigma | Mean | Median | Sigma |
| A | 7 | 110 | 3052 | 11.55 | 830 | 771 | 197.5 |
| A | 0 | 29 | 2920 | 10.88 | 830 | 771 | 197.5 |
| A | 14 | 188 | 2331 | 7.9 | 830 | 771 | 197.5 |
| B | 2 | 9 | 2499 | 10.99 | 842 | 798 | 154.7 |
| B | 14 | 254 | 2078 | 8.27 | 842 | 798 | 154.7 |
| B | 2 | 18 | 1983 | 7.66 | 842 | 798 | 154.7 |
| C | 2 | 191 | 2211 | 7.01 | 829 | 764 | 206.6 |
| C | 12 | 241 | 2156 | 6.74 | 829 | 764 | 206.6 |
| C | 9 | 242 | 2062 | 6.28 | 829 | 764 | 206.6 |
| D | 6 | 231 | 1997 | 7.18 | 760 | 695 | 181.3 |
| D | 15 | 30 | 1897 | 6.63 | 760 | 695 | 181.3 |
| D | 6 | 44 | 1896 | 6.62 | 760 | 695 | 181.3 |
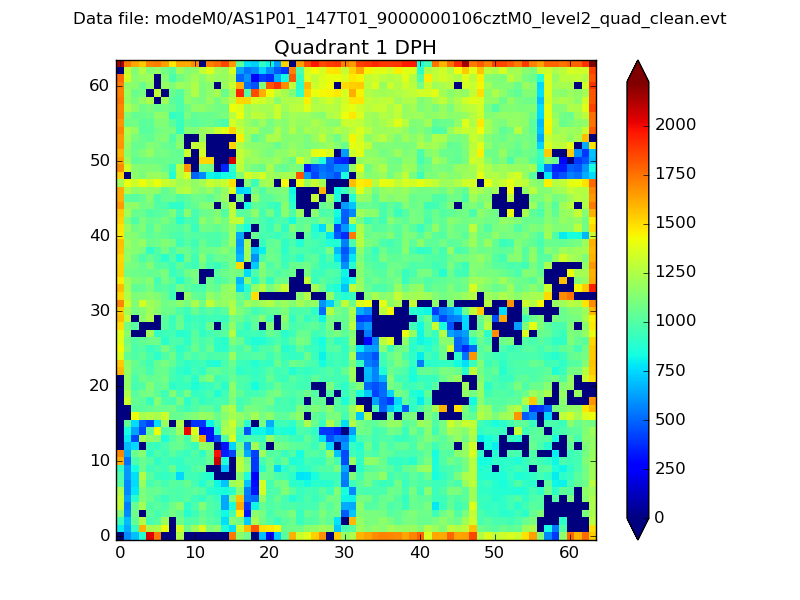
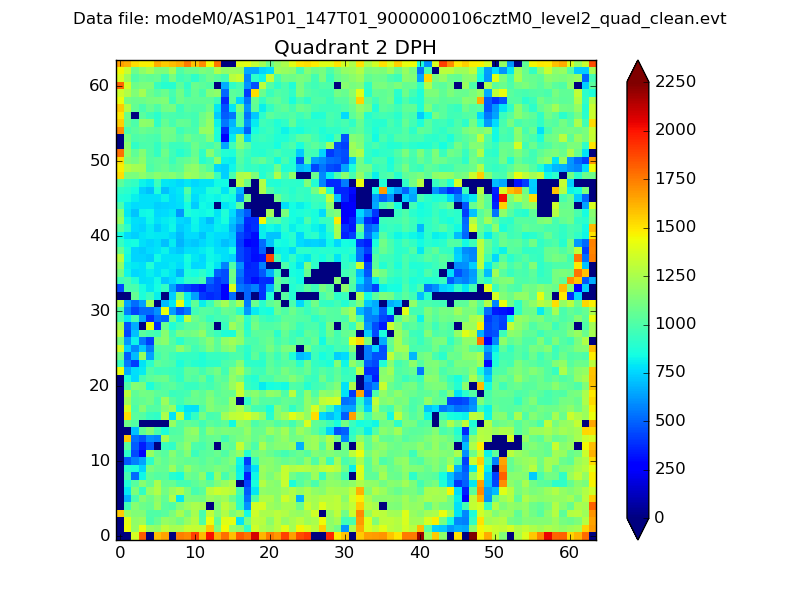
Histogram calculated using DETX and DETY for each event in the final _common_clean file
| Quadrant A |  |
 |
Quadrant B |
|---|---|---|---|
| Quadrant D |  |
 |
Quadrant C |
| Plot type | Count rate plots | Images |
|---|---|---|
| Comparison with Poisson distribution Blue bars denote a histogram of data divided into 1 sec bins. Red curve is a Poisson curve with rate = median count rate of data. |
 |
 |
| Quadrant-wise count rates Data is divided into 100 sec bins |
 |
|
| Module-wise count rates for Quadrant A Data is divided into 100 sec bins |
 |
 |
| Module-wise count rates for Quadrant B Data is divided into 100 sec bins |
 |
 |
| Module-wise count rates for Quadrant C Data is divided into 100 sec bins |
 |
 |
| Module-wise count rates for Quadrant D Data is divided into 100 sec bins |
 |
 |
| Parameter | Plot |
|---|---|
| CZT HV Monitor |  |
| D_VDD |  |
| Temperature 1 |  |
| Veto HV Monitor |  |
| Veto LLD |  |
| Alpha Counter |  |
| _CPM_Rate |  |
| CZT Counter |  |
| +2.5 Volts monitor |  |
| +5 Volts monitor |  |
| _ROLL_ROT |  |
| _Roll_DEC |  |
| _Roll_RA |  |
| Veto Counter |  |