| Param | Original file | Final file |
|---|---|---|
| Filename | modeM0/AS1P01_147T01_9000000106_00713cztM0_level2.evt | modeM0/AS1P01_147T01_9000000106_00713cztM0_level2_quad_clean.evt |
| Size (bytes) | 1,379,574,720 | 75,458,880 |
| Size | 1.3 GB | 72.0 MB |
| Events in quadrant A | 9,337,568 | 450,075 |
| Events in quadrant B | 10,473,392 | 449,451 |
| Events in quadrant C | 11,189,843 | 436,668 |
| Events in quadrant D | 10,284,460 | 425,098 |
| Mode M9 | |||
|---|---|---|---|
| Quadrant | BADHDUFLAG | Total packets | Discarded packets |
| A | 0 | 1 | 0 |
| B | 0 | 1 | 0 |
| C | 0 | 1 | 0 |
| D | 0 | 1 | 0 |
| Mode SS | |||
|---|---|---|---|
| Quadrant | BADHDUFLAG | Total packets | Discarded packets |
| A | 0 | 152 | 0 |
| B | 0 | 152 | 0 |
| C | 0 | 152 | 0 |
| D | 0 | 152 | 0 |
| Mode M0 | |||
|---|---|---|---|
| Quadrant | BADHDUFLAG | Total packets | Discarded packets |
| A | 0 | 33124 | 1 |
| B | 0 | 36370 | 1 |
| C | 0 | 38501 | 1 |
| D | 0 | 35893 | 2 |
| Quadrant | Total seconds | Saturated seconds | Saturation percentage |
|---|---|---|---|
| A | 7526 | 41 | 0.544778% |
| B | 7526 | 54 | 0.717513% |
| C | 7526 | 48 | 0.637789% |
| D | 7526 | 167 | 2.218974% |
Noise dominated data is calculated using 1-second bins in cleaned event files. If a bin has >2000 counts, and if more than 50% of those come from <1% of pixels, then it is considered to be noise-dominated and hence unusable.
| Quadrant | # 1 sec bins | Bins with >0 counts | Bins with >2000 counts | High rate bins dominated by noise | Noise dominated (total time) | Noise dominated (detector-on time) | Marked lightcurve |
|---|---|---|---|---|---|---|---|
| A | 7581 | 7527 | 446 | 446 | 5.88% | 5.93% | 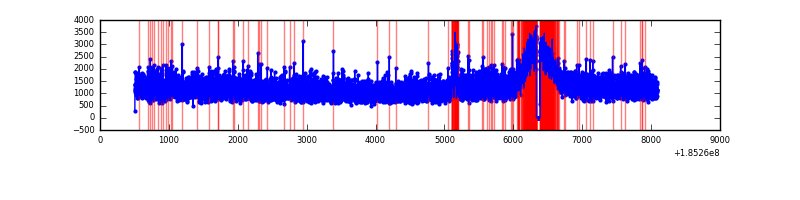 |
| B | 7581 | 7527 | 632 | 632 | 8.34% | 8.40% | 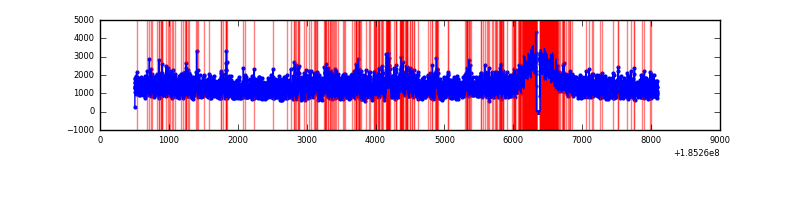 |
| C | 7581 | 7527 | 658 | 658 | 8.68% | 8.74% | 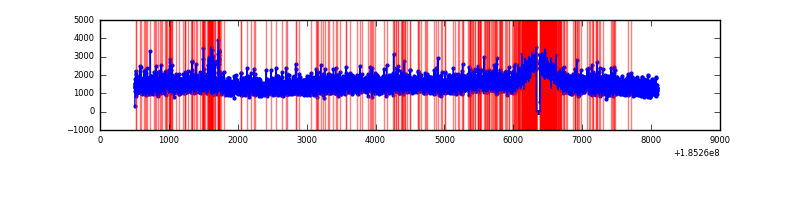 |
| D | 7581 | 7527 | 898 | 898 | 11.85% | 11.93% | 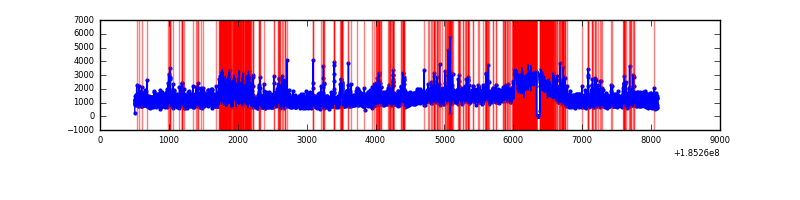 |
Top three noisy pixels from each quadrant. If the there are fewer than three noisy pixels in the level2.evt file, extra rows are filled as -1
| Pixel properties | Quadrant properties | ||||||
|---|---|---|---|---|---|---|---|
| Quadrant | DetID | PixID | Counts | Sigma | Mean | Median | Sigma |
| A | 15 | 171 | 90793 | 150.83 | 2411 | 2431 | 585.8 |
| A | 11 | 79 | 9515 | 12.09 | 2411 | 2431 | 585.8 |
| A | 3 | 111 | 7616 | 8.85 | 2411 | 2431 | 585.8 |
| B | 5 | 247 | 746600 | 1250.05 | 2499 | 2506 | 595.3 |
| B | 7 | 221 | 73452 | 119.19 | 2499 | 2506 | 595.3 |
| B | 0 | 207 | 41436 | 65.4 | 2499 | 2506 | 595.3 |
| C | 3 | 95 | 529441 | 834.43 | 2247 | 2324 | 631.7 |
| C | 3 | 31 | 485077 | 764.2 | 2247 | 2324 | 631.7 |
| C | 3 | 15 | 452090 | 711.98 | 2247 | 2324 | 631.7 |
| D | 6 | 226 | 878368 | 1282.52 | 2182 | 2264 | 683.1 |
| D | 0 | 25 | 806495 | 1177.31 | 2182 | 2264 | 683.1 |
| D | 12 | 233 | 212928 | 308.39 | 2182 | 2264 | 683.1 |
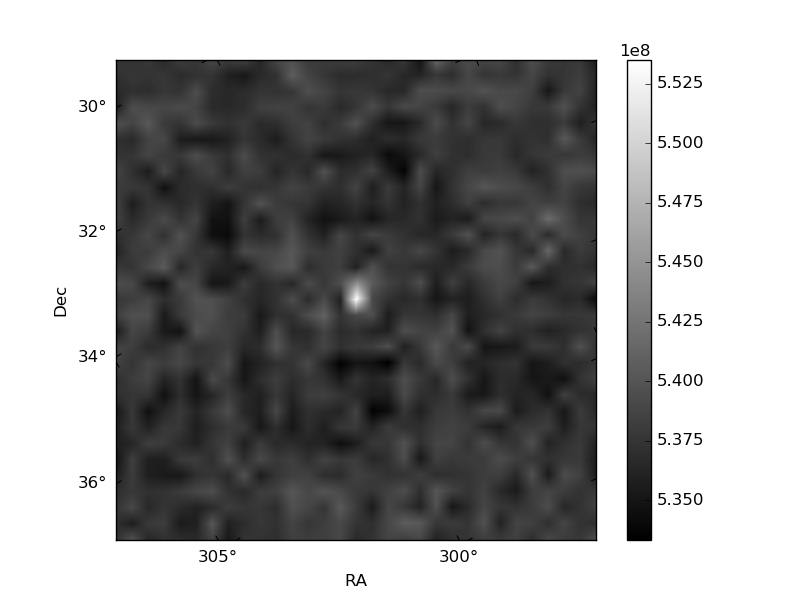
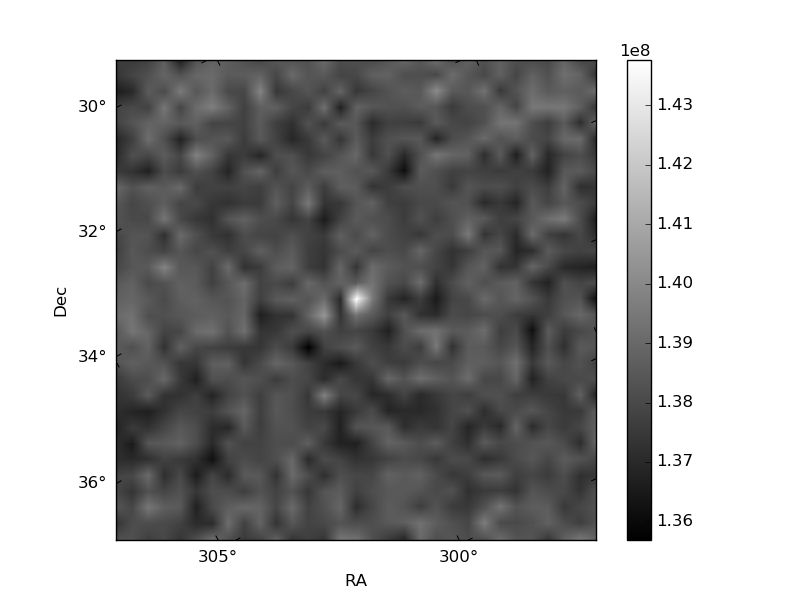
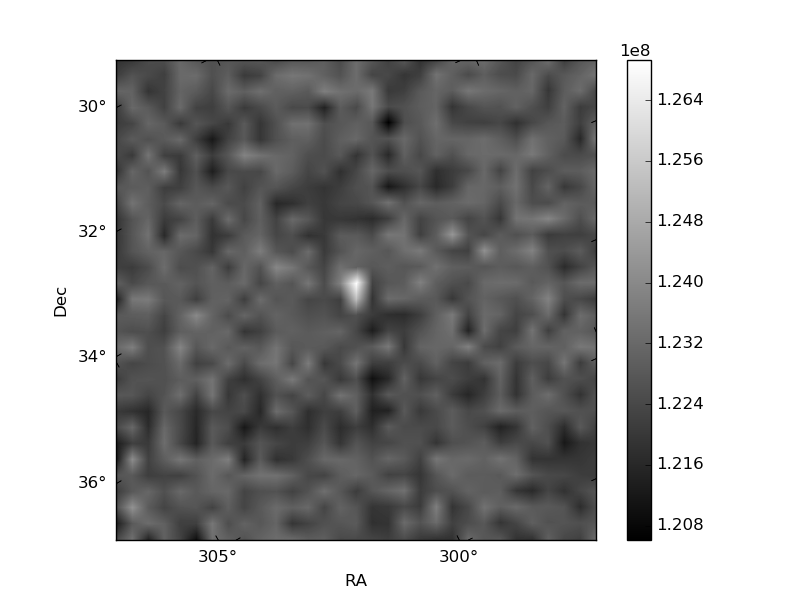
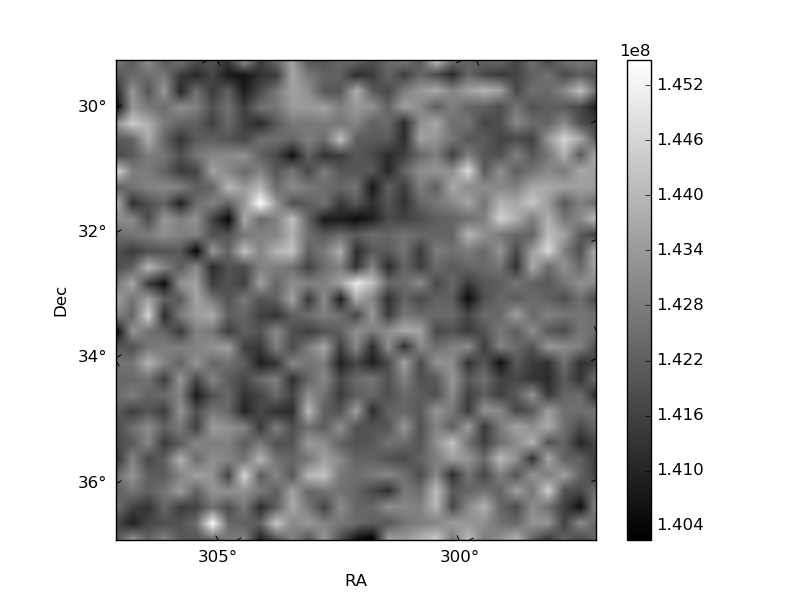
Histogram calculated using DETX and DETY for each event in the final _common_clean file
| Quadrant A | 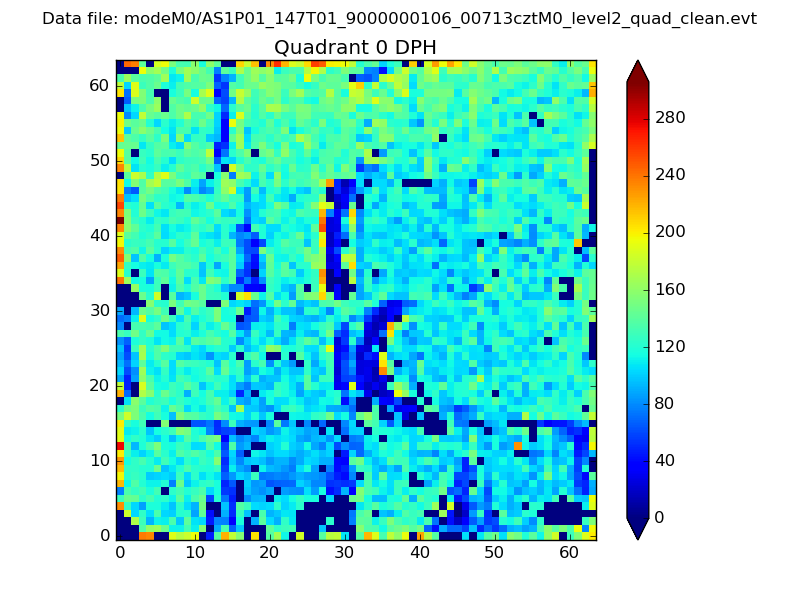 |
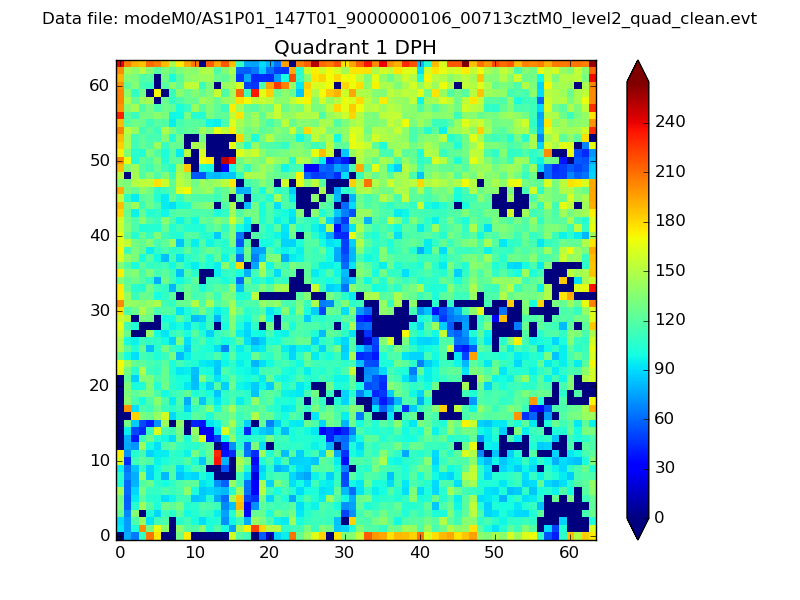 |
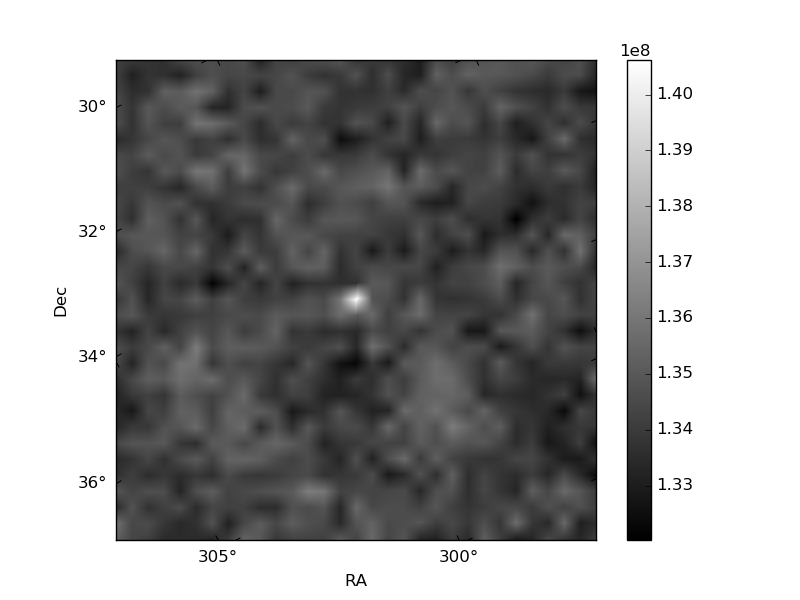
Quadrant B |
|---|---|---|---|
| Quadrant D | 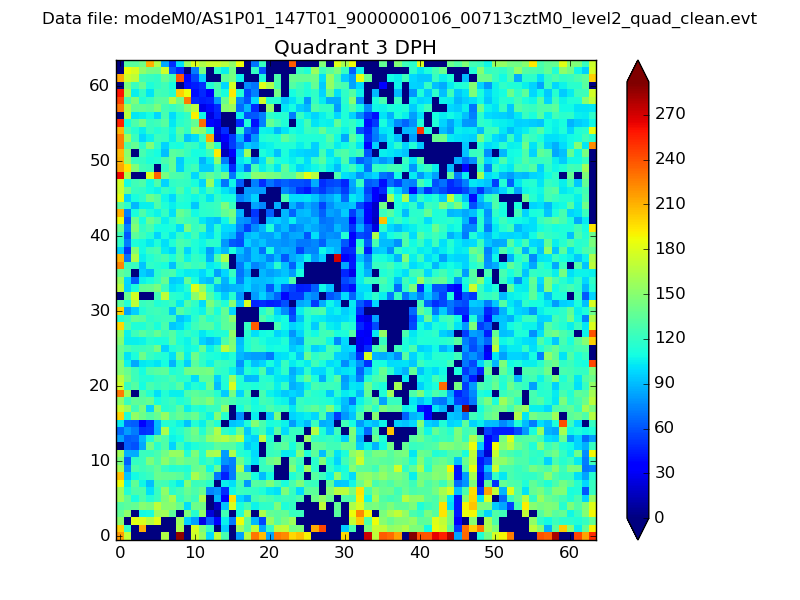 |
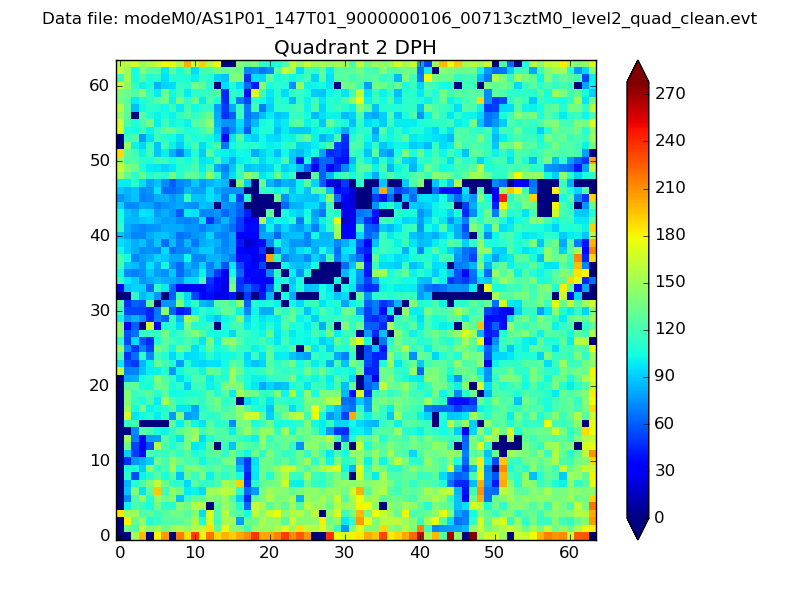 |
Quadrant C |
| Plot type | Count rate plots | Images |
|---|---|---|
| Comparison with Poisson distribution Blue bars denote a histogram of data divided into 1 sec bins. Red curve is a Poisson curve with rate = median count rate of data. |
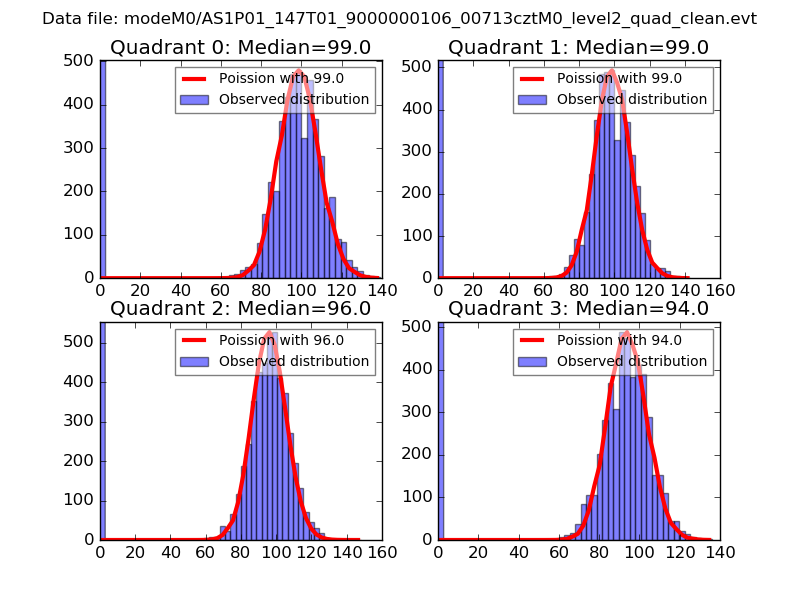 |
 |
| Quadrant-wise count rates Data is divided into 100 sec bins |
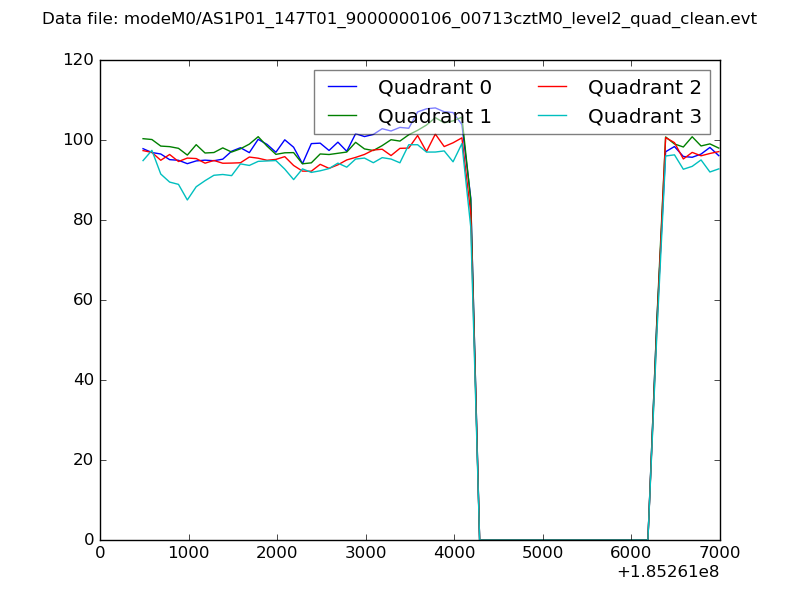 |
|
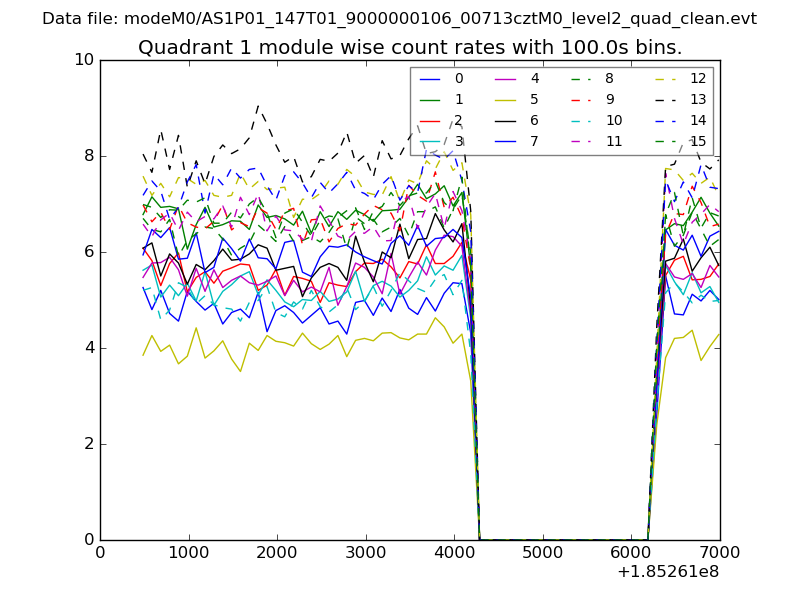
| Module-wise count rates for Quadrant A Data is divided into 100 sec bins |
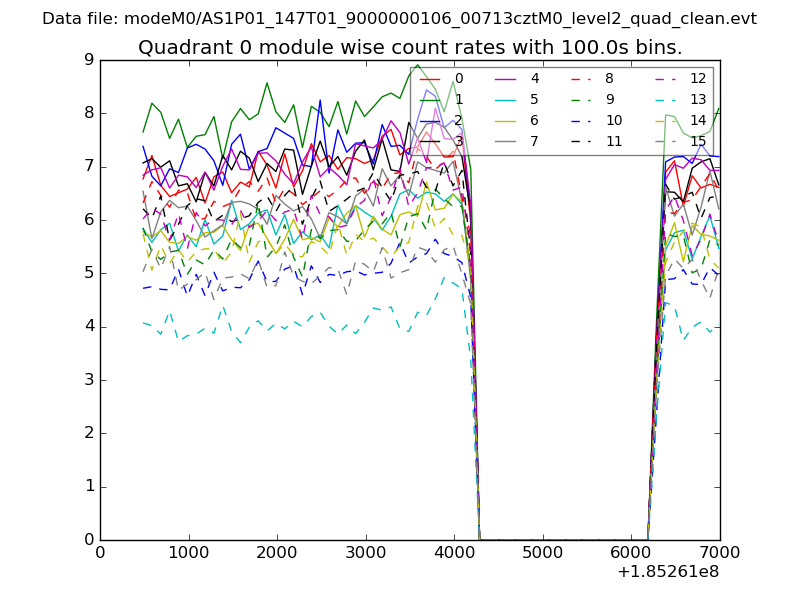 |
 |
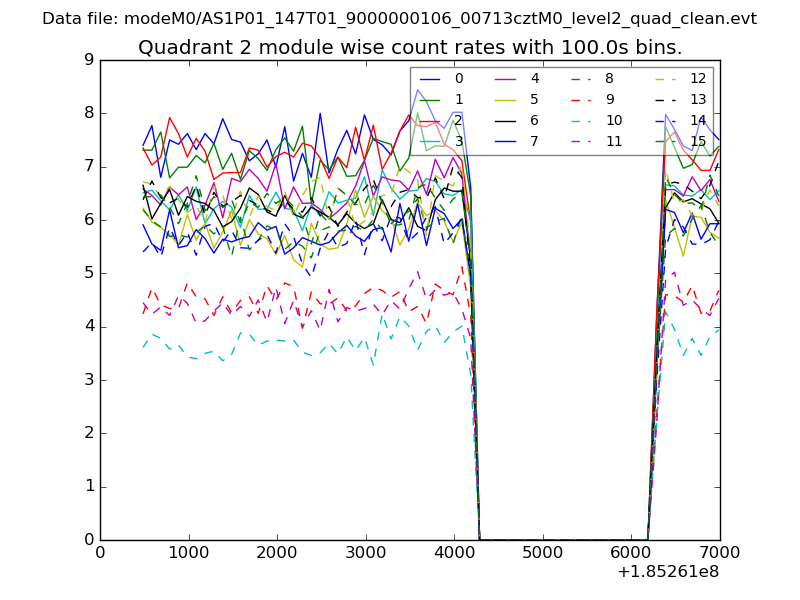
| Module-wise count rates for Quadrant B Data is divided into 100 sec bins |
 |
 |
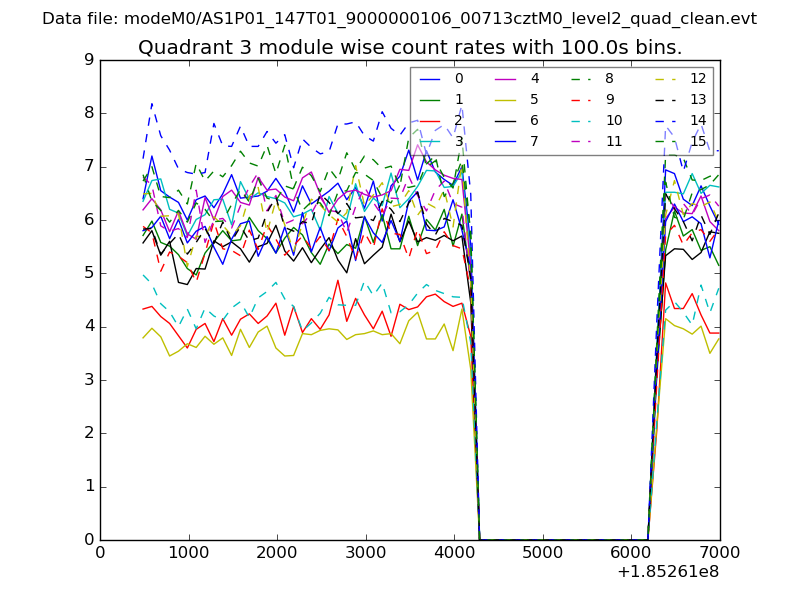
| Module-wise count rates for Quadrant C Data is divided into 100 sec bins |
 |
 |
| Module-wise count rates for Quadrant D Data is divided into 100 sec bins |
 |
 |
| Parameter | Plot |
|---|---|
| CZT HV Monitor | 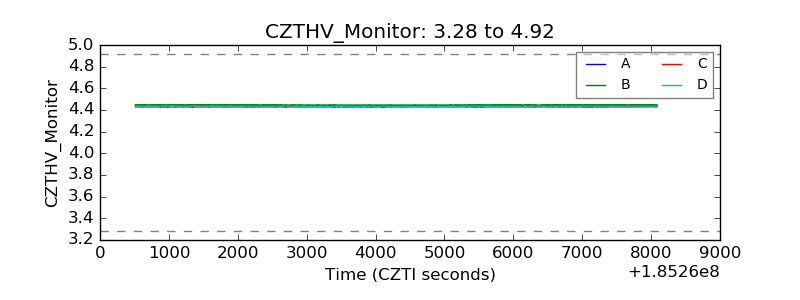 |
| D_VDD | 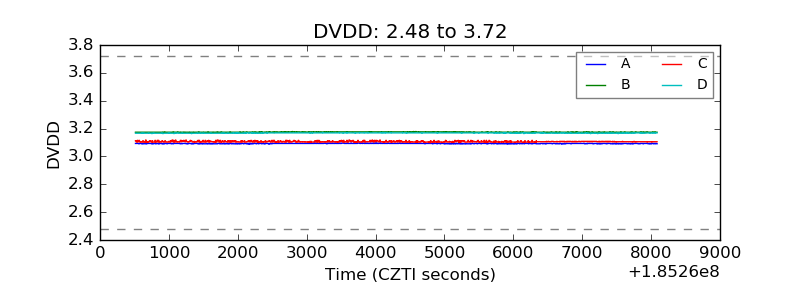 |
| Temperature 1 | 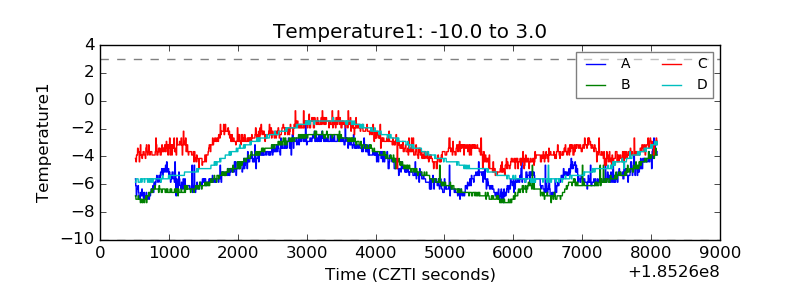 |
| Veto HV Monitor | 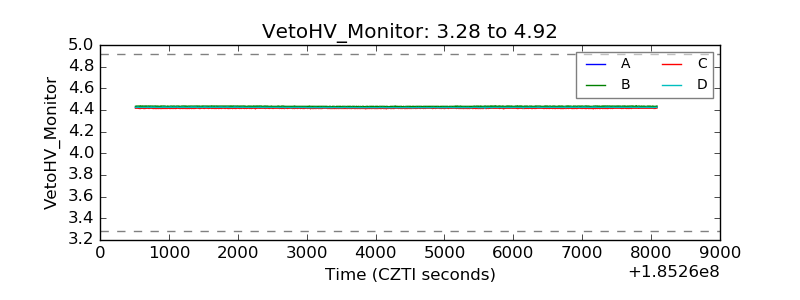 |
| Veto LLD | 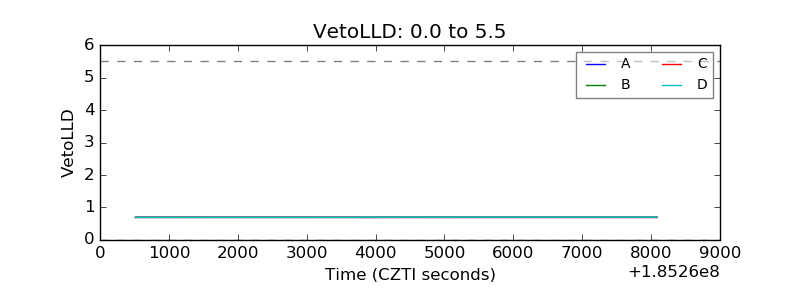 |
| Alpha Counter | 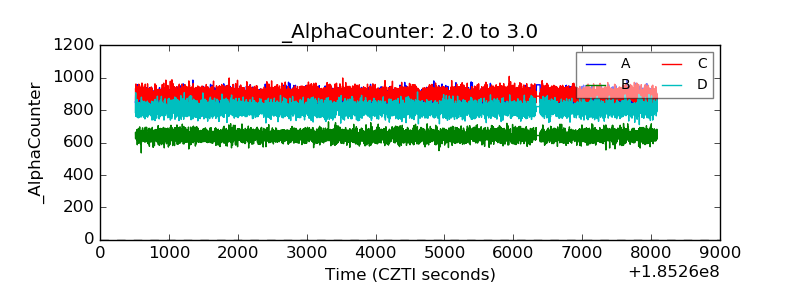 |
| _CPM_Rate | 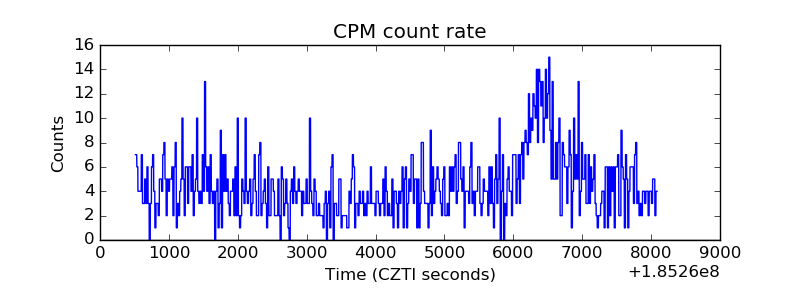 |
| CZT Counter | 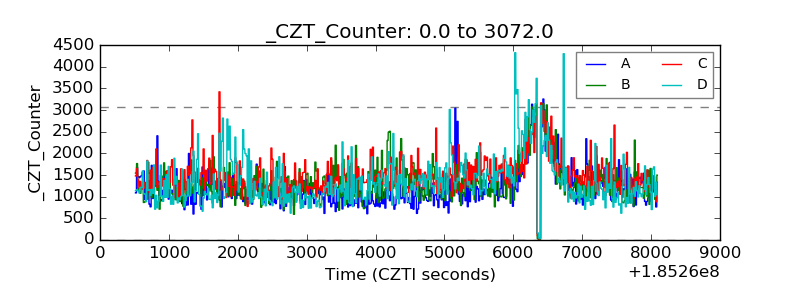 |
| +2.5 Volts monitor |  |
| +5 Volts monitor |  |
| _ROLL_ROT | 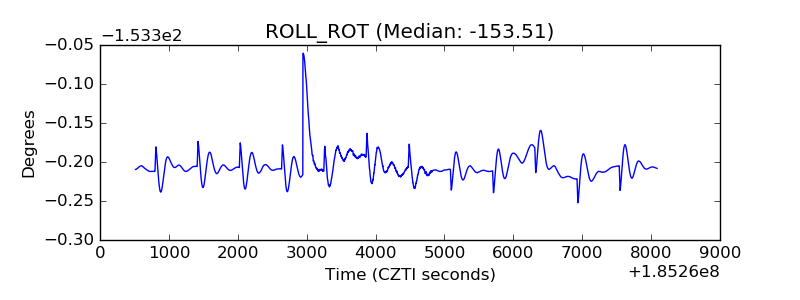 |
| _Roll_DEC | 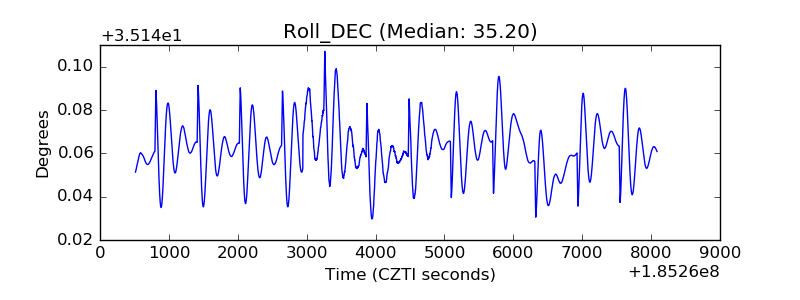 |
| _Roll_RA | 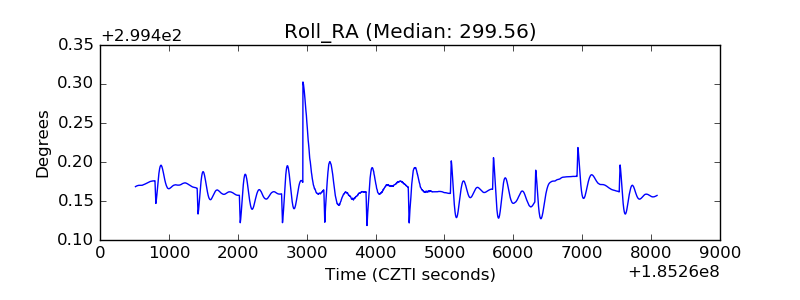 |
| Veto Counter | 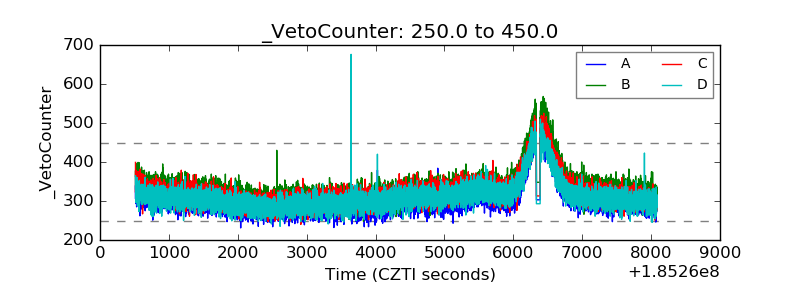 |