| Param | Original file | Final file |
|---|---|---|
| Filename | modeM0/AS1P01_147T01_9000000106_00714cztM0_level2.evt | modeM0/AS1P01_147T01_9000000106_00714cztM0_level2_quad_clean.evt |
| Size (bytes) | 1,246,645,440 | 75,323,520 |
| Size | 1.2 GB | 71.8 MB |
| Events in quadrant A | 8,514,962 | 462,625 |
| Events in quadrant B | 8,848,597 | 464,337 |
| Events in quadrant C | 9,818,301 | 448,491 |
| Events in quadrant D | 10,128,083 | 434,769 |
| Mode M9 | |||
|---|---|---|---|
| Quadrant | BADHDUFLAG | Total packets | Discarded packets |
| A | 0 | 1 | 0 |
| B | 0 | 1 | 0 |
| C | 0 | 1 | 0 |
| D | 0 | 1 | 0 |
| Mode SS | |||
|---|---|---|---|
| Quadrant | BADHDUFLAG | Total packets | Discarded packets |
| A | 0 | 136 | 0 |
| B | 0 | 136 | 0 |
| C | 0 | 136 | 0 |
| D | 0 | 136 | 0 |
| Mode M0 | |||
|---|---|---|---|
| Quadrant | BADHDUFLAG | Total packets | Discarded packets |
| A | 0 | 30073 | 1 |
| B | 0 | 31110 | 1 |
| C | 0 | 33879 | 1 |
| D | 0 | 34867 | 1 |
| Quadrant | Total seconds | Saturated seconds | Saturation percentage |
|---|---|---|---|
| A | 6756 | 55 | 0.814091% |
| B | 6756 | 52 | 0.769686% |
| C | 6756 | 41 | 0.606868% |
| D | 6756 | 135 | 1.998224% |
Noise dominated data is calculated using 1-second bins in cleaned event files. If a bin has >2000 counts, and if more than 50% of those come from <1% of pixels, then it is considered to be noise-dominated and hence unusable.
| Quadrant | # 1 sec bins | Bins with >0 counts | Bins with >2000 counts | High rate bins dominated by noise | Noise dominated (total time) | Noise dominated (detector-on time) | Marked lightcurve |
|---|---|---|---|---|---|---|---|
| A | 6801 | 6757 | 474 | 474 | 6.97% | 7.01% | 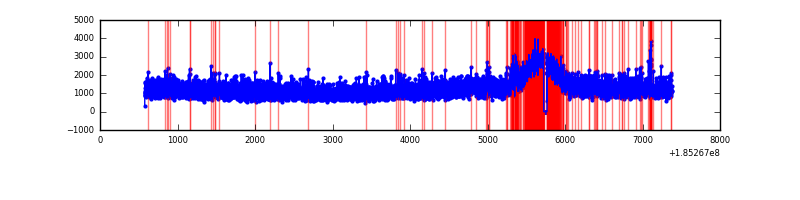 |
| B | 6801 | 6757 | 480 | 480 | 7.06% | 7.10% |  |
| C | 6801 | 6757 | 585 | 585 | 8.60% | 8.66% | 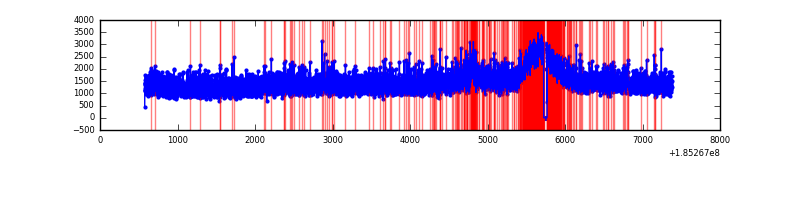 |
| D | 6801 | 6757 | 926 | 926 | 13.62% | 13.70% | 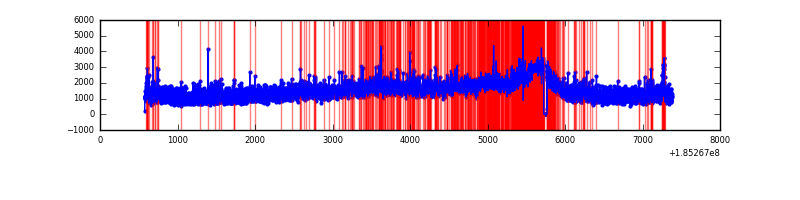 |
Top three noisy pixels from each quadrant. If the there are fewer than three noisy pixels in the level2.evt file, extra rows are filled as -1
| Pixel properties | Quadrant properties | ||||||
|---|---|---|---|---|---|---|---|
| Quadrant | DetID | PixID | Counts | Sigma | Mean | Median | Sigma |
| A | 15 | 171 | 188435 | 353.05 | 2163 | 2182 | 527.5 |
| A | 15 | 53 | 11442 | 17.55 | 2163 | 2182 | 527.5 |
| A | 10 | 133 | 9413 | 13.71 | 2163 | 2182 | 527.5 |
| B | 7 | 221 | 150869 | 279.78 | 2241 | 2255 | 531.2 |
| B | 5 | 247 | 61255 | 111.07 | 2241 | 2255 | 531.2 |
| B | 0 | 220 | 32591 | 57.11 | 2241 | 2255 | 531.2 |
| C | 3 | 95 | 444275 | 780.46 | 2013 | 2081 | 566.6 |
| C | 3 | 31 | 411057 | 721.83 | 2013 | 2081 | 566.6 |
| C | 3 | 15 | 323386 | 567.09 | 2013 | 2081 | 566.6 |
| D | 0 | 25 | 1997554 | 3236.9 | 1971 | 2047 | 616.5 |
| D | 6 | 226 | 175407 | 281.21 | 1971 | 2047 | 616.5 |
| D | 14 | 52 | 158444 | 253.69 | 1971 | 2047 | 616.5 |
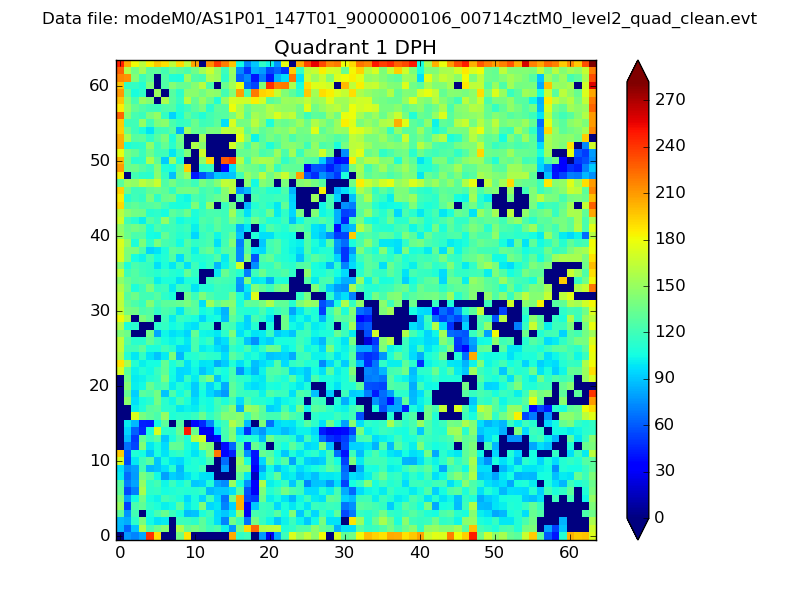
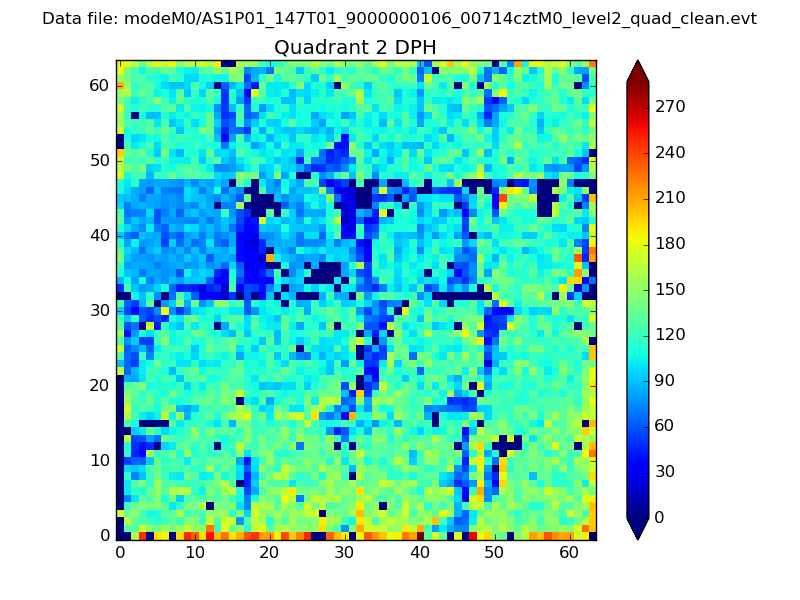
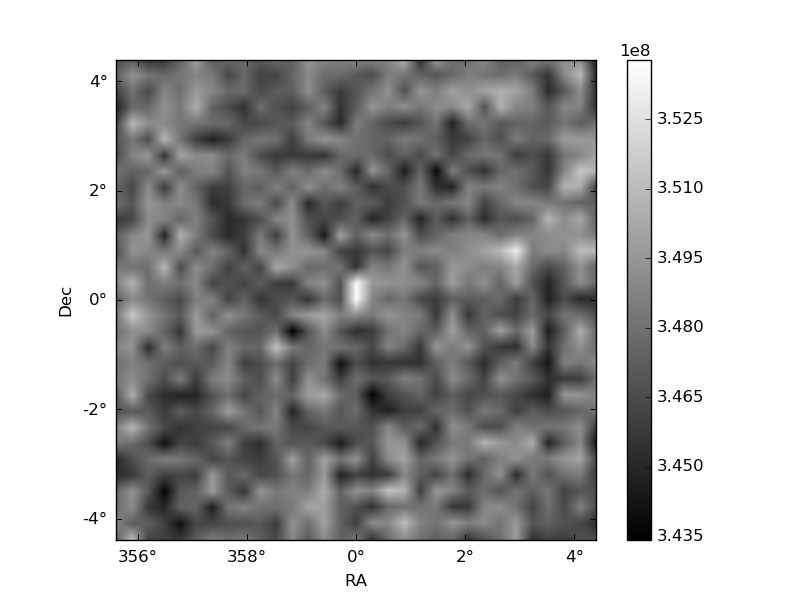
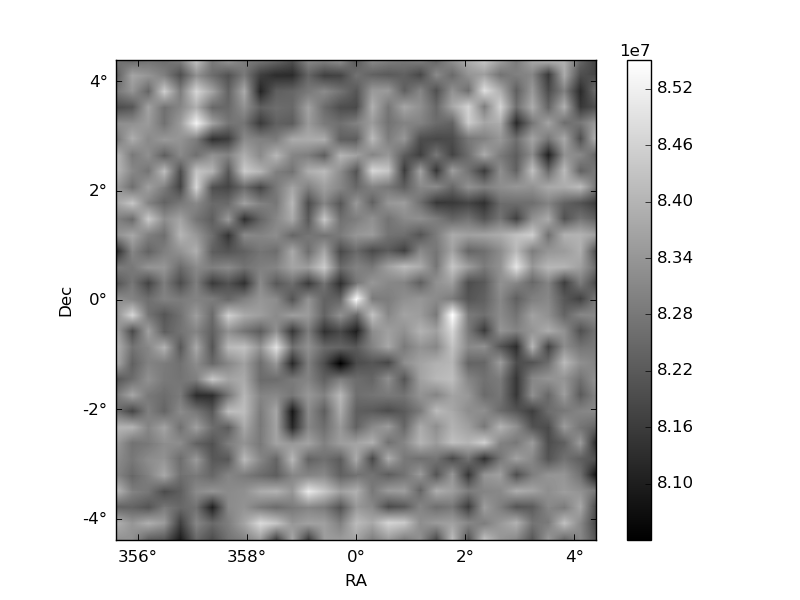
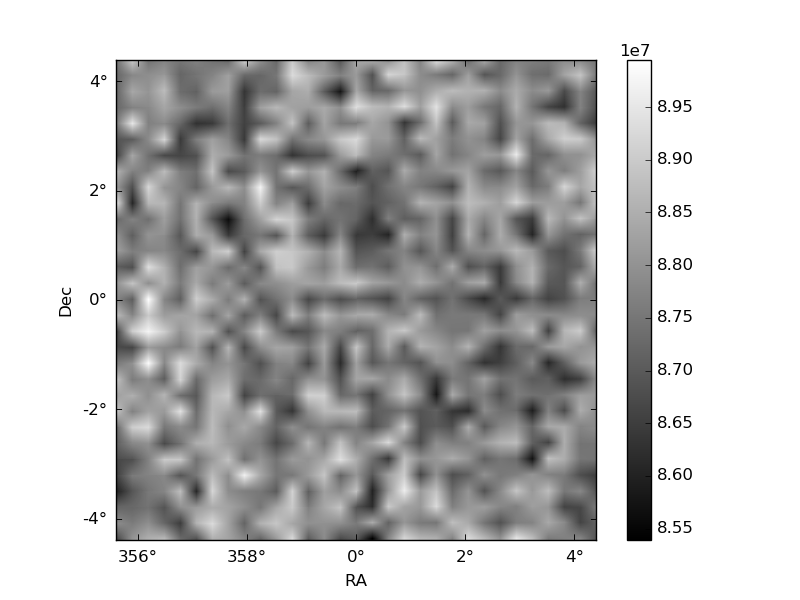
Histogram calculated using DETX and DETY for each event in the final _common_clean file
| Quadrant A | 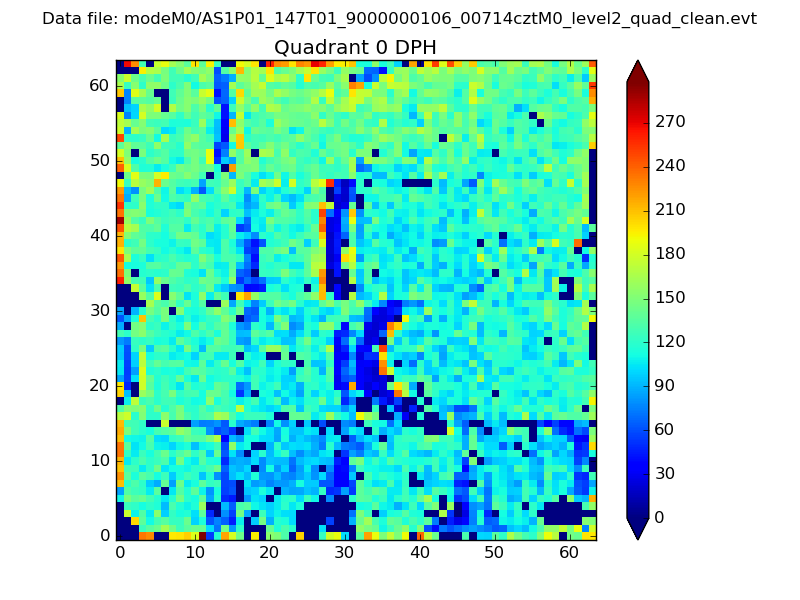 |
 |
Quadrant B |
|---|---|---|---|
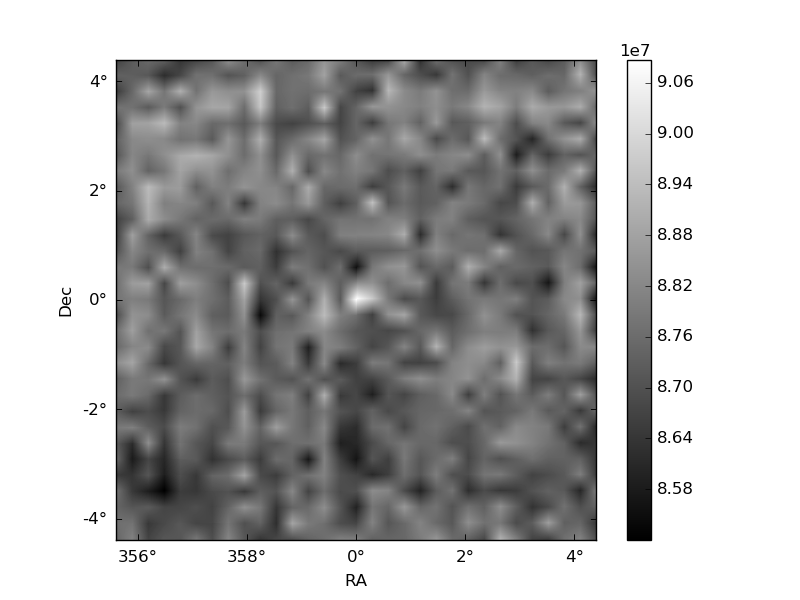
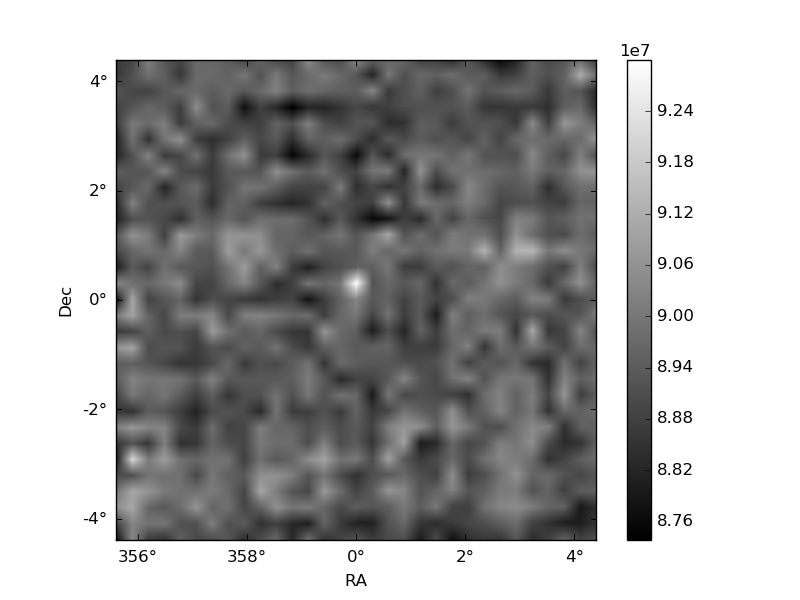
| Quadrant D | 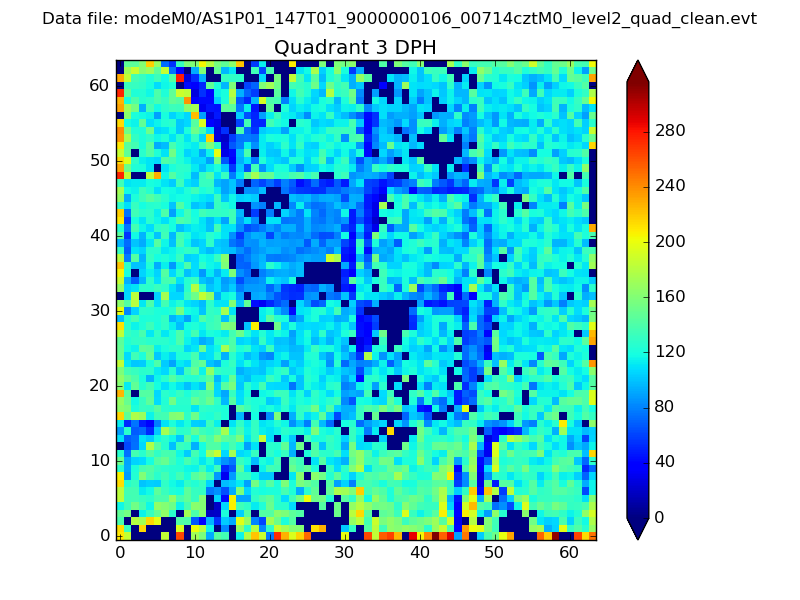 |
 |
Quadrant C |
| Plot type | Count rate plots | Images |
|---|---|---|
| Comparison with Poisson distribution Blue bars denote a histogram of data divided into 1 sec bins. Red curve is a Poisson curve with rate = median count rate of data. |
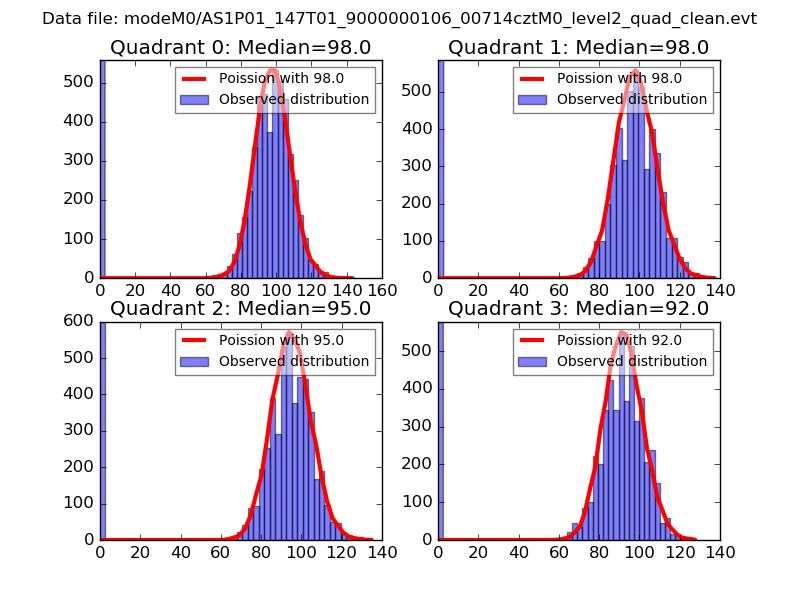 |
 |
| Quadrant-wise count rates Data is divided into 100 sec bins |
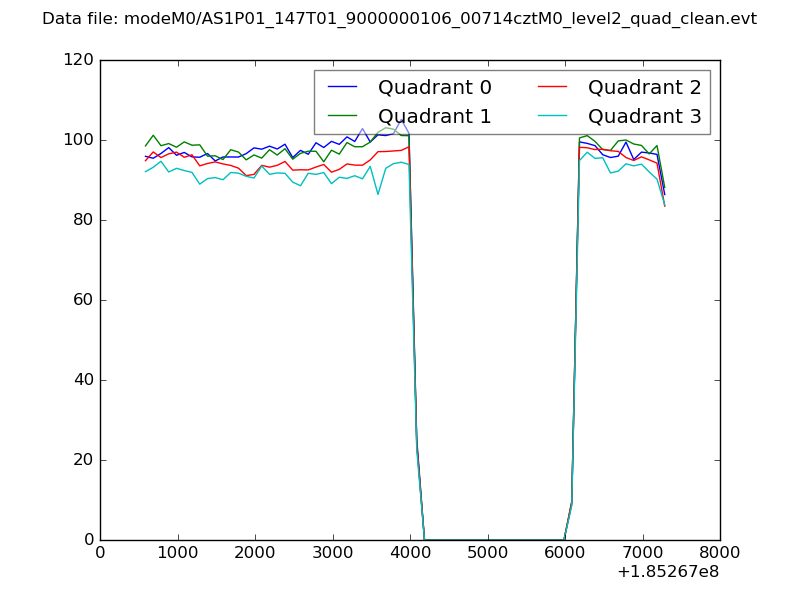 |
|
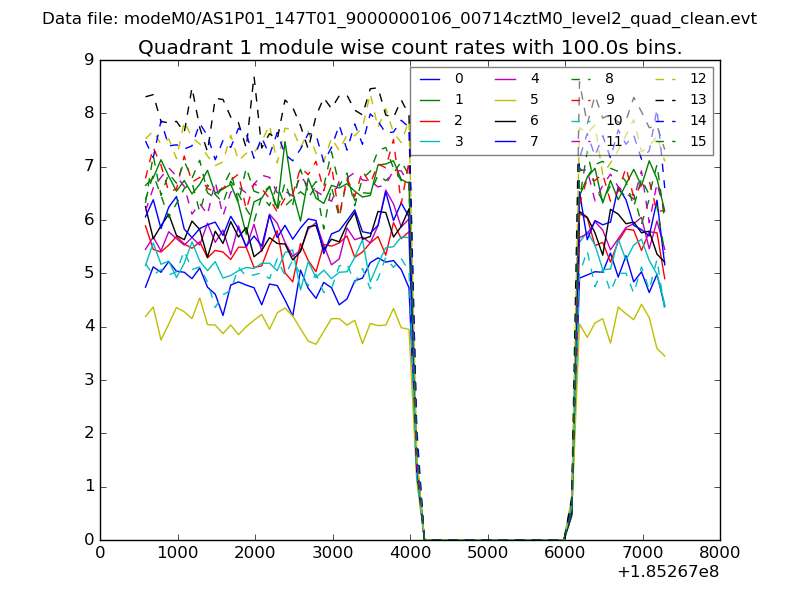
| Module-wise count rates for Quadrant A Data is divided into 100 sec bins |
 |
 |
| Module-wise count rates for Quadrant B Data is divided into 100 sec bins |
 |
 |
| Module-wise count rates for Quadrant C Data is divided into 100 sec bins |
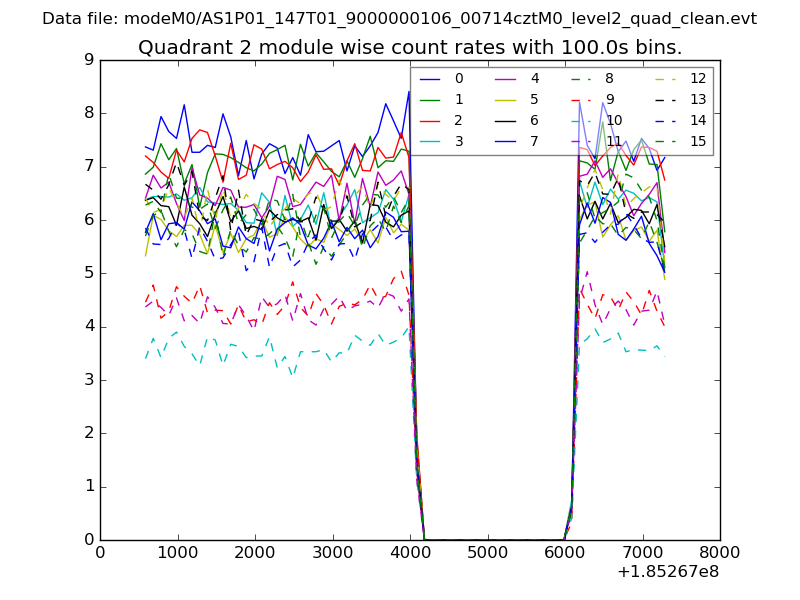 |
 |
| Module-wise count rates for Quadrant D Data is divided into 100 sec bins |
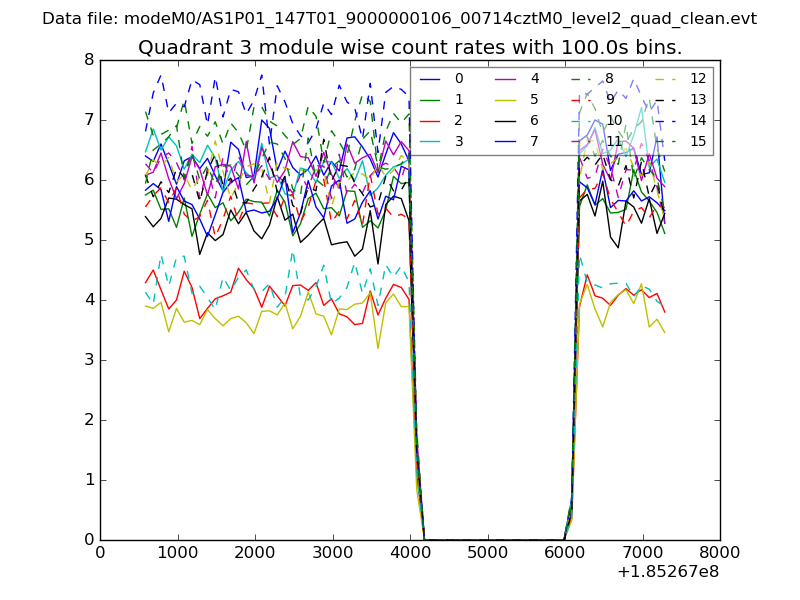 |
 |
| Parameter | Plot |
|---|---|
| CZT HV Monitor | 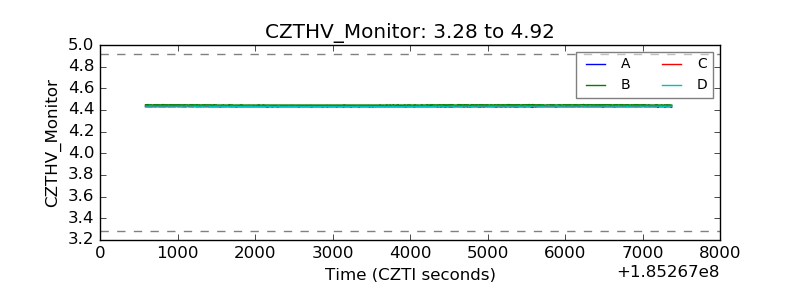 |
| D_VDD | 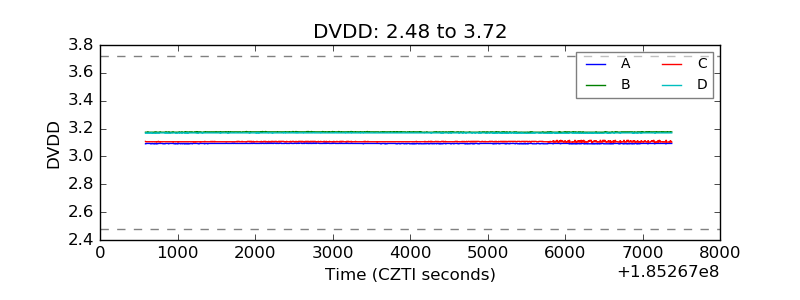 |
| Temperature 1 | 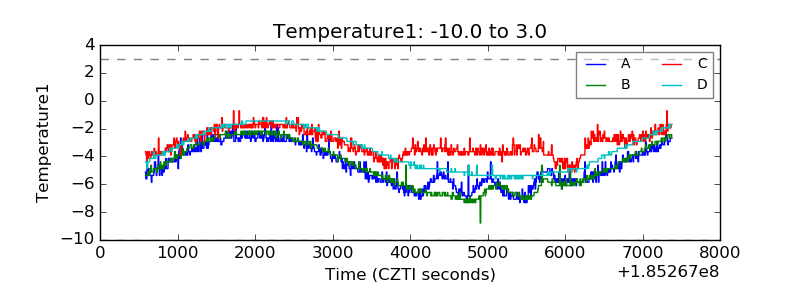 |
| Veto HV Monitor | 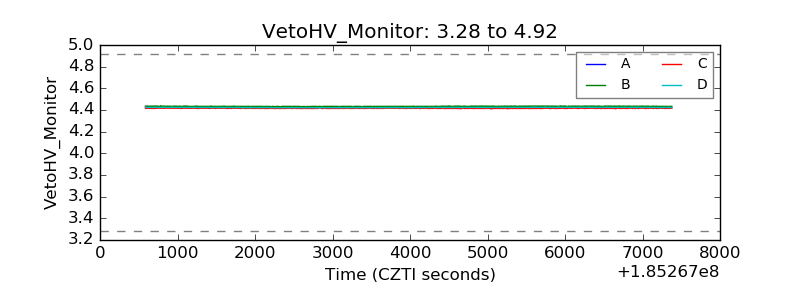 |
| Veto LLD | 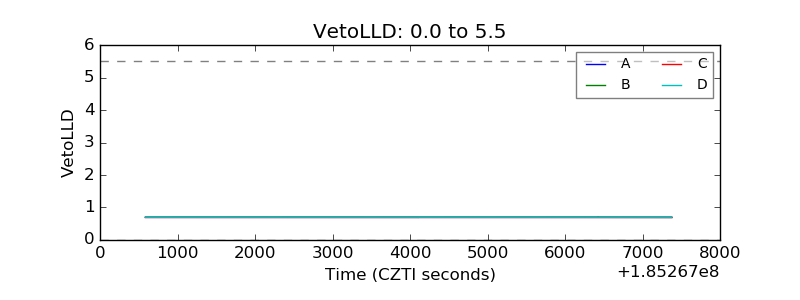 |
| Alpha Counter | 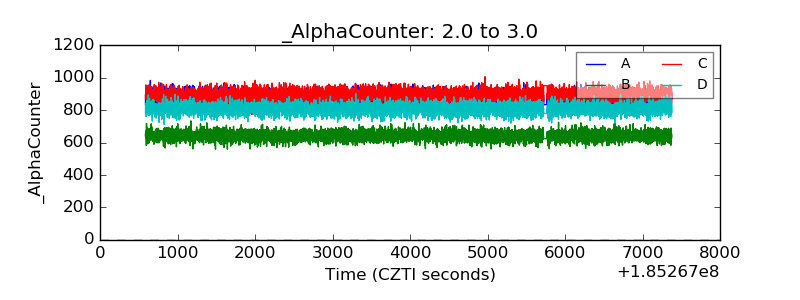 |
| _CPM_Rate | 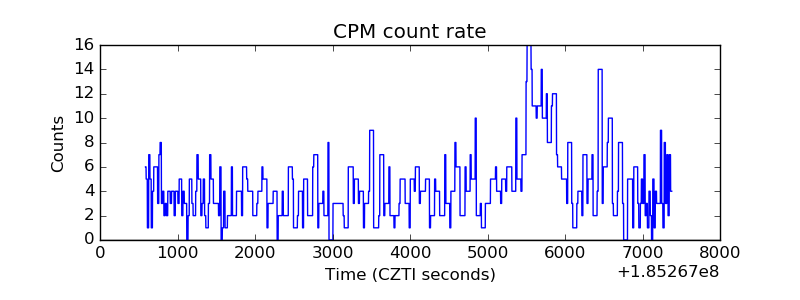 |
| CZT Counter | 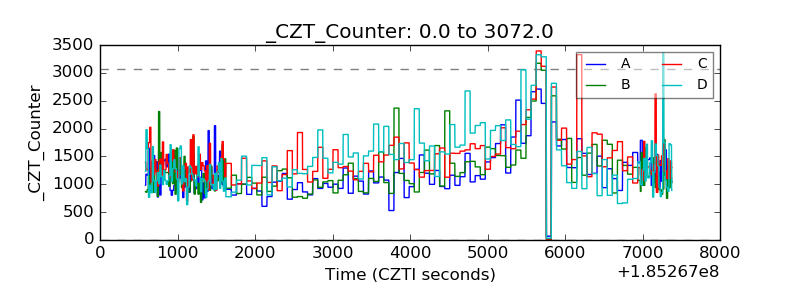 |
| +2.5 Volts monitor |  |
| +5 Volts monitor | 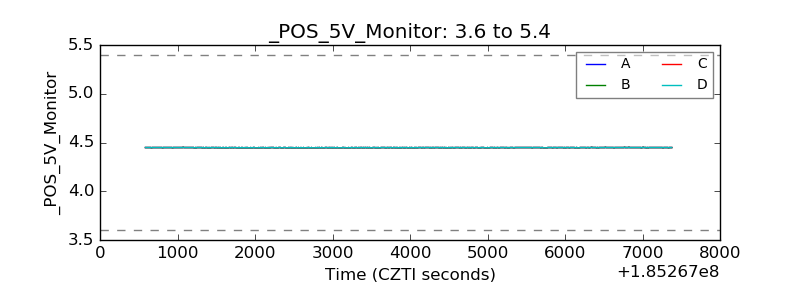 |
| _ROLL_ROT | 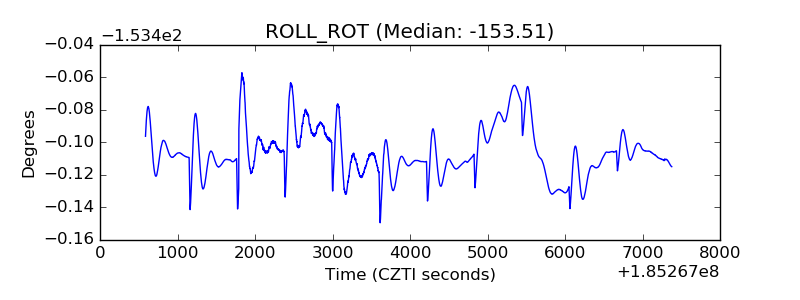 |
| _Roll_DEC | 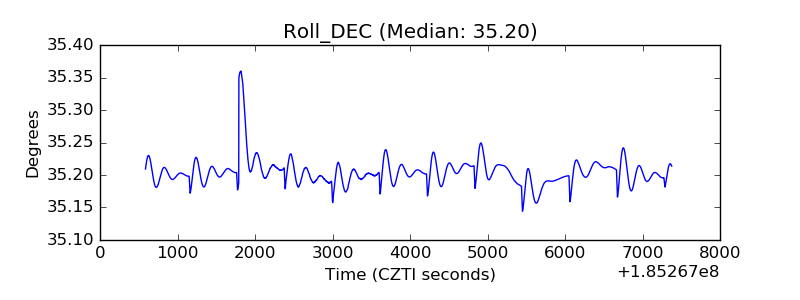 |
| _Roll_RA | 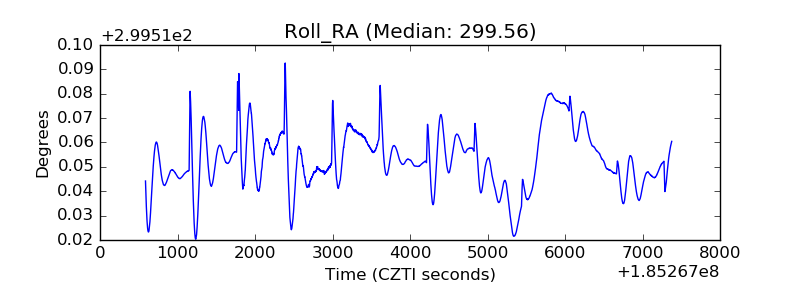 |
| Veto Counter | 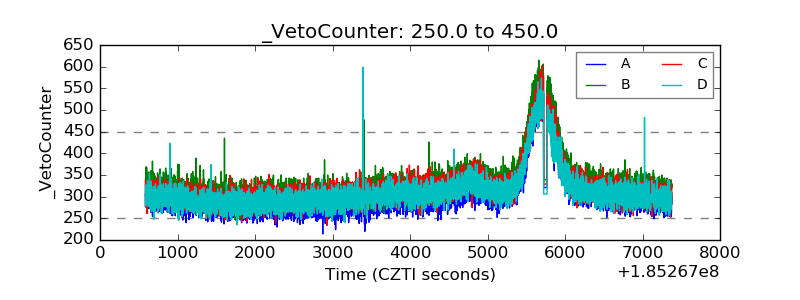 |