| Param | Original file | Final file |
|---|---|---|
| Filename | modeM0/AS1P01_147T01_9000000106_00715cztM0_level2.evt | modeM0/AS1P01_147T01_9000000106_00715cztM0_level2_quad_clean.evt |
| Size (bytes) | 1,297,180,800 | 80,205,120 |
| Size | 1.2 GB | 76.5 MB |
| Events in quadrant A | 8,587,543 | 503,234 |
| Events in quadrant B | 8,921,930 | 500,852 |
| Events in quadrant C | 10,148,778 | 477,925 |
| Events in quadrant D | 11,171,695 | 464,688 |
| Mode M9 | |||
|---|---|---|---|
| Quadrant | BADHDUFLAG | Total packets | Discarded packets |
| A | 0 | 3 | 0 |
| B | 0 | 3 | 0 |
| C | 0 | 3 | 0 |
| D | 0 | 3 | 0 |
| Mode SS | |||
|---|---|---|---|
| Quadrant | BADHDUFLAG | Total packets | Discarded packets |
| A | 0 | 140 | 0 |
| B | 0 | 140 | 0 |
| C | 0 | 140 | 0 |
| D | 0 | 140 | 0 |
| Mode M0 | |||
|---|---|---|---|
| Quadrant | BADHDUFLAG | Total packets | Discarded packets |
| A | 0 | 30436 | 1 |
| B | 0 | 31468 | 1 |
| C | 0 | 35042 | 1 |
| D | 0 | 38061 | 1 |
| Quadrant | Total seconds | Saturated seconds | Saturation percentage |
|---|---|---|---|
| A | 6954 | 77 | 1.107276% |
| B | 6927 | 82 | 1.183774% |
| C | 6875 | 63 | 0.916364% |
| D | 6928 | 233 | 3.363164% |
Noise dominated data is calculated using 1-second bins in cleaned event files. If a bin has >2000 counts, and if more than 50% of those come from <1% of pixels, then it is considered to be noise-dominated and hence unusable.
| Quadrant | # 1 sec bins | Bins with >0 counts | Bins with >2000 counts | High rate bins dominated by noise | Noise dominated (total time) | Noise dominated (detector-on time) | Marked lightcurve |
|---|---|---|---|---|---|---|---|
| A | 7234 | 6955 | 367 | 367 | 5.07% | 5.28% | 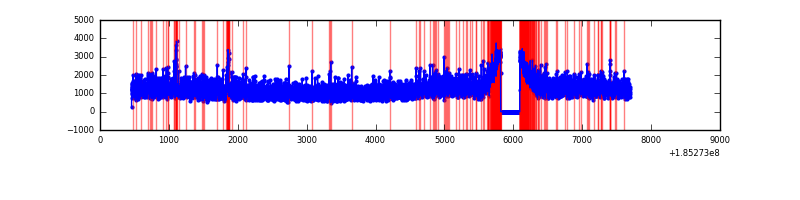 |
| B | 7234 | 6929 | 426 | 426 | 5.89% | 6.15% |  |
| C | 7234 | 6877 | 518 | 518 | 7.16% | 7.53% | 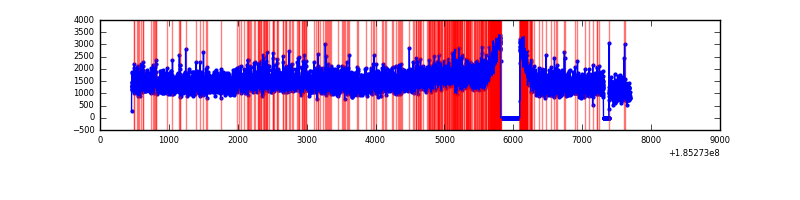 |
| D | 7235 | 6930 | 1497 | 1497 | 20.69% | 21.60% | 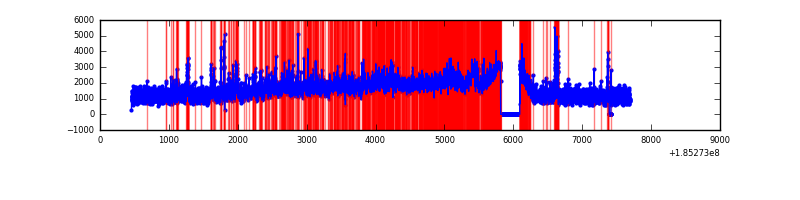 |
Top three noisy pixels from each quadrant. If the there are fewer than three noisy pixels in the level2.evt file, extra rows are filled as -1
| Pixel properties | Quadrant properties | ||||||
|---|---|---|---|---|---|---|---|
| Quadrant | DetID | PixID | Counts | Sigma | Mean | Median | Sigma |
| A | 15 | 171 | 94207 | 172.31 | 2204 | 2224 | 533.8 |
| A | 13 | 67 | 20349 | 33.95 | 2204 | 2224 | 533.8 |
| A | 13 | 8 | 19071 | 31.56 | 2204 | 2224 | 533.8 |
| B | 14 | 50 | 77791 | 140.48 | 2257 | 2270 | 537.6 |
| B | 5 | 247 | 61868 | 110.86 | 2257 | 2270 | 537.6 |
| B | 7 | 221 | 58247 | 104.13 | 2257 | 2270 | 537.6 |
| C | 3 | 95 | 618249 | 1094.32 | 2014 | 2085 | 563.1 |
| C | 3 | 31 | 466060 | 824.03 | 2014 | 2085 | 563.1 |
| C | 3 | 15 | 416902 | 736.73 | 2014 | 2085 | 563.1 |
| D | 0 | 25 | 2649353 | 4287.72 | 1989 | 2066 | 617.4 |
| D | 14 | 52 | 285330 | 458.79 | 1989 | 2066 | 617.4 |
| D | 6 | 226 | 275172 | 442.34 | 1989 | 2066 | 617.4 |
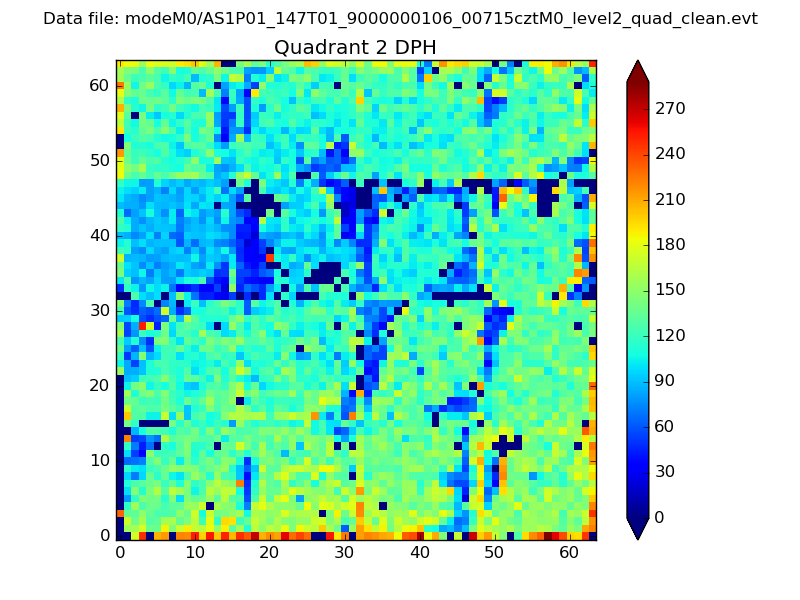
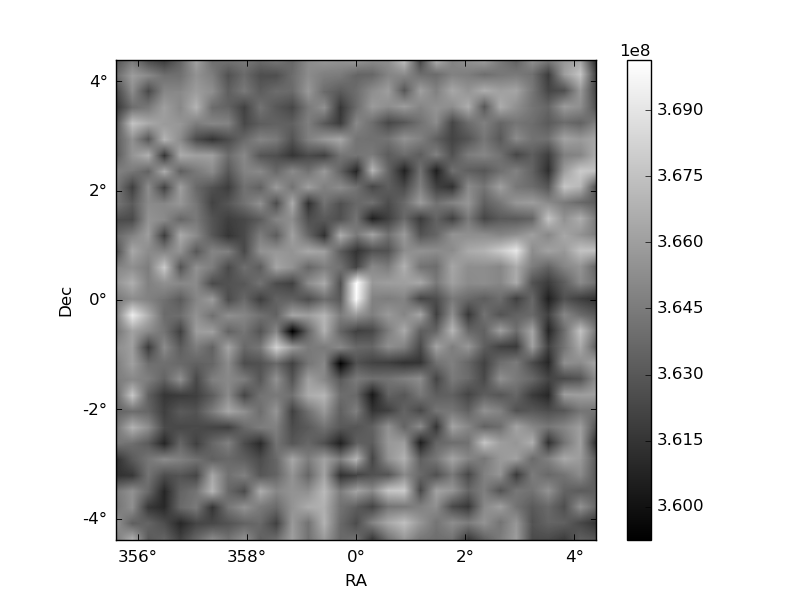
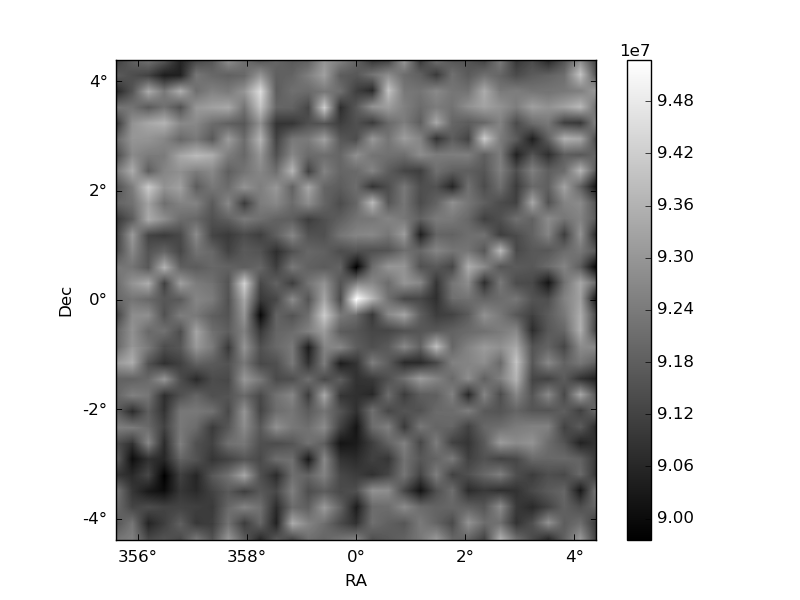
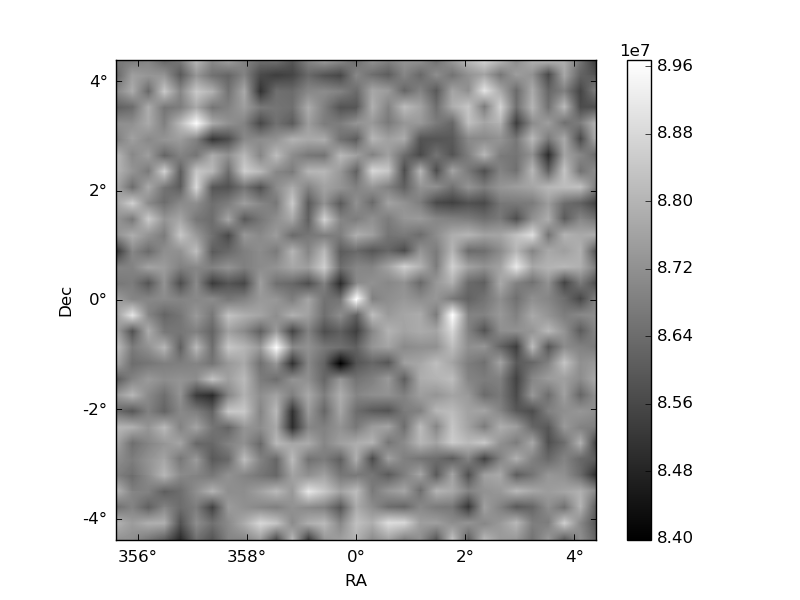
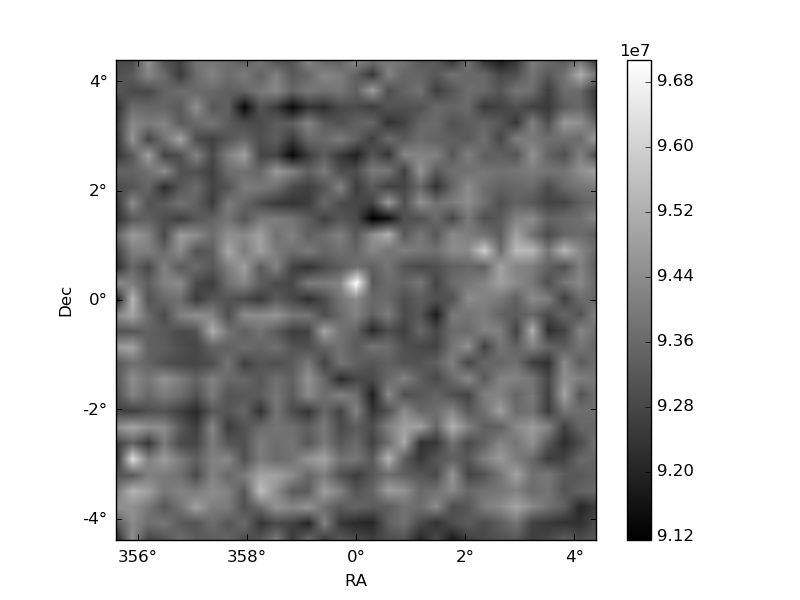
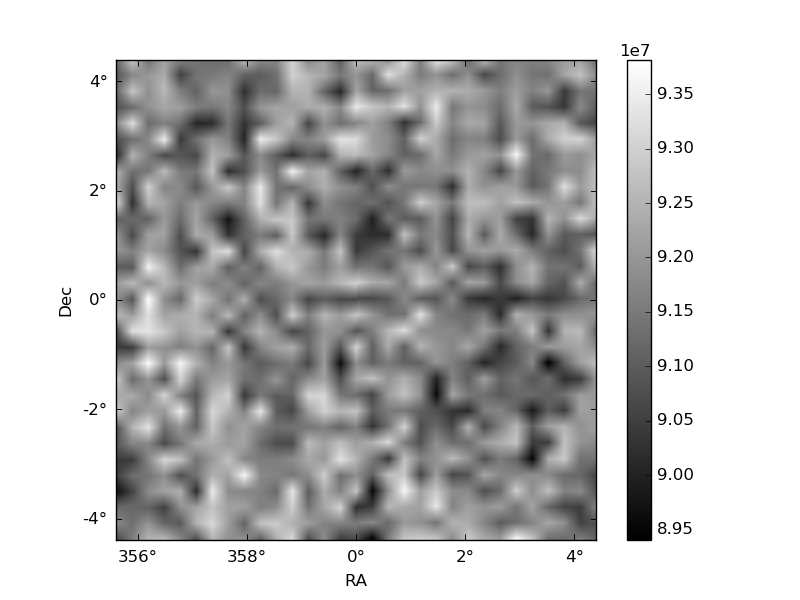
Histogram calculated using DETX and DETY for each event in the final _common_clean file
| Quadrant A | 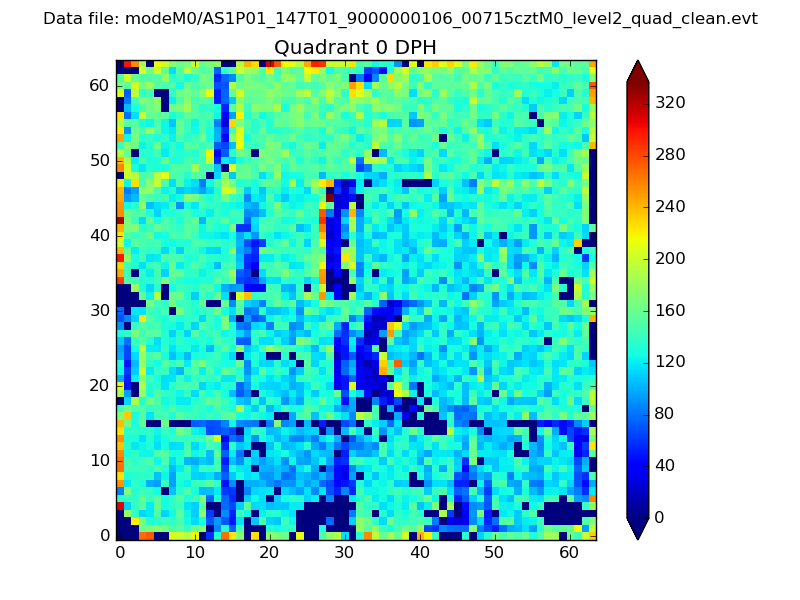 |
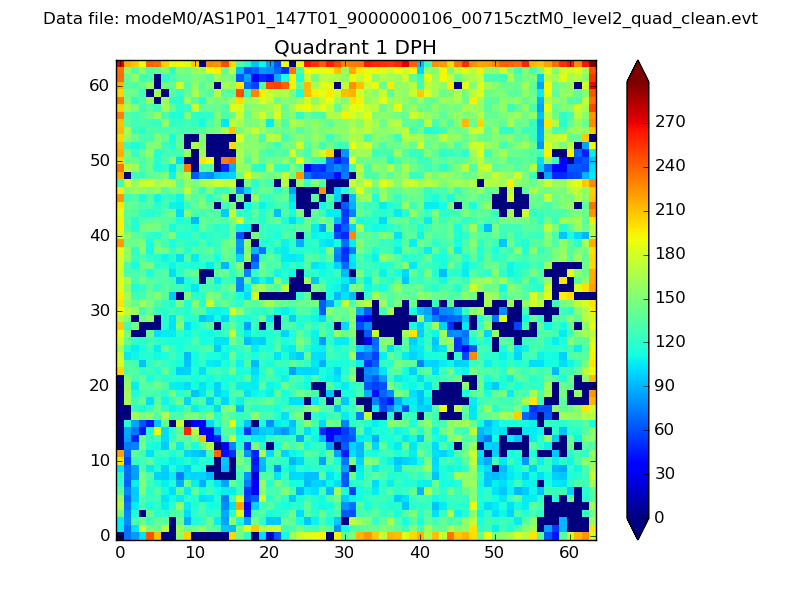 |
Quadrant B |
|---|---|---|---|
| Quadrant D | 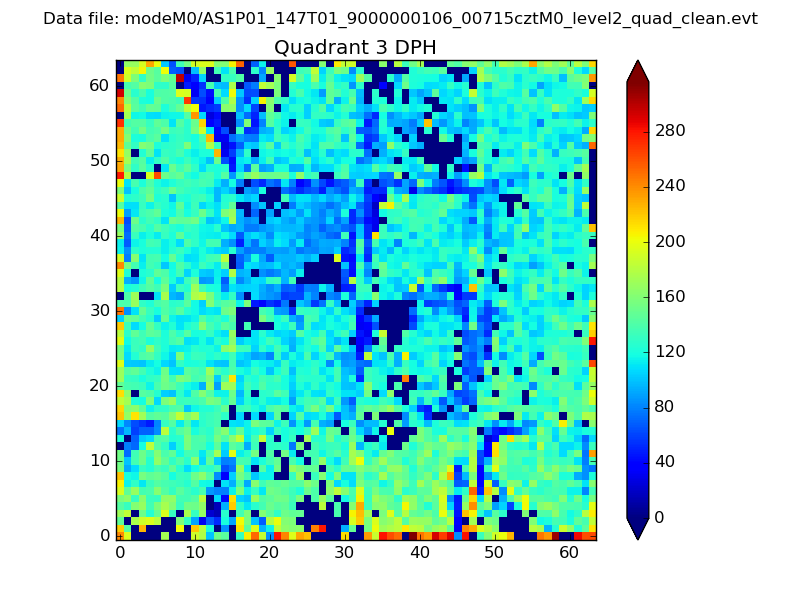 |
 |
Quadrant C |
| Plot type | Count rate plots | Images |
|---|---|---|
| Comparison with Poisson distribution Blue bars denote a histogram of data divided into 1 sec bins. Red curve is a Poisson curve with rate = median count rate of data. |
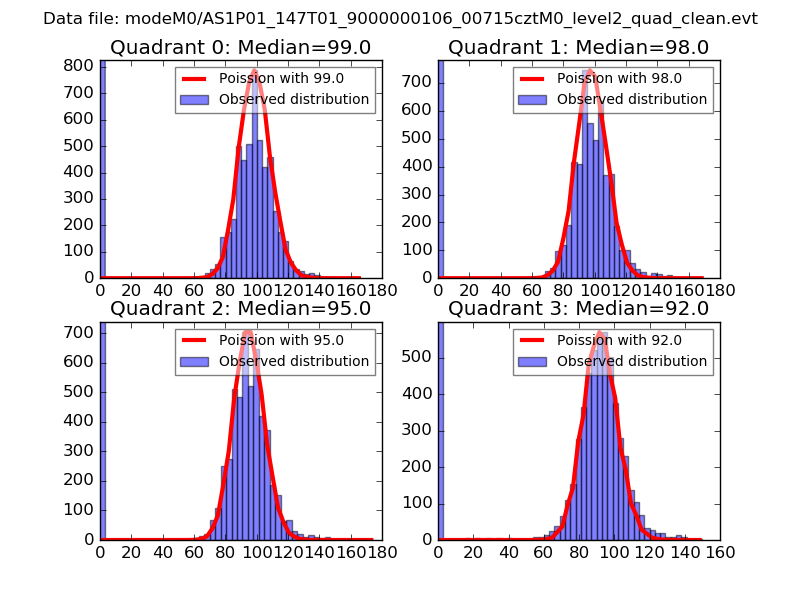 |
 |
| Quadrant-wise count rates Data is divided into 100 sec bins |
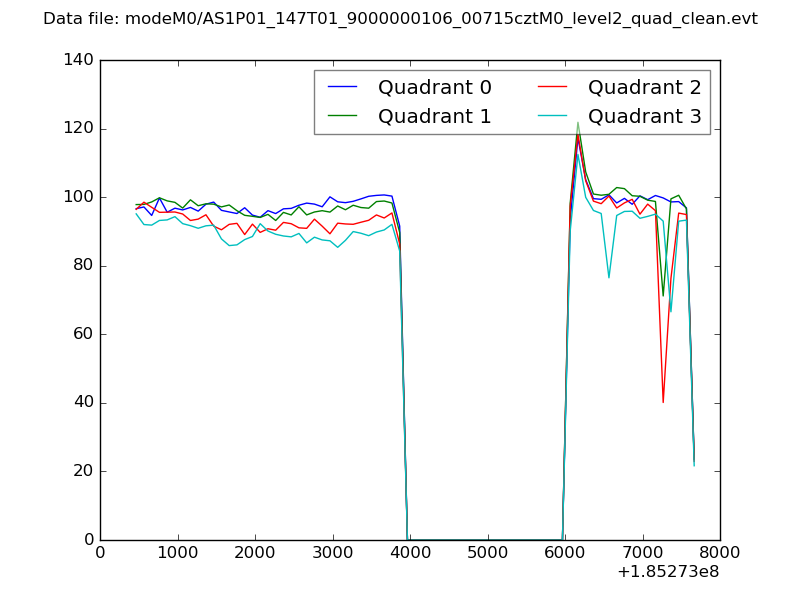 |
|
| Module-wise count rates for Quadrant A Data is divided into 100 sec bins |
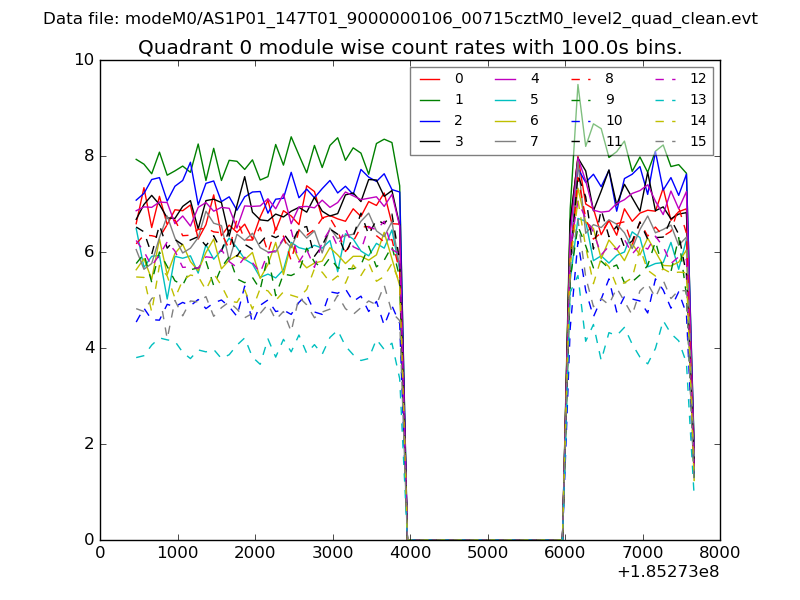 |
 |
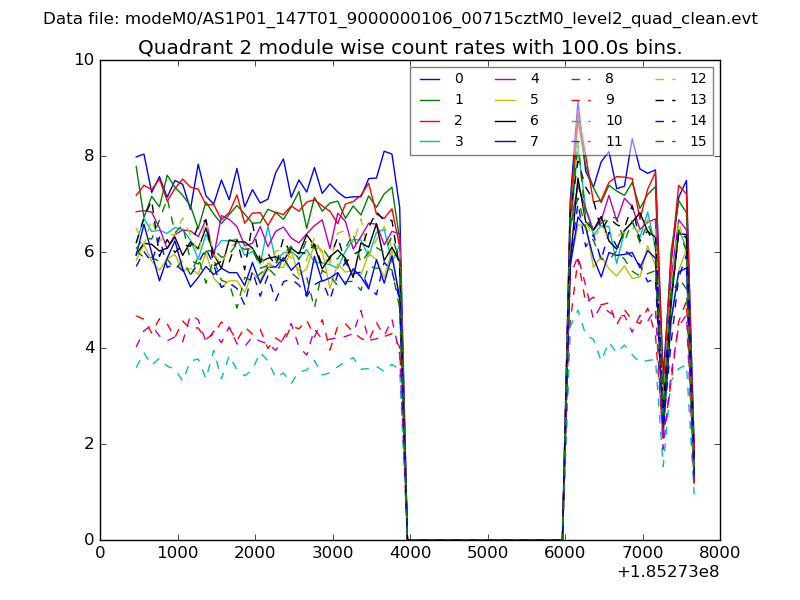
| Module-wise count rates for Quadrant B Data is divided into 100 sec bins |
 |
 |
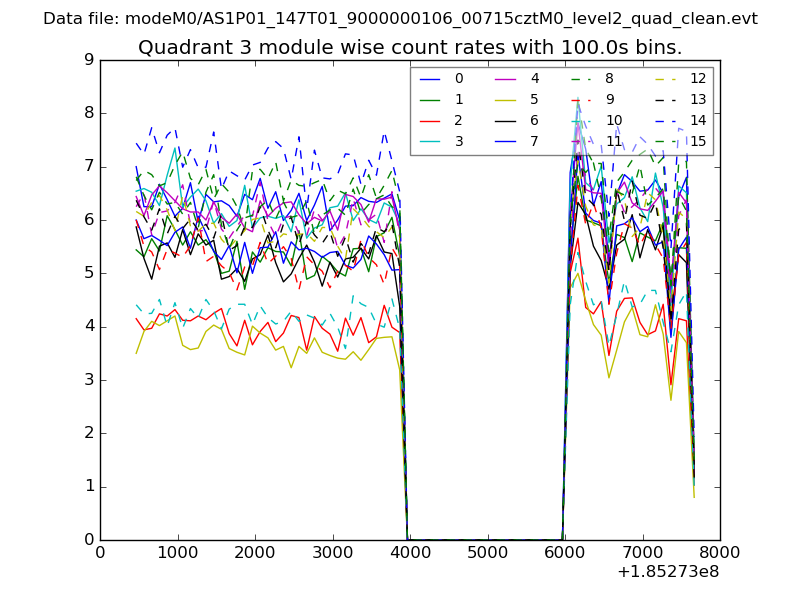
| Module-wise count rates for Quadrant C Data is divided into 100 sec bins |
 |
 |
| Module-wise count rates for Quadrant D Data is divided into 100 sec bins |
 |
 |
| Parameter | Plot |
|---|---|
| CZT HV Monitor | 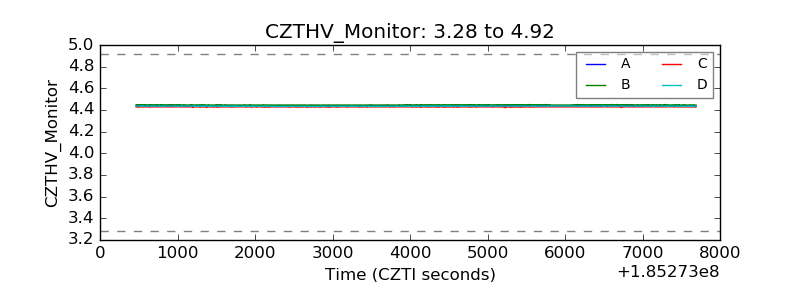 |
| D_VDD | 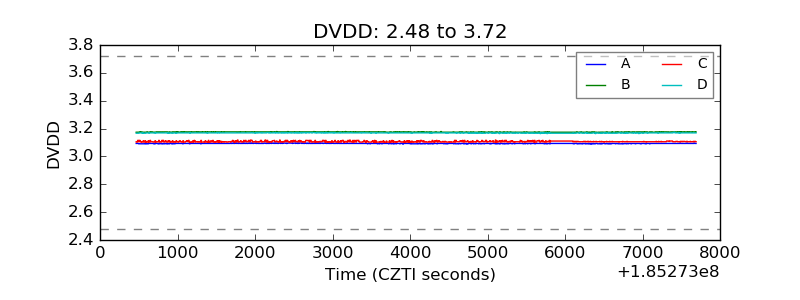 |
| Temperature 1 | 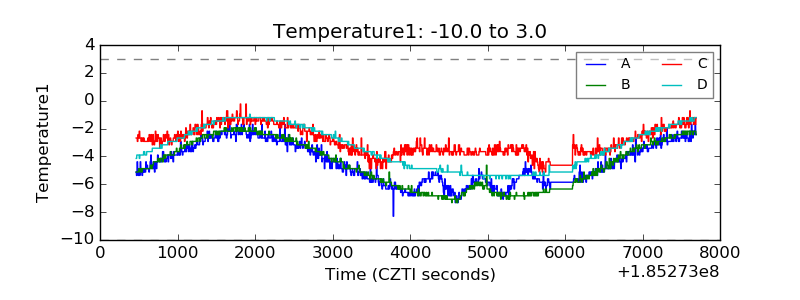 |
| Veto HV Monitor | 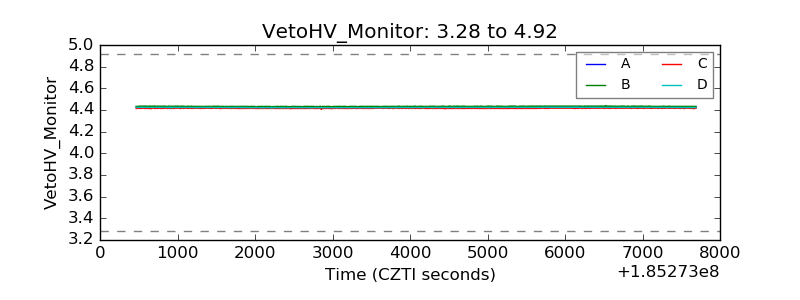 |
| Veto LLD | 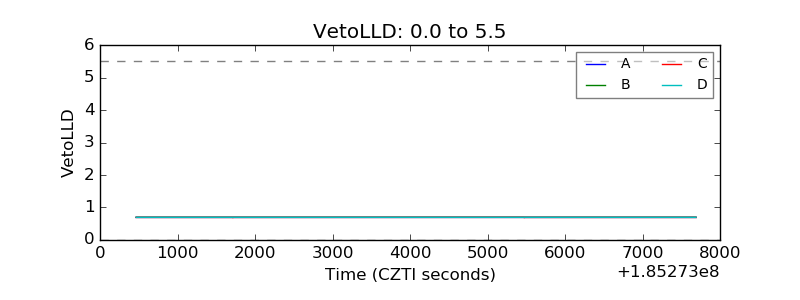 |
| Alpha Counter | 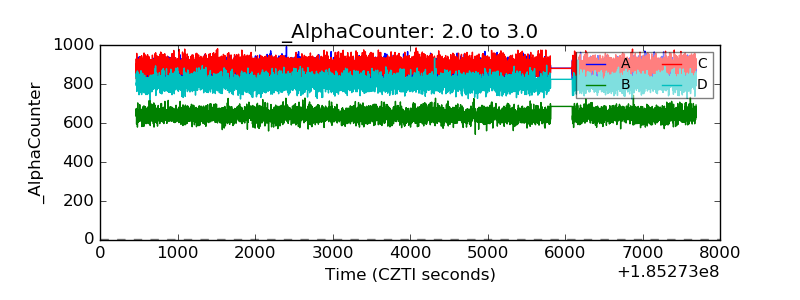 |
| _CPM_Rate | 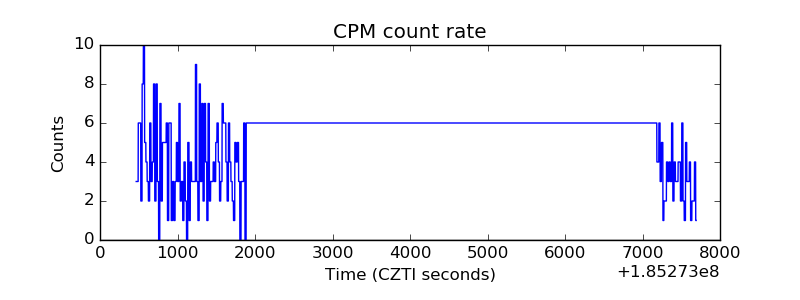 |
| CZT Counter | 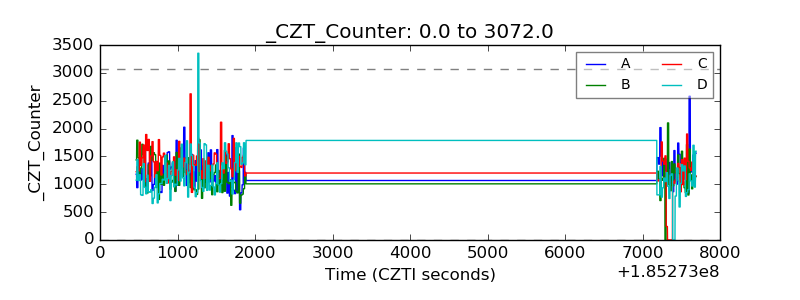 |
| +2.5 Volts monitor |  |
| +5 Volts monitor | 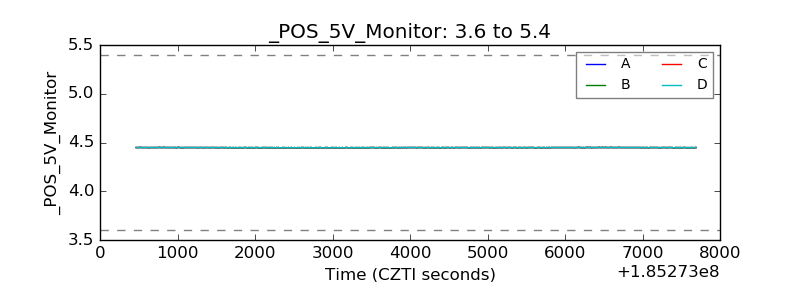 |
| _ROLL_ROT | 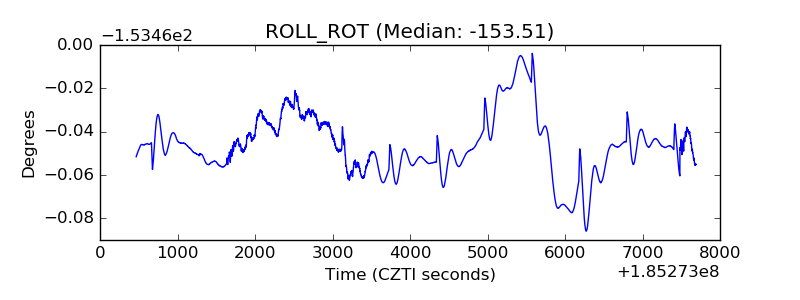 |
| _Roll_DEC | 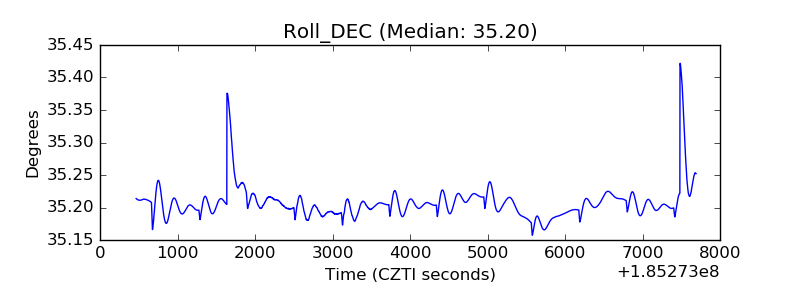 |
| _Roll_RA | 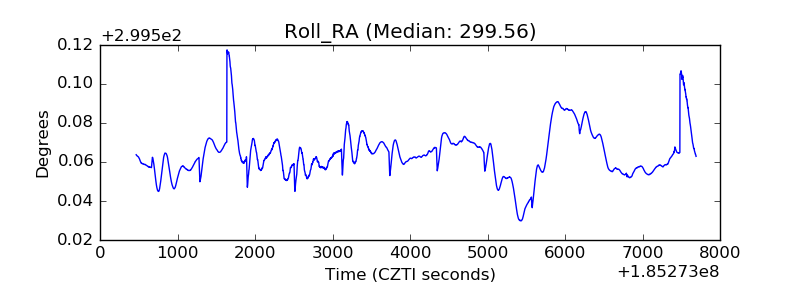 |
| Veto Counter |  |