| Param | Original file | Final file |
|---|---|---|
| Filename | modeM0/AS1P01_147T01_9000000106_00716cztM0_level2.evt | modeM0/AS1P01_147T01_9000000106_00716cztM0_level2_quad_clean.evt |
| Size (bytes) | 1,030,337,280 | 70,384,320 |
| Size | 982.6 MB | 67.1 MB |
| Events in quadrant A | 7,781,982 | 432,003 |
| Events in quadrant B | 7,903,021 | 430,060 |
| Events in quadrant C | 7,466,980 | 414,473 |
| Events in quadrant D | 7,626,643 | 407,318 |
| Mode M9 | |||
|---|---|---|---|
| Quadrant | BADHDUFLAG | Total packets | Discarded packets |
| A | 0 | 6 | 0 |
| B | 0 | 6 | 0 |
| C | 0 | 6 | 0 |
| D | 0 | 6 | 0 |
| Mode SS | |||
|---|---|---|---|
| Quadrant | BADHDUFLAG | Total packets | Discarded packets |
| A | 0 | 130 | 0 |
| B | 0 | 130 | 0 |
| C | 0 | 130 | 0 |
| D | 0 | 130 | 0 |
| Mode M0 | |||
|---|---|---|---|
| Quadrant | BADHDUFLAG | Total packets | Discarded packets |
| A | 0 | 27752 | 1 |
| B | 0 | 28050 | 1 |
| C | 0 | 26792 | 3 |
| D | 0 | 27281 | 1 |
| Quadrant | Total seconds | Saturated seconds | Saturation percentage |
|---|---|---|---|
| A | 6446 | 47 | 0.729134% |
| B | 6419 | 36 | 0.560835% |
| C | 6367 | 24 | 0.376944% |
| D | 6419 | 150 | 2.336813% |
Noise dominated data is calculated using 1-second bins in cleaned event files. If a bin has >2000 counts, and if more than 50% of those come from <1% of pixels, then it is considered to be noise-dominated and hence unusable.
| Quadrant | # 1 sec bins | Bins with >0 counts | Bins with >2000 counts | High rate bins dominated by noise | Noise dominated (total time) | Noise dominated (detector-on time) | Marked lightcurve |
|---|---|---|---|---|---|---|---|
| A | 7011 | 6447 | 261 | 261 | 3.72% | 4.05% | 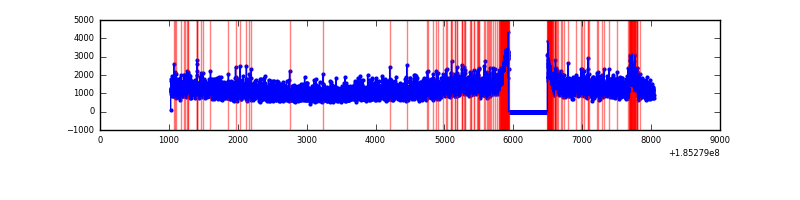 |
| B | 7011 | 6421 | 240 | 240 | 3.42% | 3.74% | 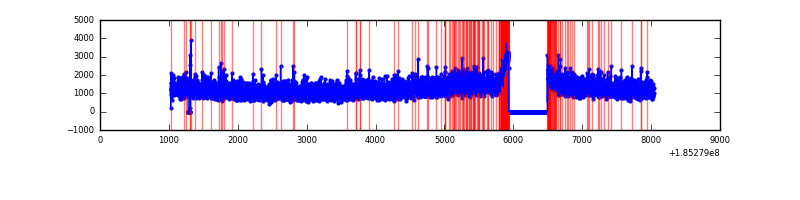 |
| C | 7011 | 6369 | 152 | 152 | 2.17% | 2.39% | 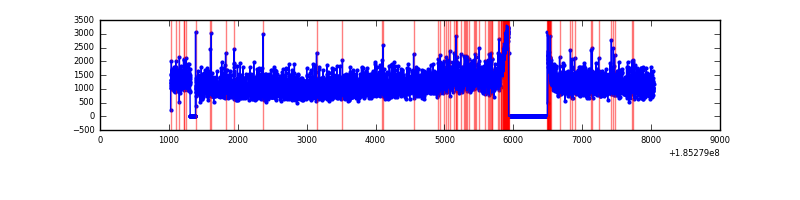 |
| D | 7011 | 6421 | 336 | 336 | 4.79% | 5.23% | 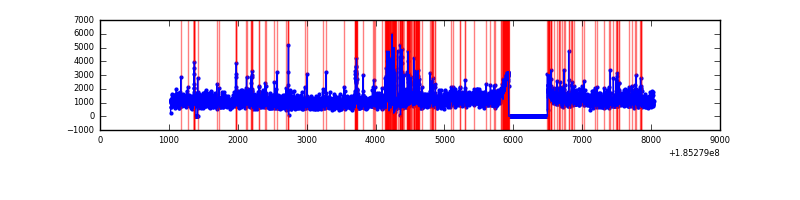 |
Top three noisy pixels from each quadrant. If the there are fewer than three noisy pixels in the level2.evt file, extra rows are filled as -1
| Pixel properties | Quadrant properties | ||||||
|---|---|---|---|---|---|---|---|
| Quadrant | DetID | PixID | Counts | Sigma | Mean | Median | Sigma |
| A | 15 | 171 | 103250 | 209.9 | 1990 | 2000 | 482.4 |
| A | 10 | 230 | 38238 | 75.12 | 1990 | 2000 | 482.4 |
| A | 11 | 79 | 6845 | 10.04 | 1990 | 2000 | 482.4 |
| B | 0 | 220 | 52592 | 103.97 | 2042 | 2053 | 486.1 |
| B | 5 | 191 | 39940 | 77.94 | 2042 | 2053 | 486.1 |
| B | 0 | 207 | 23523 | 44.17 | 2042 | 2053 | 486.1 |
| C | 15 | 241 | 128253 | 244.43 | 1845 | 1915 | 516.9 |
| C | 3 | 111 | 32443 | 59.06 | 1845 | 1915 | 516.9 |
| C | 3 | 79 | 22025 | 38.91 | 1845 | 1915 | 516.9 |
| D | 9 | 52 | 433393 | 767.03 | 1809 | 1876 | 562.6 |
| D | 6 | 226 | 149112 | 261.72 | 1809 | 1876 | 562.6 |
| D | 1 | 4 | 85195 | 148.1 | 1809 | 1876 | 562.6 |
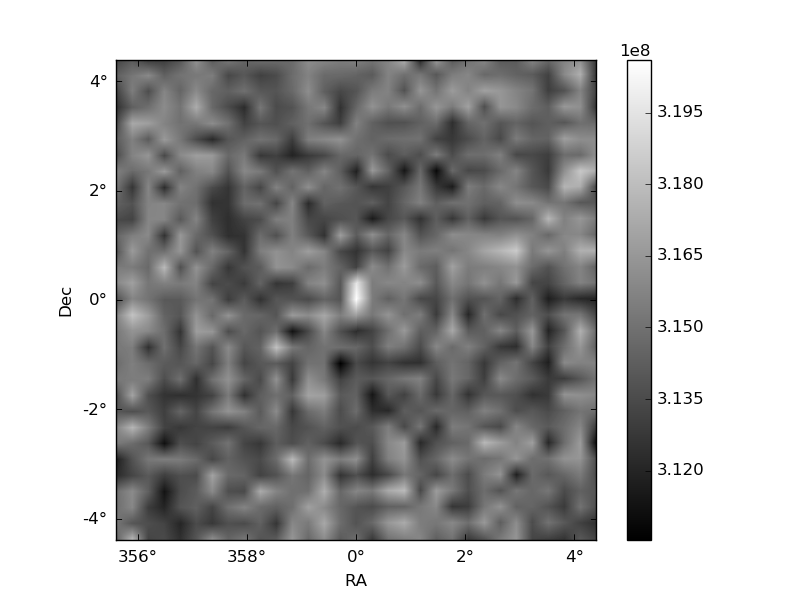
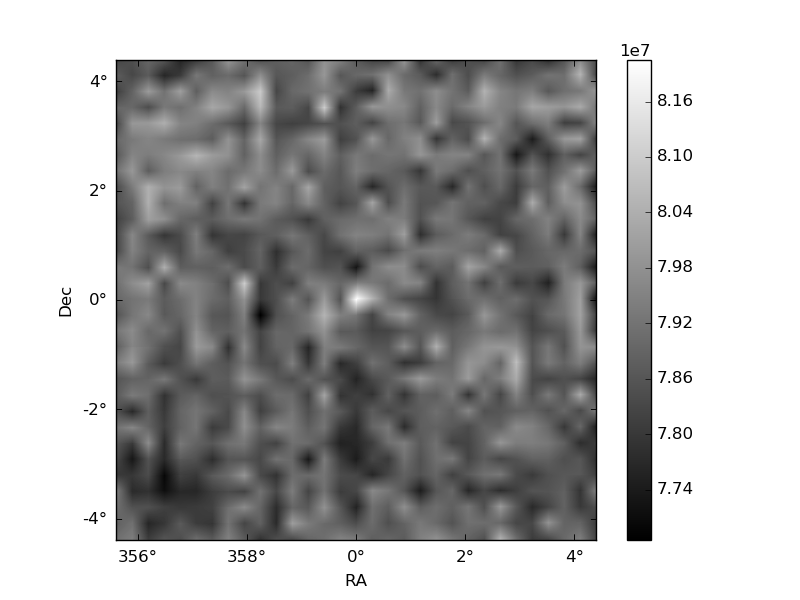
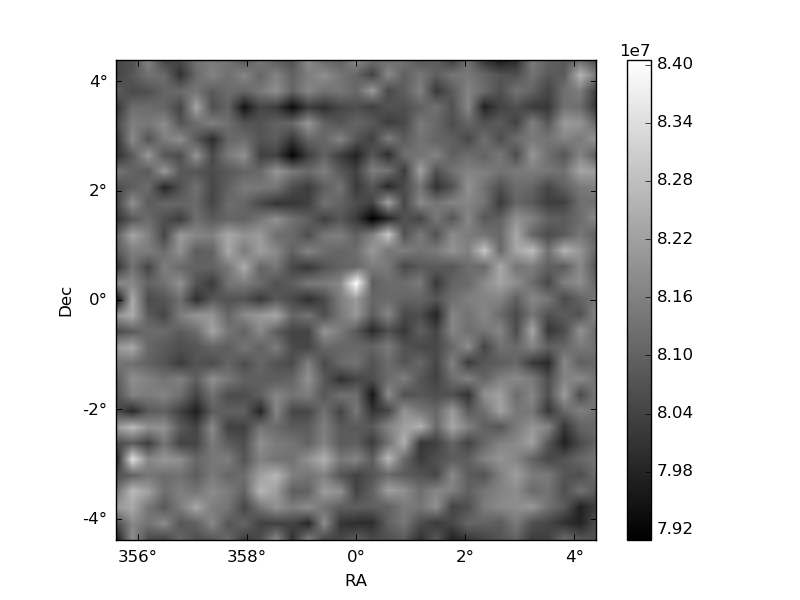
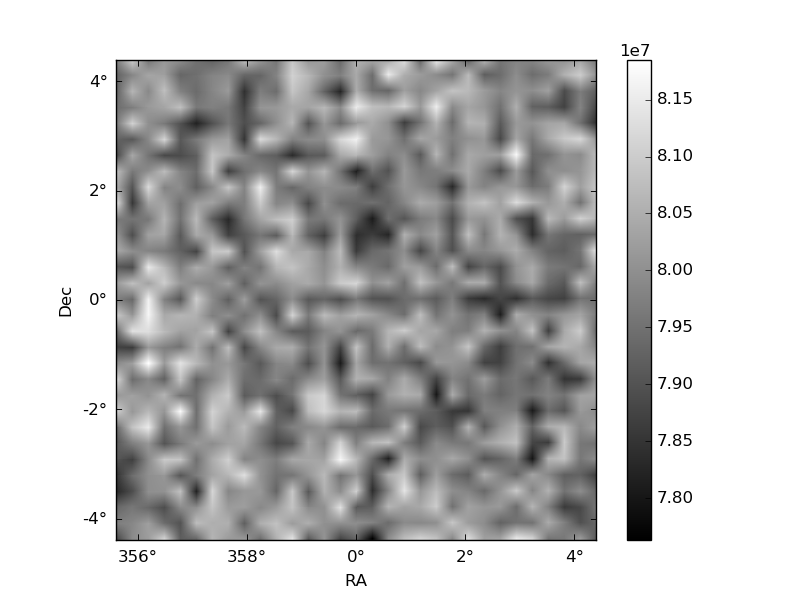
Histogram calculated using DETX and DETY for each event in the final _common_clean file
| Quadrant A | 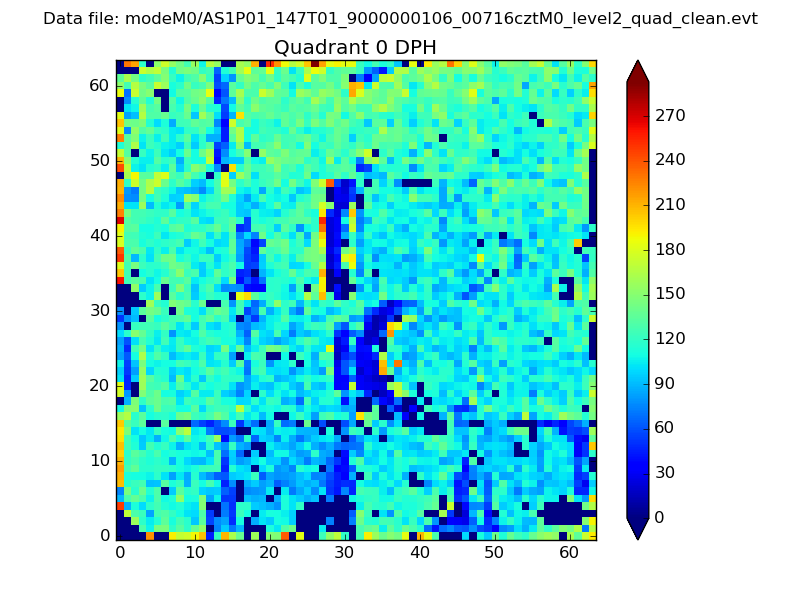 |
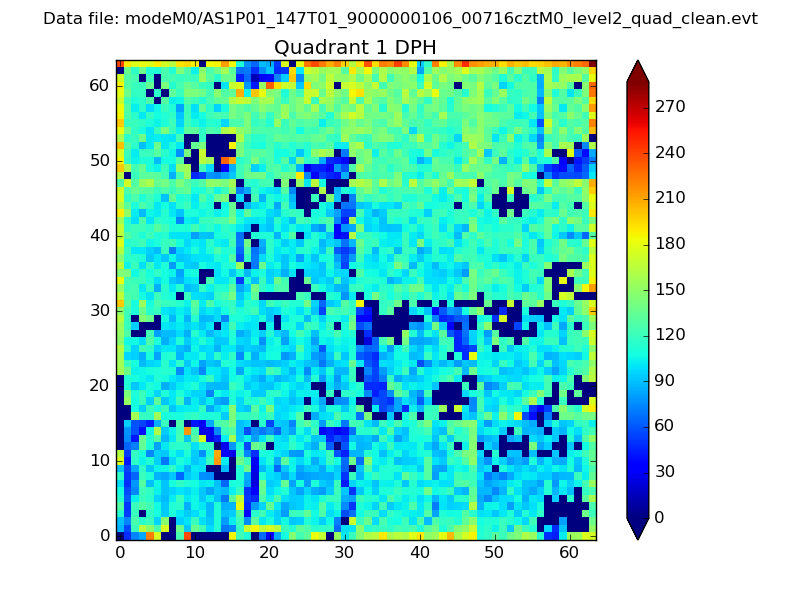 |
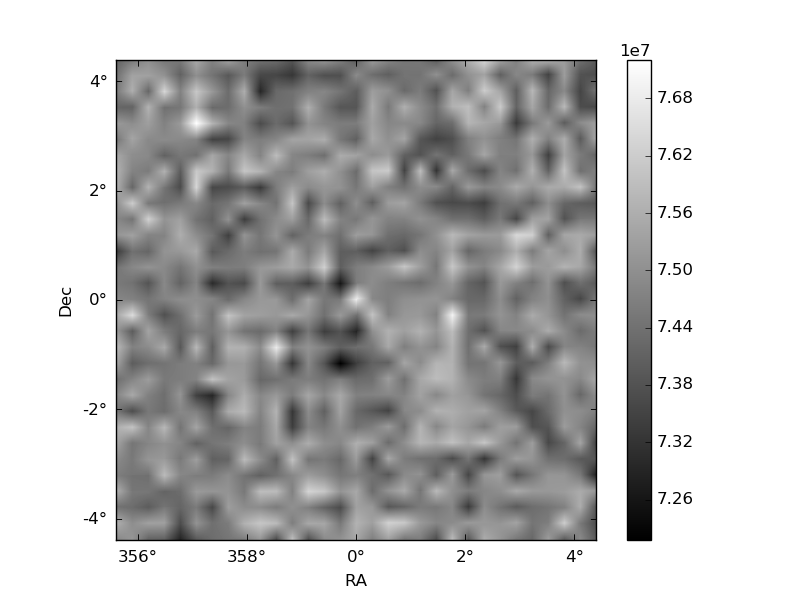
Quadrant B |
|---|---|---|---|
| Quadrant D | 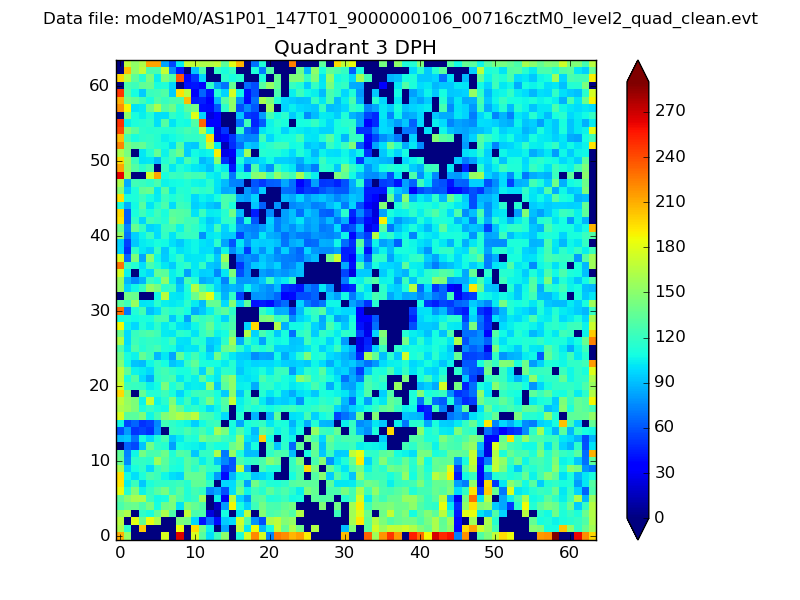 |
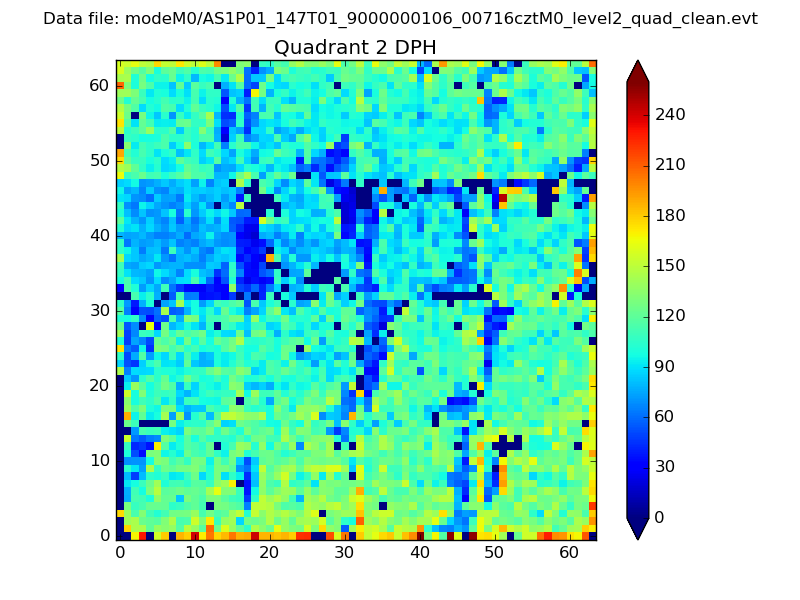 |
Quadrant C |
| Plot type | Count rate plots | Images |
|---|---|---|
| Comparison with Poisson distribution Blue bars denote a histogram of data divided into 1 sec bins. Red curve is a Poisson curve with rate = median count rate of data. |
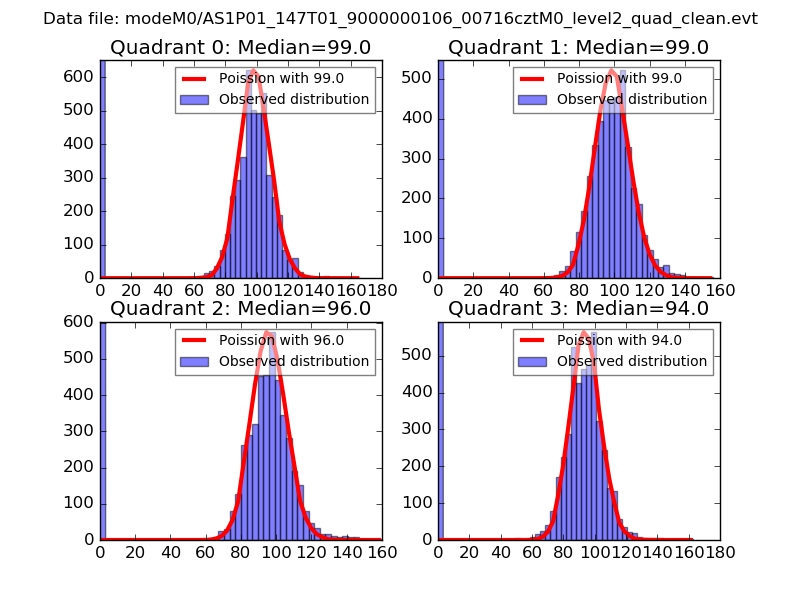 |
 |
| Quadrant-wise count rates Data is divided into 100 sec bins |
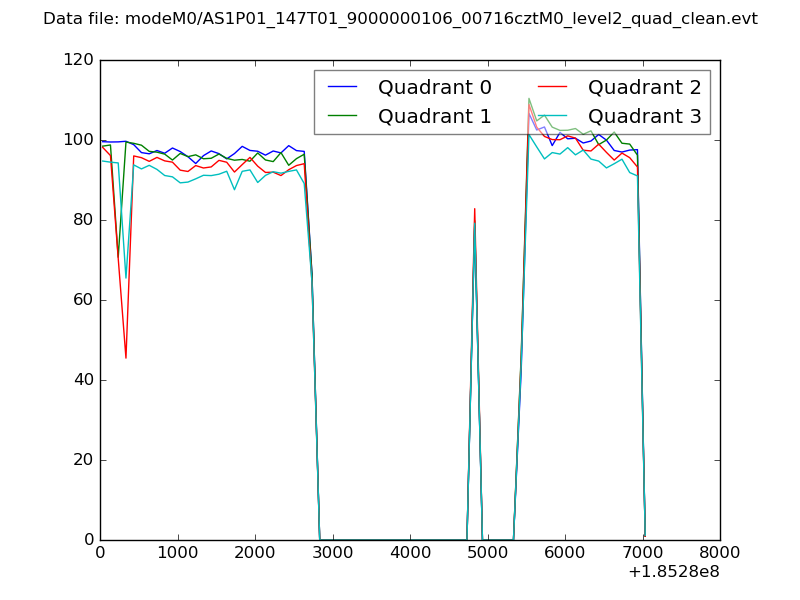 |
|
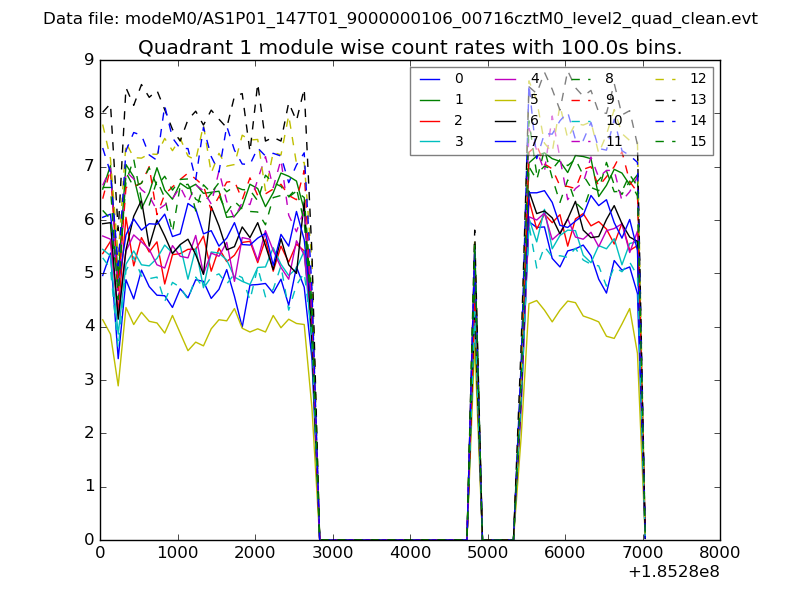
| Module-wise count rates for Quadrant A Data is divided into 100 sec bins |
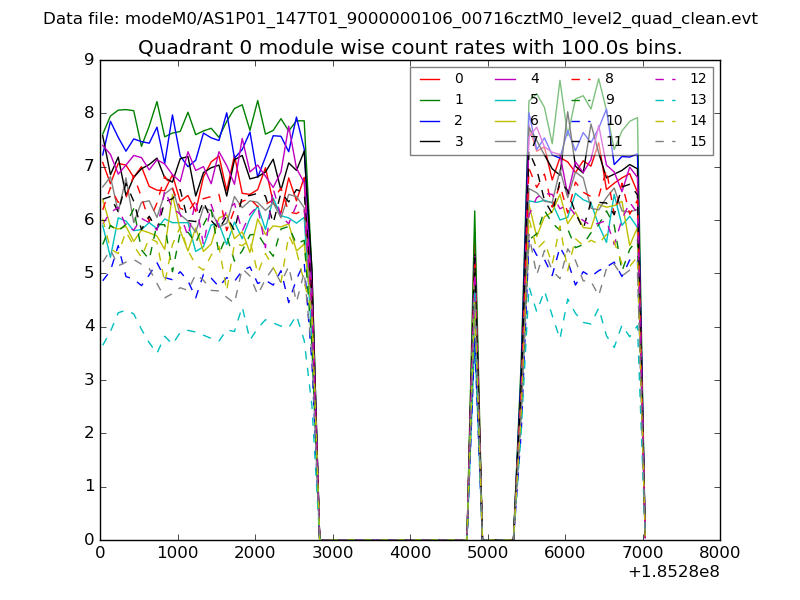 |
 |
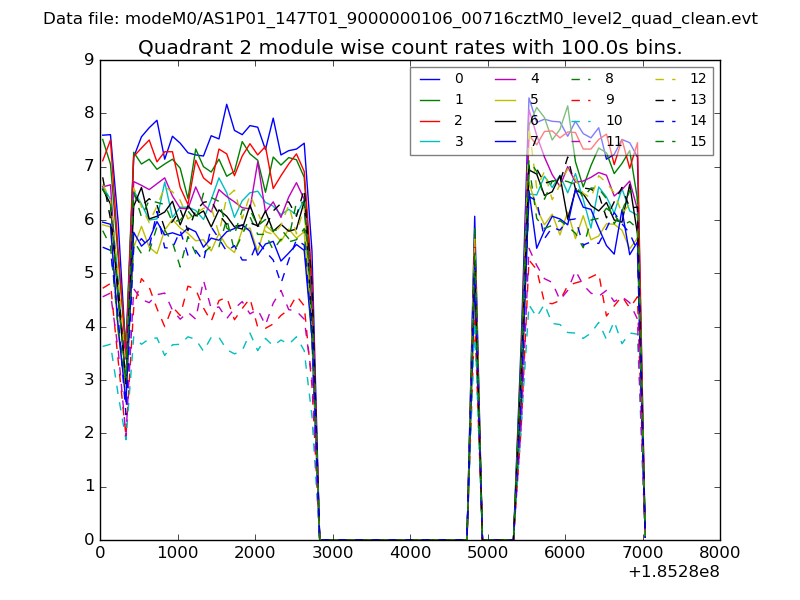
| Module-wise count rates for Quadrant B Data is divided into 100 sec bins |
 |
 |
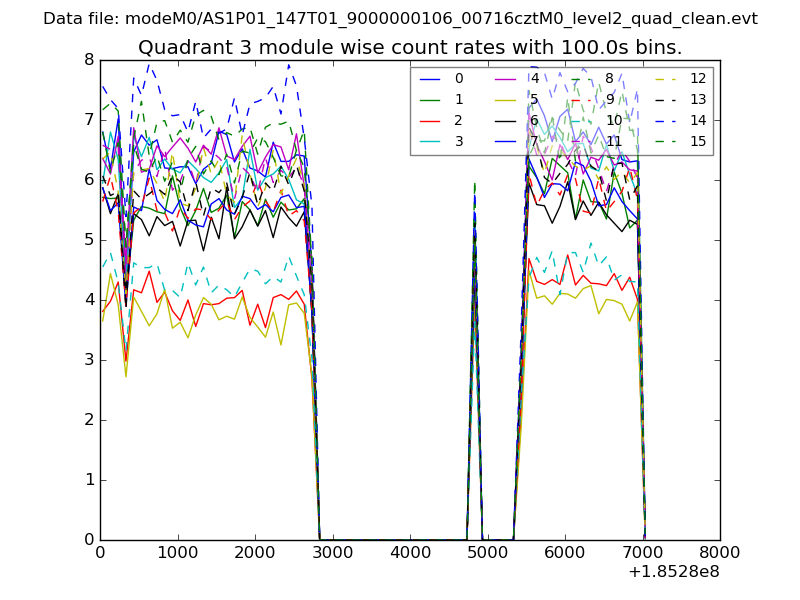
| Module-wise count rates for Quadrant C Data is divided into 100 sec bins |
 |
 |
| Module-wise count rates for Quadrant D Data is divided into 100 sec bins |
 |
 |
| Parameter | Plot |
|---|---|
| CZT HV Monitor | 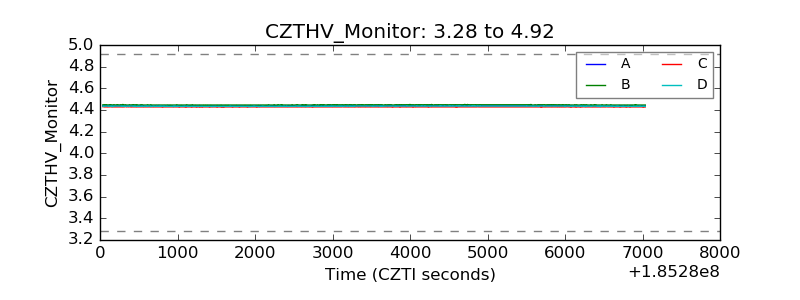 |
| D_VDD | 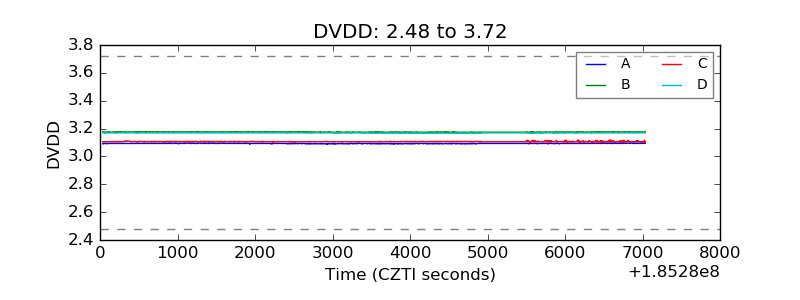 |
| Temperature 1 | 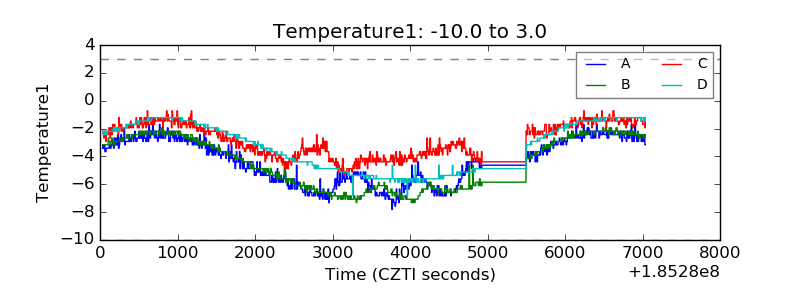 |
| Veto HV Monitor | 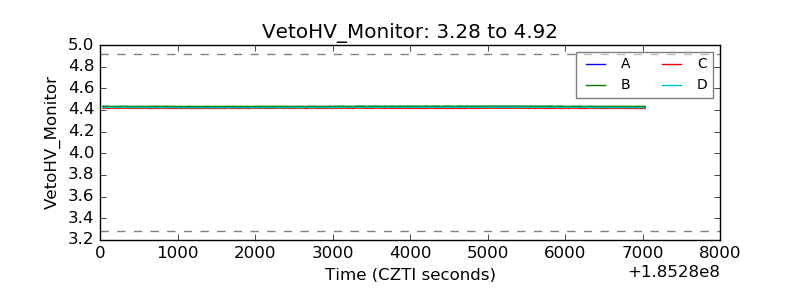 |
| Veto LLD | 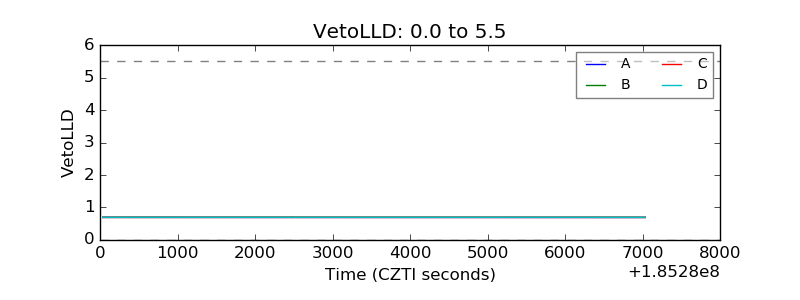 |
| Alpha Counter | 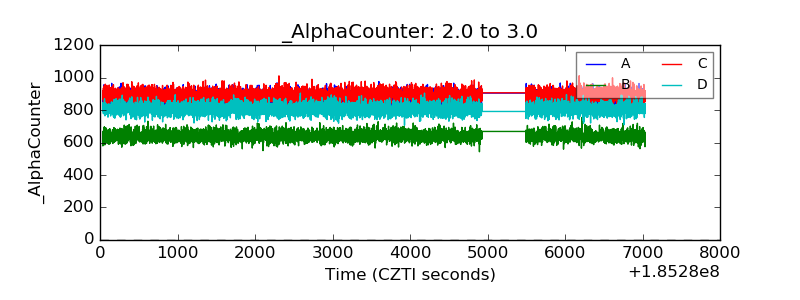 |
| _CPM_Rate | 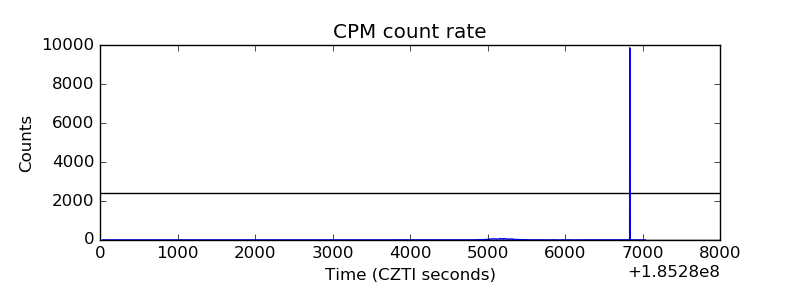 |
| CZT Counter | 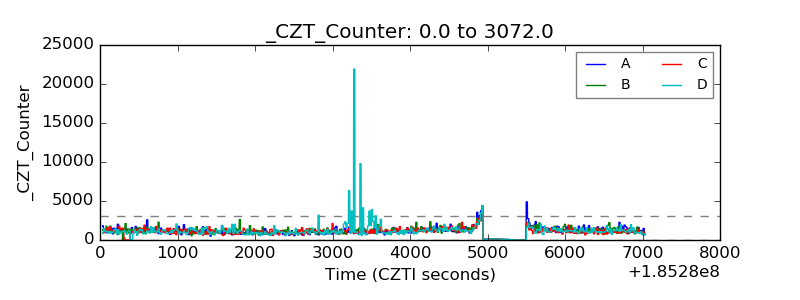 |
| +2.5 Volts monitor |  |
| +5 Volts monitor |  |
| _ROLL_ROT |  |
| _Roll_DEC | 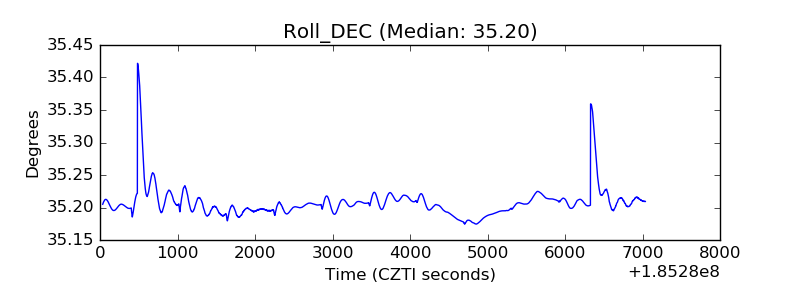 |
| _Roll_RA | 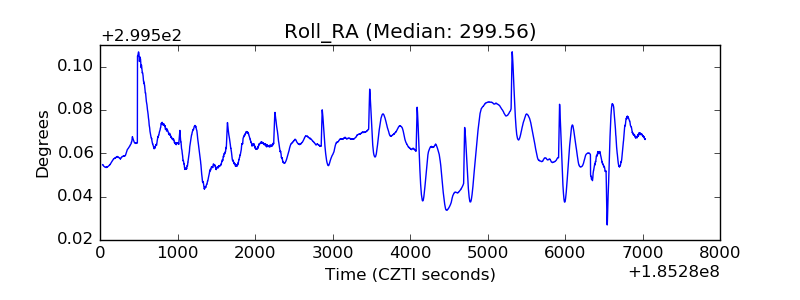 |
| Veto Counter | 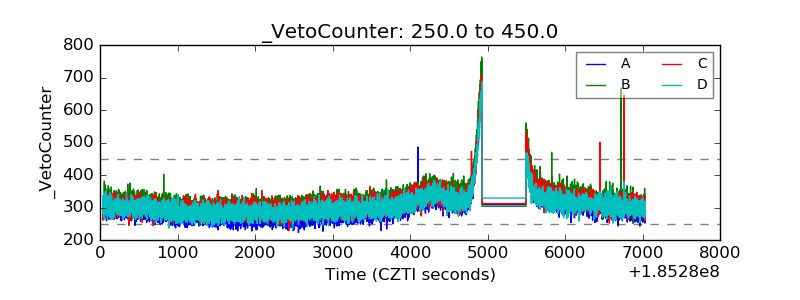 |