| Param | Original file | Final file |
|---|---|---|
| Filename | modeM0/AS1P01_147T01_9000000106_00717cztM0_level2.evt | modeM0/AS1P01_147T01_9000000106_00717cztM0_level2_quad_clean.evt |
| Size (bytes) | 980,694,720 | 65,862,720 |
| Size | 935.3 MB | 62.8 MB |
| Events in quadrant A | 7,112,905 | 401,248 |
| Events in quadrant B | 7,453,332 | 401,054 |
| Events in quadrant C | 7,040,900 | 391,459 |
| Events in quadrant D | 7,690,473 | 376,306 |
| Mode M9 | |||
|---|---|---|---|
| Quadrant | BADHDUFLAG | Total packets | Discarded packets |
| A | 0 | 8 | 0 |
| B | 0 | 8 | 0 |
| C | 0 | 8 | 0 |
| D | 0 | 8 | 0 |
| Mode SS | |||
|---|---|---|---|
| Quadrant | BADHDUFLAG | Total packets | Discarded packets |
| A | 0 | 122 | 0 |
| B | 0 | 122 | 0 |
| C | 0 | 122 | 0 |
| D | 0 | 122 | 0 |
| Mode M0 | |||
|---|---|---|---|
| Quadrant | BADHDUFLAG | Total packets | Discarded packets |
| A | 0 | 25445 | 1 |
| B | 0 | 26426 | 1 |
| C | 0 | 25244 | 5 |
| D | 0 | 27167 | 1 |
| Quadrant | Total seconds | Saturated seconds | Saturation percentage |
|---|---|---|---|
| A | 6078 | 15 | 0.246792% |
| B | 6078 | 15 | 0.246792% |
| C | 6077 | 14 | 0.230377% |
| D | 6077 | 85 | 1.398716% |
Noise dominated data is calculated using 1-second bins in cleaned event files. If a bin has >2000 counts, and if more than 50% of those come from <1% of pixels, then it is considered to be noise-dominated and hence unusable.
| Quadrant | # 1 sec bins | Bins with >0 counts | Bins with >2000 counts | High rate bins dominated by noise | Noise dominated (total time) | Noise dominated (detector-on time) | Marked lightcurve |
|---|---|---|---|---|---|---|---|
| A | 6808 | 6079 | 212 | 212 | 3.11% | 3.49% | 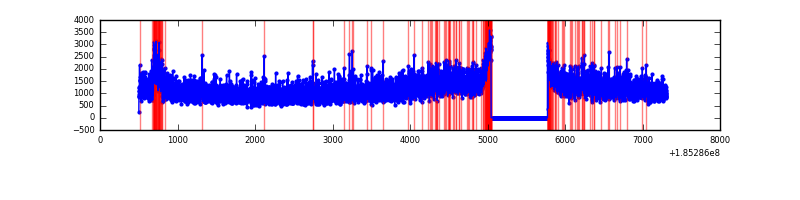 |
| B | 6808 | 6079 | 217 | 217 | 3.19% | 3.57% | 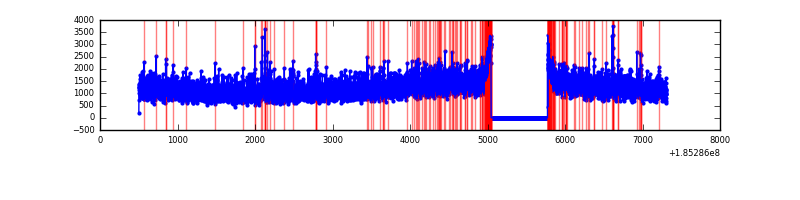 |
| C | 6807 | 6078 | 129 | 129 | 1.90% | 2.12% | 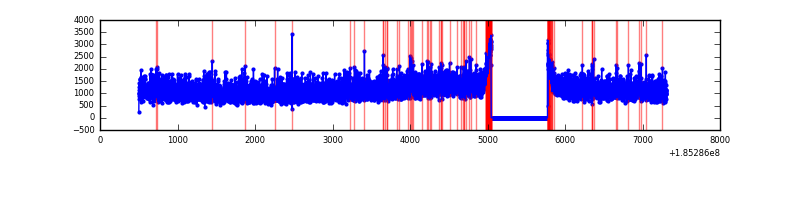 |
| D | 6807 | 6078 | 481 | 481 | 7.07% | 7.91% | 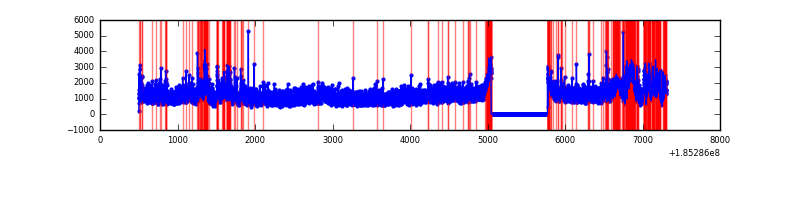 |
Top three noisy pixels from each quadrant. If the there are fewer than three noisy pixels in the level2.evt file, extra rows are filled as -1
| Pixel properties | Quadrant properties | ||||||
|---|---|---|---|---|---|---|---|
| Quadrant | DetID | PixID | Counts | Sigma | Mean | Median | Sigma |
| A | 15 | 171 | 85589 | 190.78 | 1830 | 1841 | 439.0 |
| A | 12 | 189 | 7671 | 13.28 | 1830 | 1841 | 439.0 |
| A | 11 | 79 | 6865 | 11.44 | 1830 | 1841 | 439.0 |
| B | 0 | 220 | 41011 | 87.1 | 1905 | 1915 | 448.8 |
| B | 5 | 249 | 39289 | 83.27 | 1905 | 1915 | 448.8 |
| B | 0 | 207 | 35443 | 74.7 | 1905 | 1915 | 448.8 |
| C | 15 | 241 | 124297 | 250.5 | 1750 | 1818 | 488.9 |
| C | 3 | 111 | 37158 | 72.28 | 1750 | 1818 | 488.9 |
| C | 3 | 79 | 27396 | 52.31 | 1750 | 1818 | 488.9 |
| D | 9 | 52 | 592806 | 1114.89 | 1709 | 1774 | 530.1 |
| D | 12 | 33 | 296384 | 555.74 | 1709 | 1774 | 530.1 |
| D | 6 | 226 | 175451 | 327.61 | 1709 | 1774 | 530.1 |
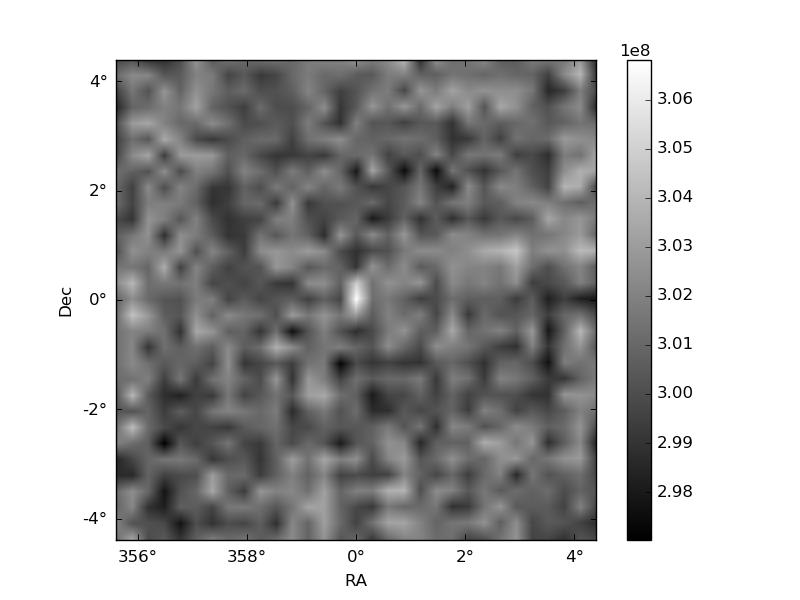
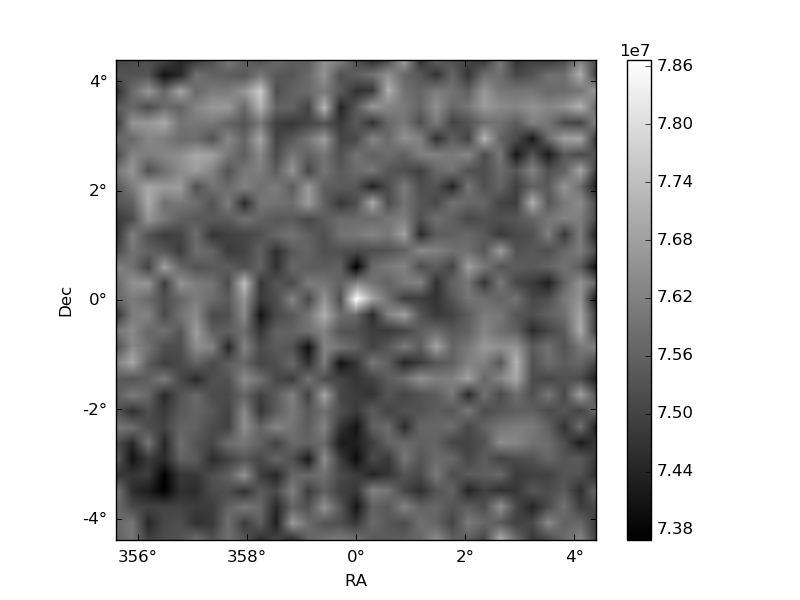
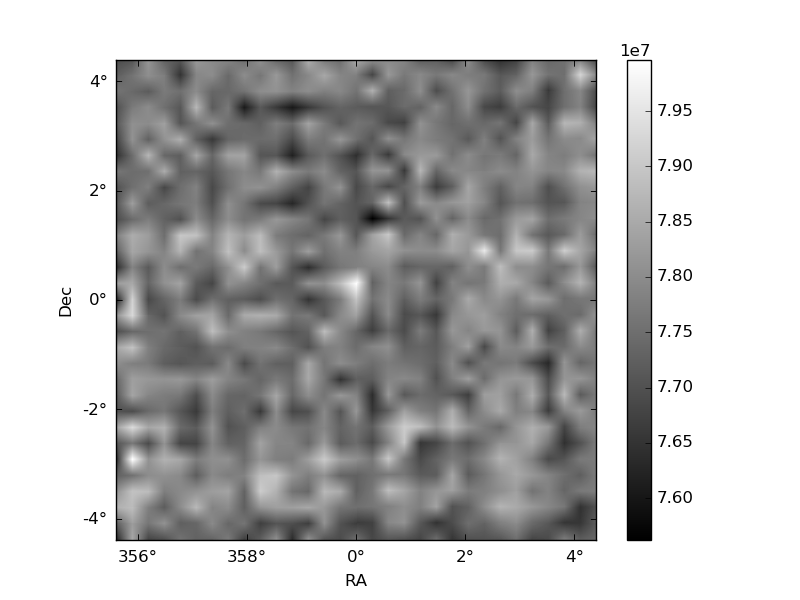
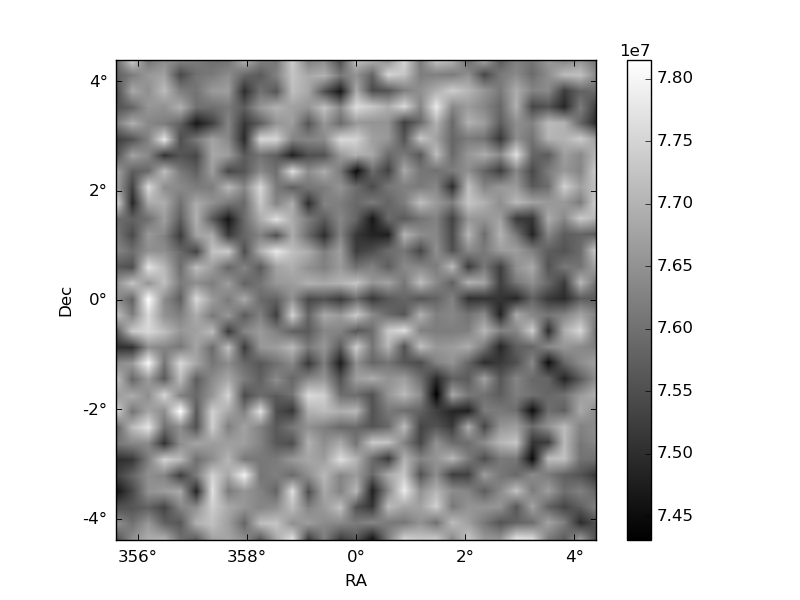
Histogram calculated using DETX and DETY for each event in the final _common_clean file
| Quadrant A | 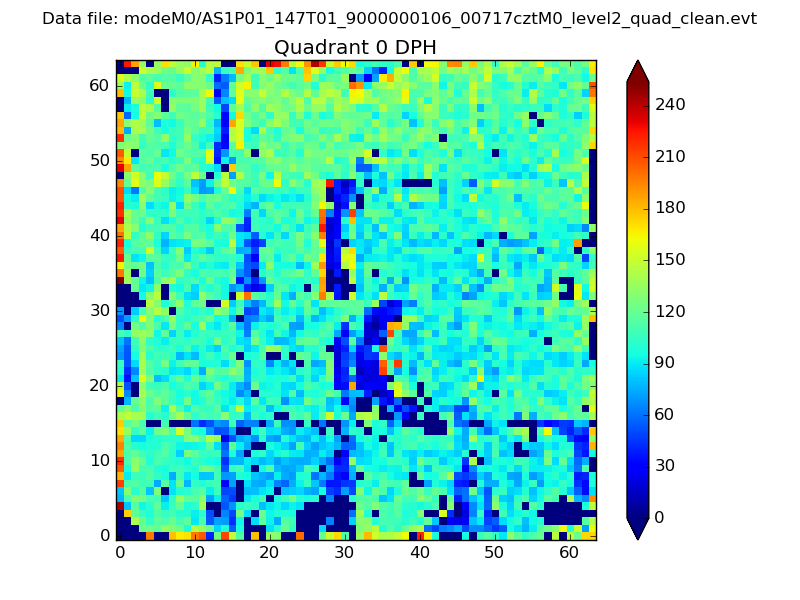 |
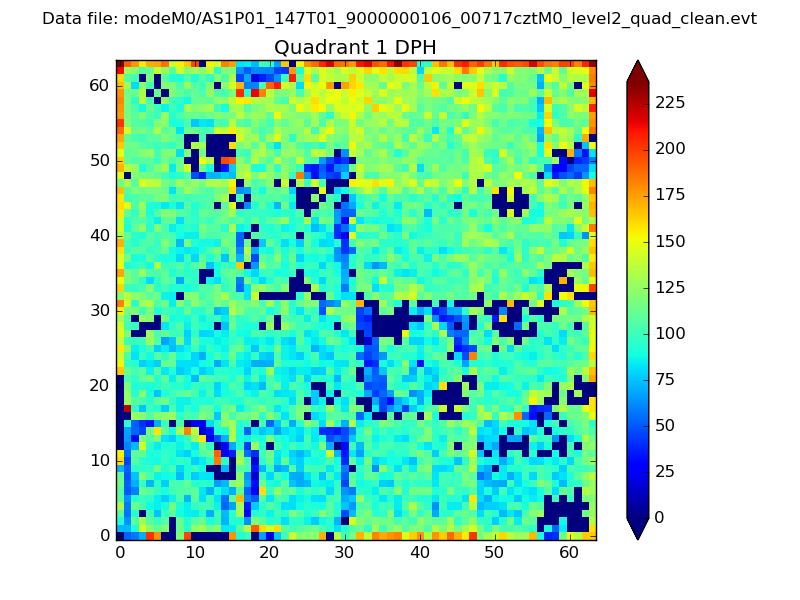 |
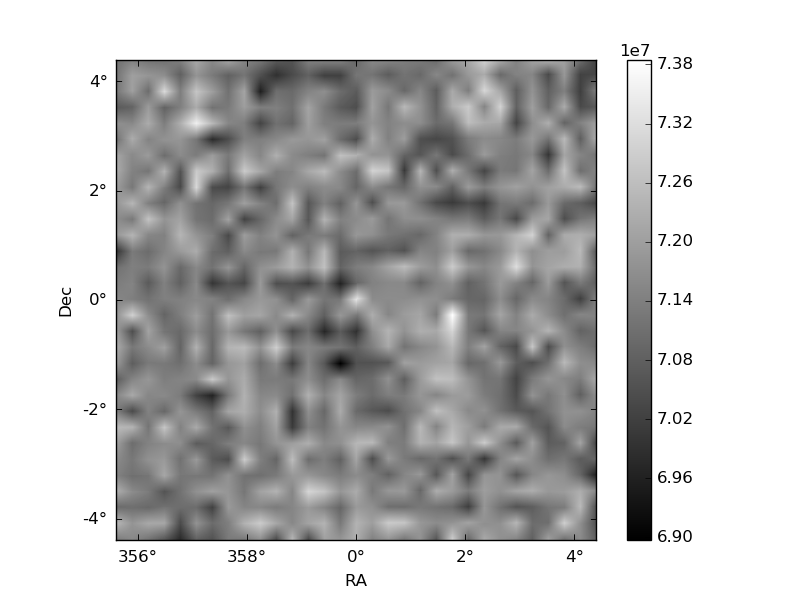
Quadrant B |
|---|---|---|---|
| Quadrant D | 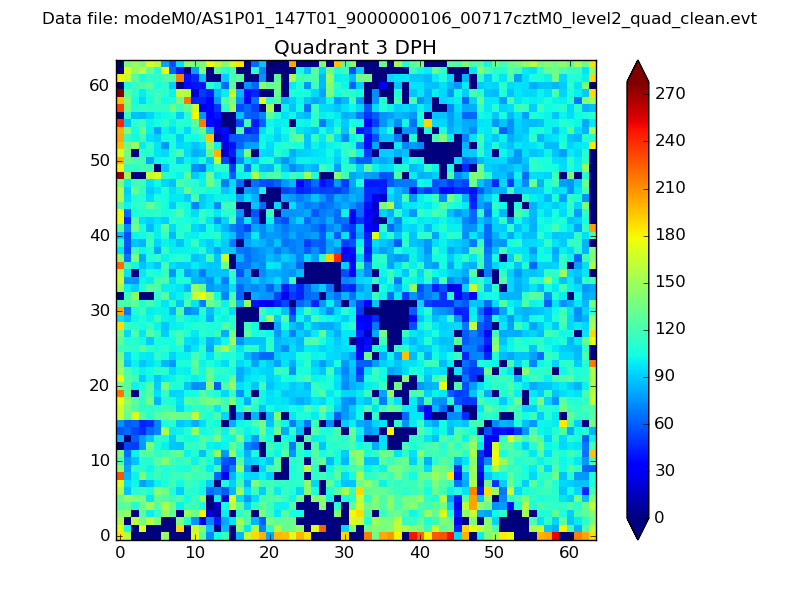 |
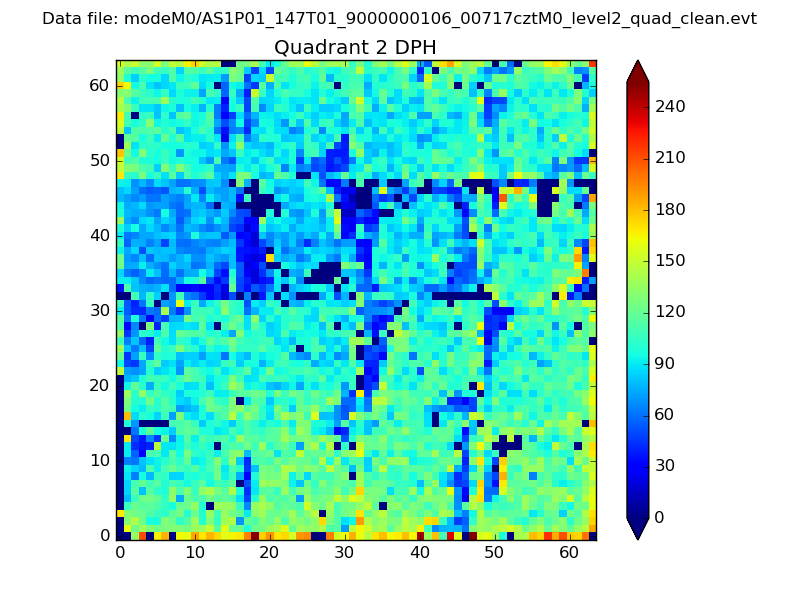 |
Quadrant C |
| Plot type | Count rate plots | Images |
|---|---|---|
| Comparison with Poisson distribution Blue bars denote a histogram of data divided into 1 sec bins. Red curve is a Poisson curve with rate = median count rate of data. |
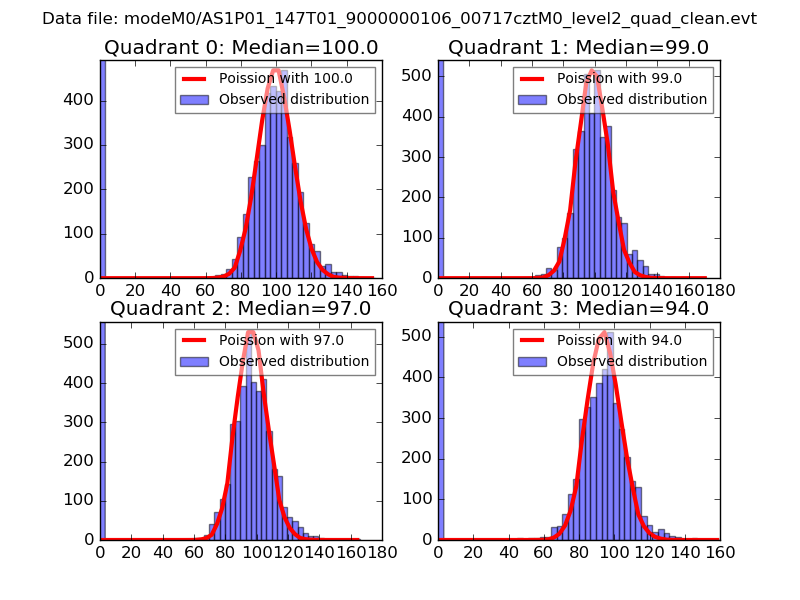 |
 |
| Quadrant-wise count rates Data is divided into 100 sec bins |
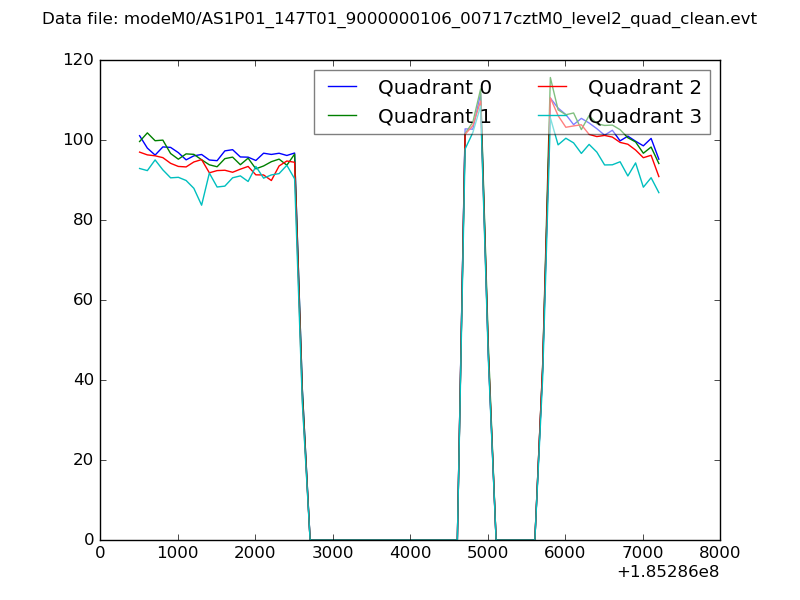 |
|
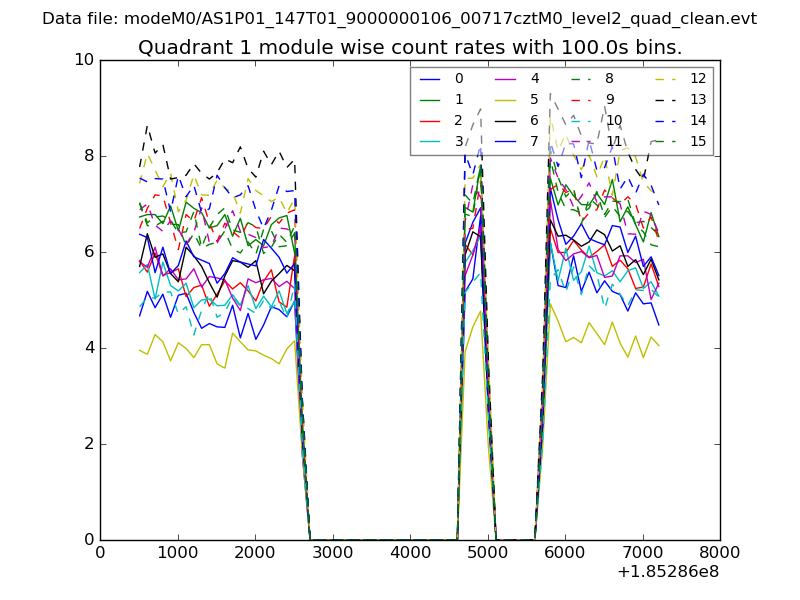
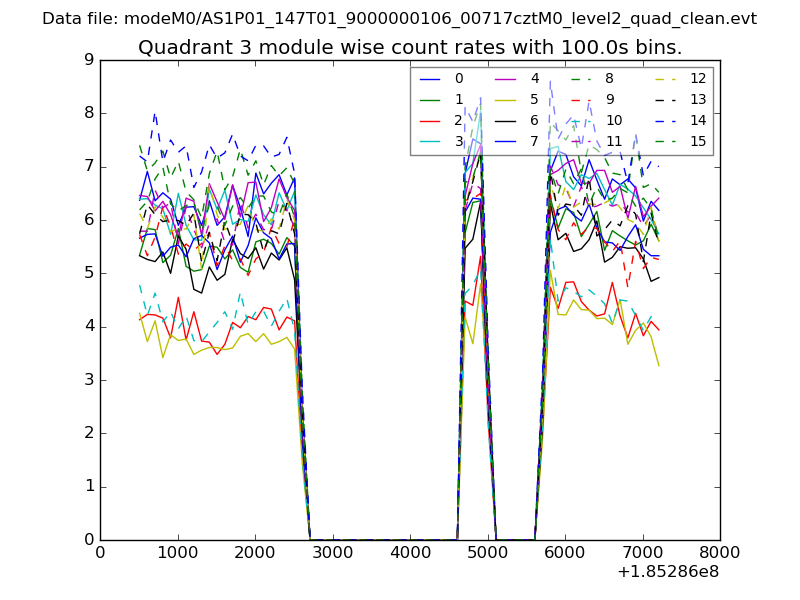
| Module-wise count rates for Quadrant A Data is divided into 100 sec bins |
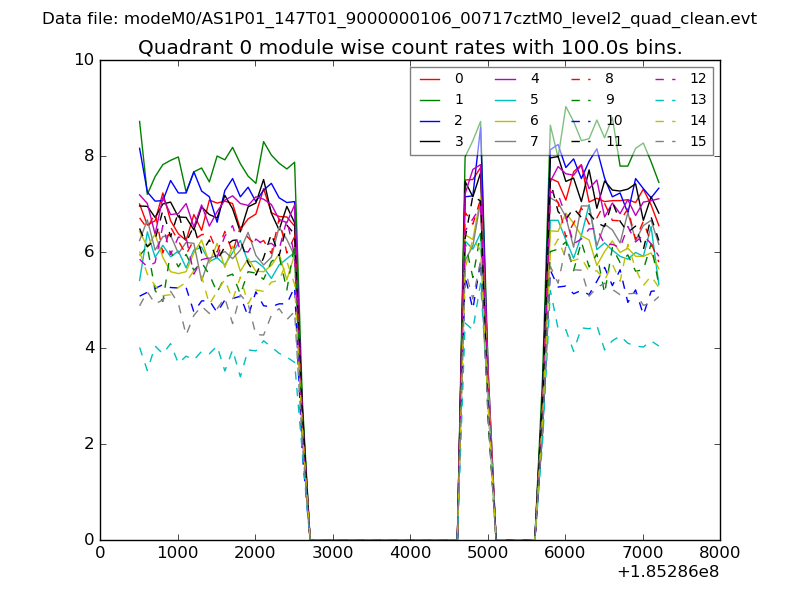 |
 |
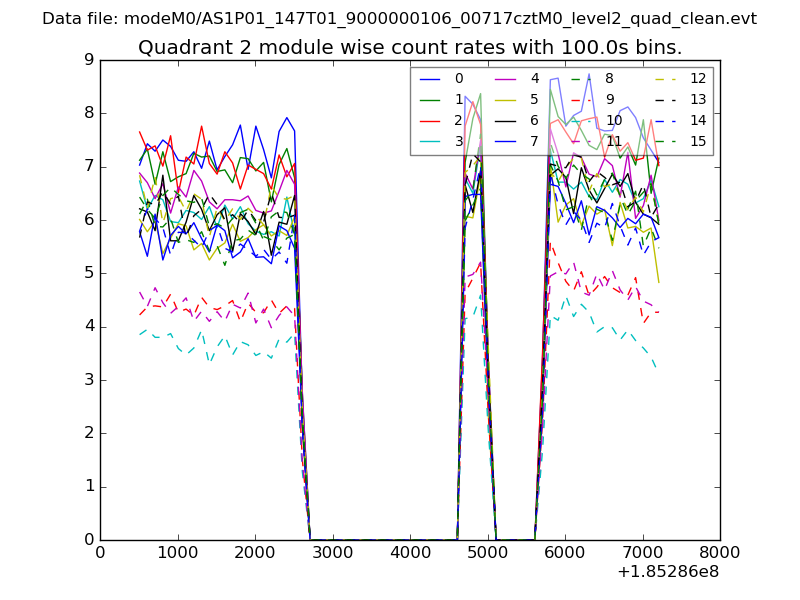
| Module-wise count rates for Quadrant B Data is divided into 100 sec bins |
 |
 |
| Module-wise count rates for Quadrant C Data is divided into 100 sec bins |
 |
 |
| Module-wise count rates for Quadrant D Data is divided into 100 sec bins |
 |
 |
| Parameter | Plot |
|---|---|
| CZT HV Monitor | 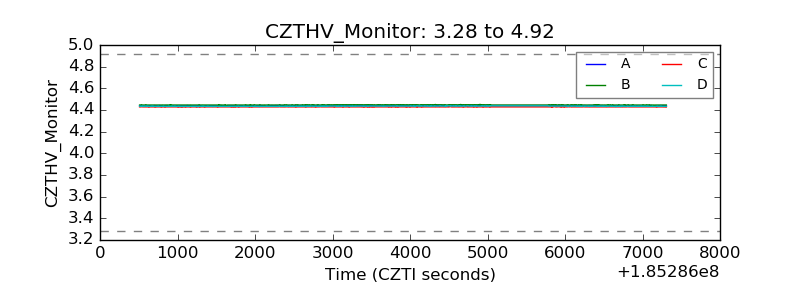 |
| D_VDD | 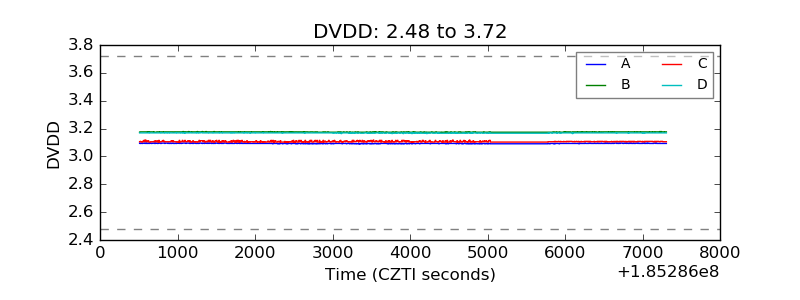 |
| Temperature 1 | 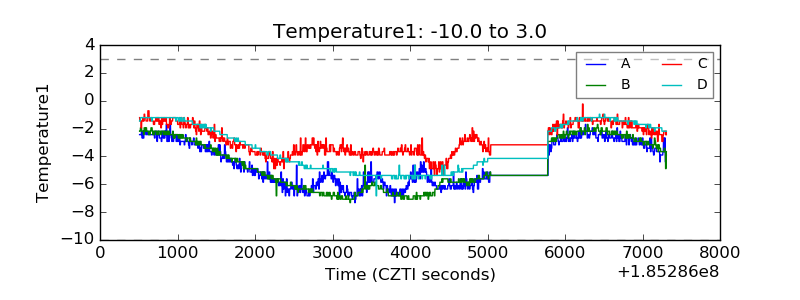 |
| Veto HV Monitor | 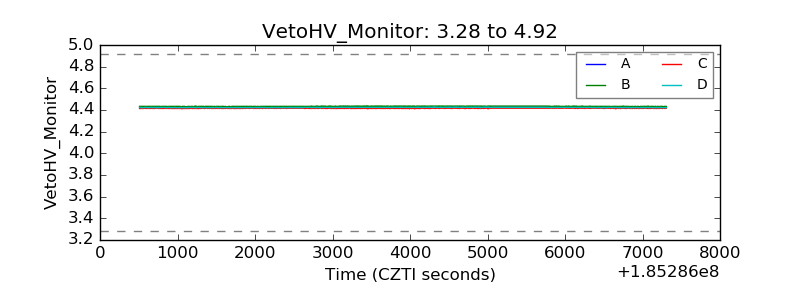 |
| Veto LLD | 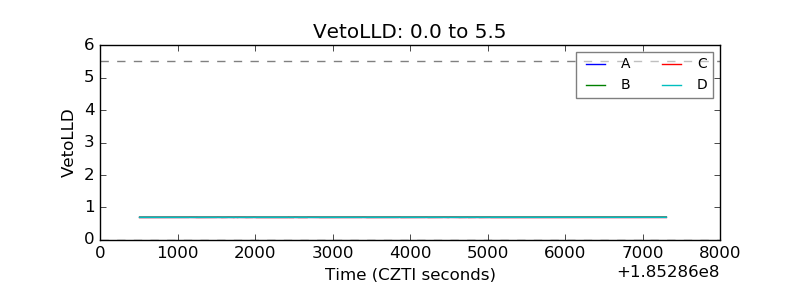 |
| Alpha Counter | 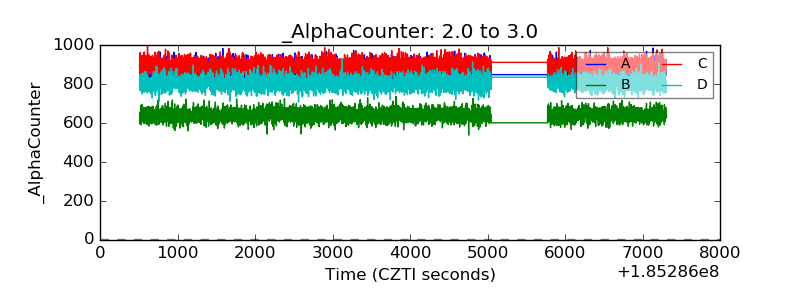 |
| _CPM_Rate | 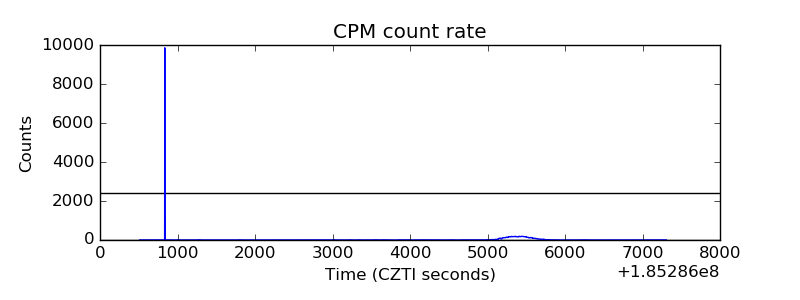 |
| CZT Counter | 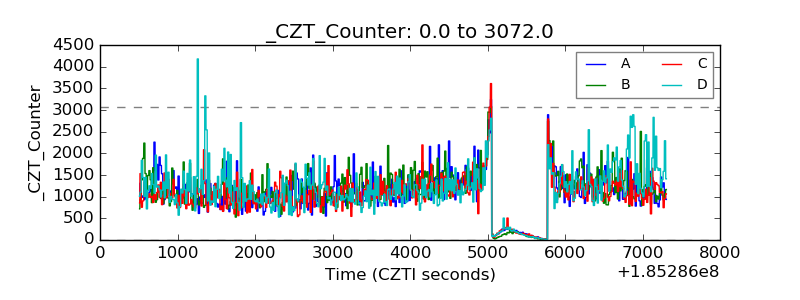 |
| +2.5 Volts monitor |  |
| +5 Volts monitor |  |
| _ROLL_ROT | 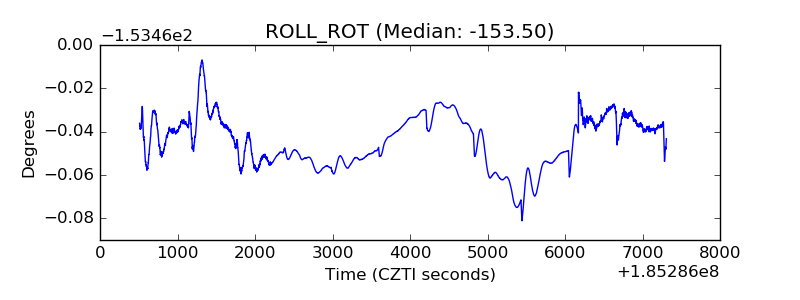 |
| _Roll_DEC | 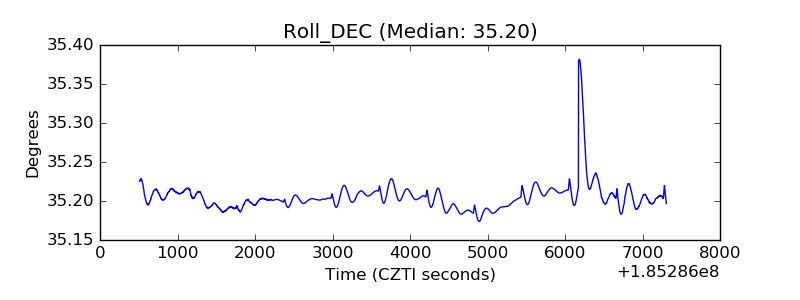 |
| _Roll_RA | 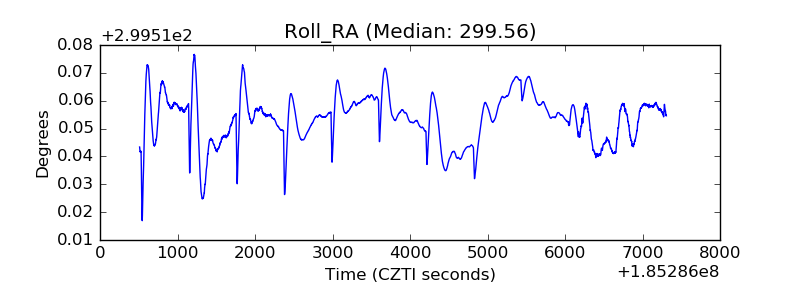 |
| Veto Counter | 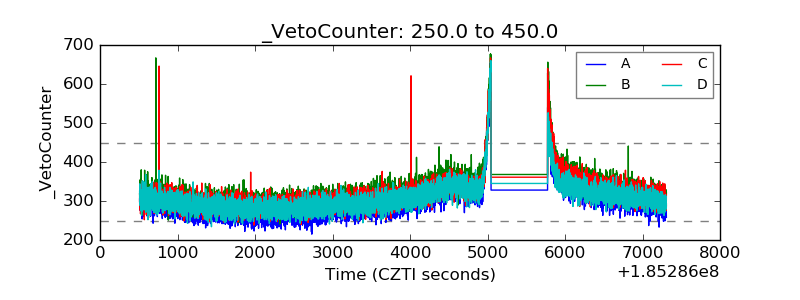 |