| Param | Original file | Final file |
|---|---|---|
| Filename | modeM0/AS1P01_147T01_9000000106_00718cztM0_level2.evt | modeM0/AS1P01_147T01_9000000106_00718cztM0_level2_quad_clean.evt |
| Size (bytes) | 205,355,520 | 12,692,160 |
| Size | 195.8 MB | 12.1 MB |
| Events in quadrant A | 1,485,149 | 72,925 |
| Events in quadrant B | 1,550,047 | 71,226 |
| Events in quadrant C | 1,478,279 | 69,526 |
| Events in quadrant D | 1,611,221 | 67,230 |
| Mode M9 | |||
|---|---|---|---|
| Quadrant | BADHDUFLAG | Total packets | Discarded packets |
| A | 0 | 1 | 1 |
| B | 0 | 1 | 1 |
| C | 1 | 1 | 1 |
| D | 1 | -1 | -1 |
| Mode SS | |||
|---|---|---|---|
| Quadrant | BADHDUFLAG | Total packets | Discarded packets |
| A | 0 | 38 | 8 |
| B | 0 | 41 | 11 |
| C | 0 | 38 | 10 |
| D | 0 | 38 | 12 |
| Mode M0 | |||
|---|---|---|---|
| Quadrant | BADHDUFLAG | Total packets | Discarded packets |
| A | 0 | 7616 | 2231 |
| B | 0 | 7868 | 2289 |
| C | 0 | 7577 | 2202 |
| D | 0 | 8008 | 2242 |
| Quadrant | Total seconds | Saturated seconds | Saturation percentage |
|---|---|---|---|
| A | 1373 | 0 | 0.000000% |
| B | 1376 | 0 | 0.000000% |
| C | 1364 | 0 | 0.000000% |
| D | 1377 | 19 | 1.379811% |
Noise dominated data is calculated using 1-second bins in cleaned event files. If a bin has >2000 counts, and if more than 50% of those come from <1% of pixels, then it is considered to be noise-dominated and hence unusable.
| Quadrant | # 1 sec bins | Bins with >0 counts | Bins with >2000 counts | High rate bins dominated by noise | Noise dominated (total time) | Noise dominated (detector-on time) | Marked lightcurve |
|---|---|---|---|---|---|---|---|
| A | 6376 | 1431 | 13 | 13 | 0.20% | 0.91% | 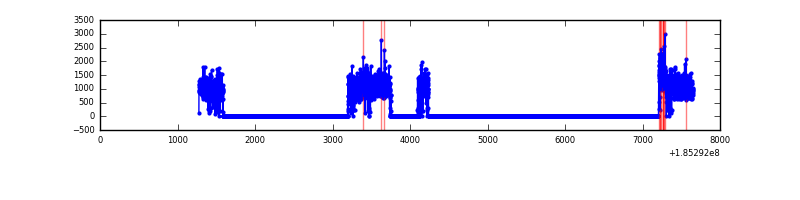 |
| B | 6375 | 1441 | 14 | 14 | 0.22% | 0.97% | 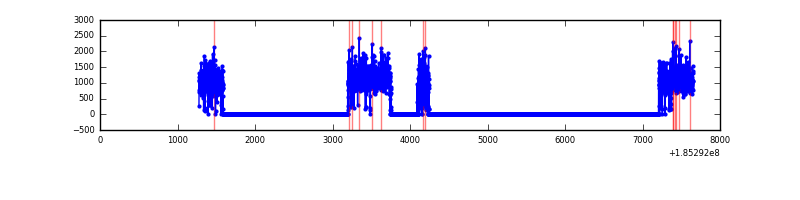 |
| C | 6377 | 1433 | 8 | 8 | 0.13% | 0.56% | 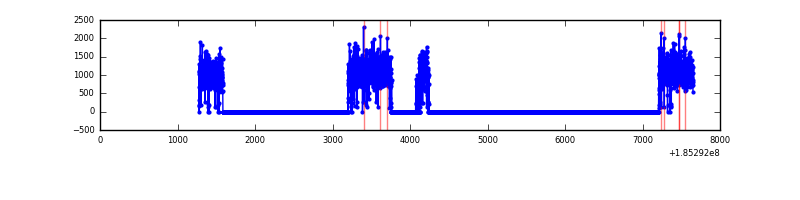 |
| D | 6372 | 1439 | 81 | 81 | 1.27% | 5.63% |  |
Top three noisy pixels from each quadrant. If the there are fewer than three noisy pixels in the level2.evt file, extra rows are filled as -1
| Pixel properties | Quadrant properties | ||||||
|---|---|---|---|---|---|---|---|
| Quadrant | DetID | PixID | Counts | Sigma | Mean | Median | Sigma |
| A | 15 | 17 | 44828 | 488.88 | 373 | 376 | 90.9 |
| A | 15 | 171 | 3510 | 34.47 | 373 | 376 | 90.9 |
| A | 13 | 164 | 2215 | 20.23 | 373 | 376 | 90.9 |
| B | 0 | 220 | 10841 | 110.85 | 400 | 402 | 94.2 |
| B | 0 | 23 | 8026 | 80.96 | 400 | 402 | 94.2 |
| B | 14 | 50 | 4974 | 48.55 | 400 | 402 | 94.2 |
| C | 15 | 241 | 26803 | 254.4 | 367 | 382 | 103.9 |
| C | 3 | 111 | 6673 | 60.57 | 367 | 382 | 103.9 |
| C | 3 | 79 | 4826 | 42.79 | 367 | 382 | 103.9 |
| D | 9 | 52 | 134771 | 1237.68 | 351 | 361 | 108.6 |
| D | 6 | 226 | 93945 | 861.74 | 351 | 361 | 108.6 |
| D | 1 | 4 | 51666 | 472.43 | 351 | 361 | 108.6 |
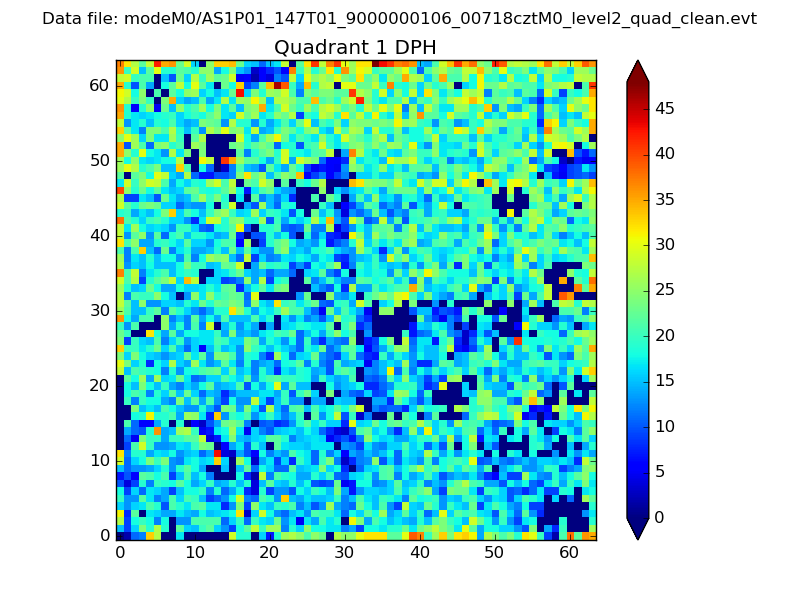
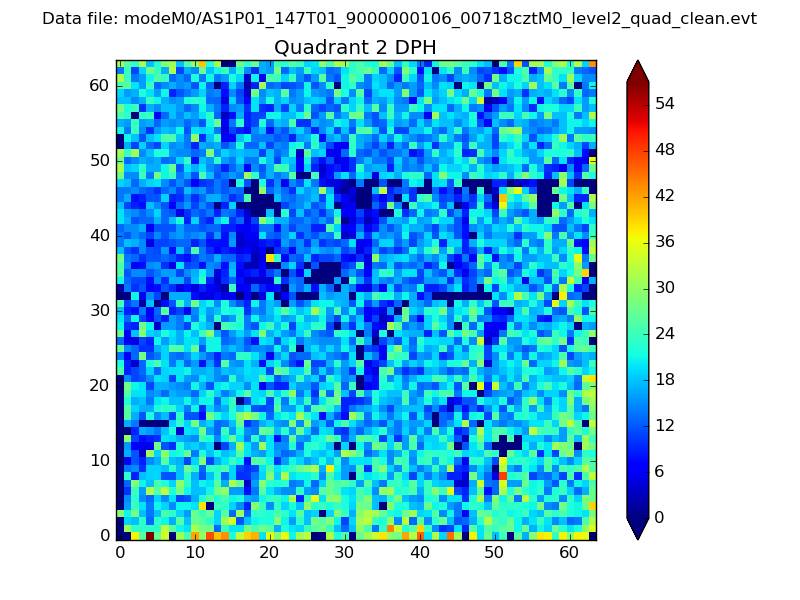
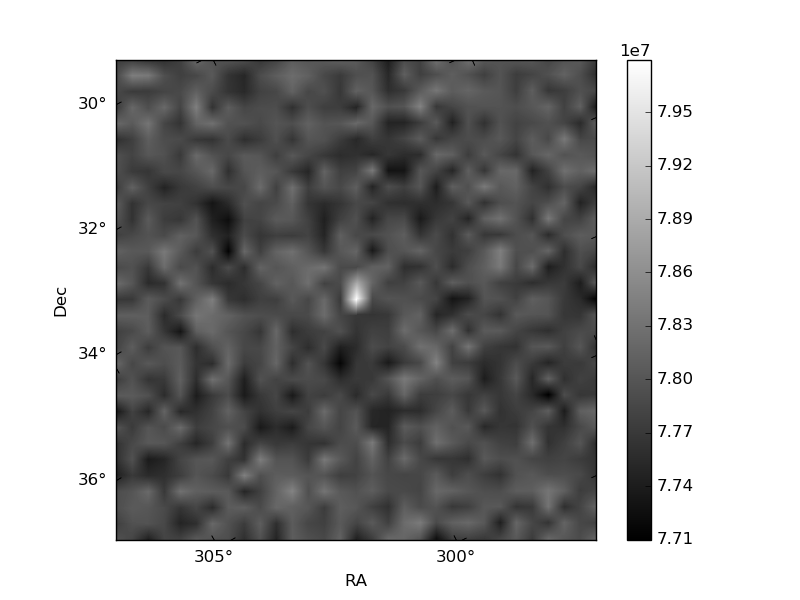
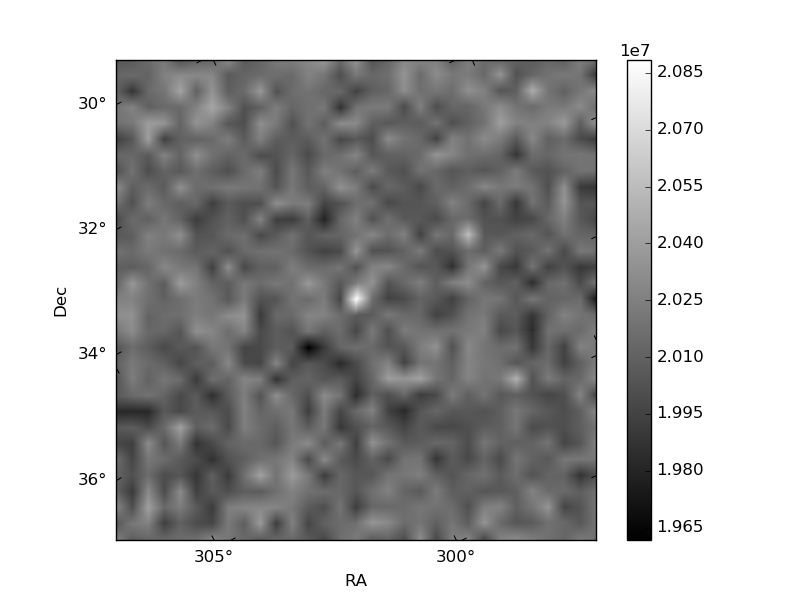
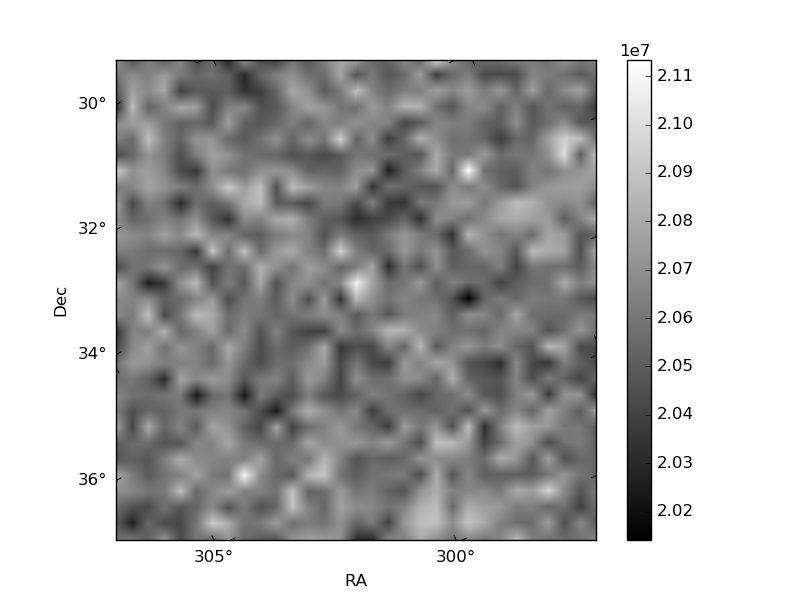
Histogram calculated using DETX and DETY for each event in the final _common_clean file
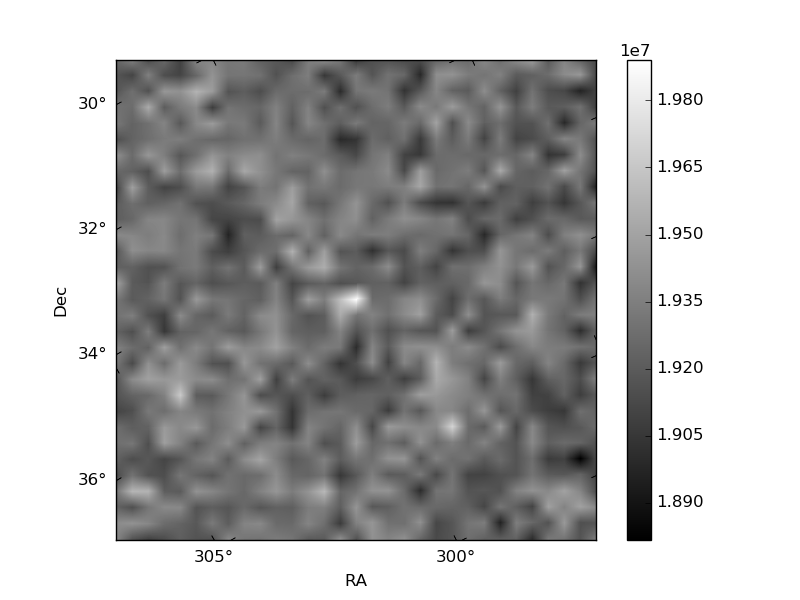
| Quadrant A | 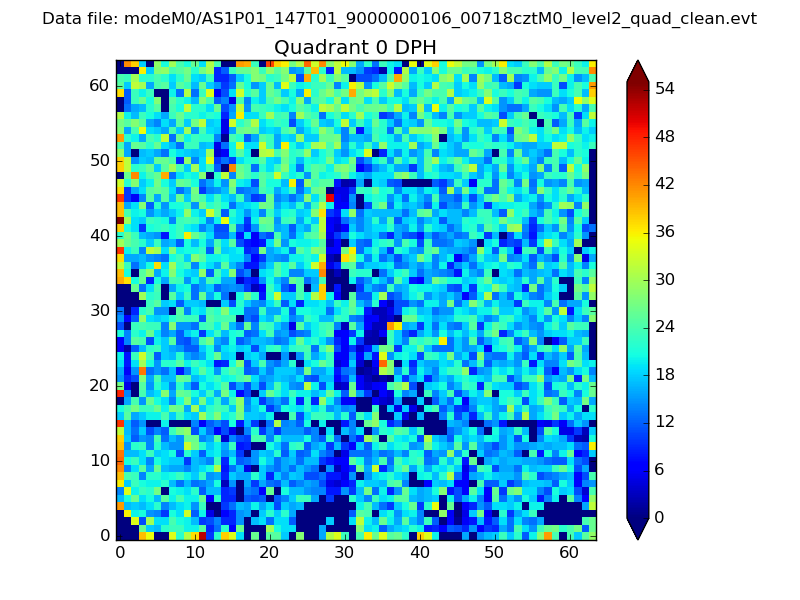 |
 |
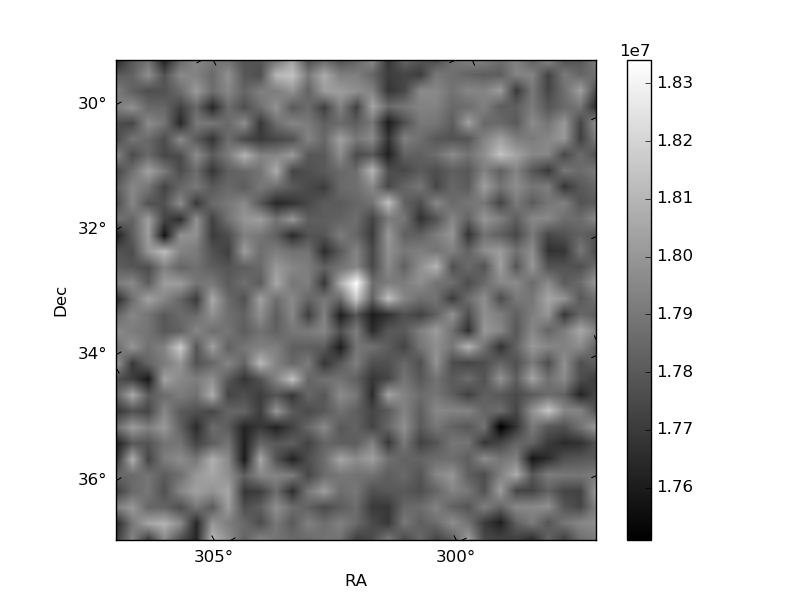
Quadrant B |
|---|---|---|---|
| Quadrant D | 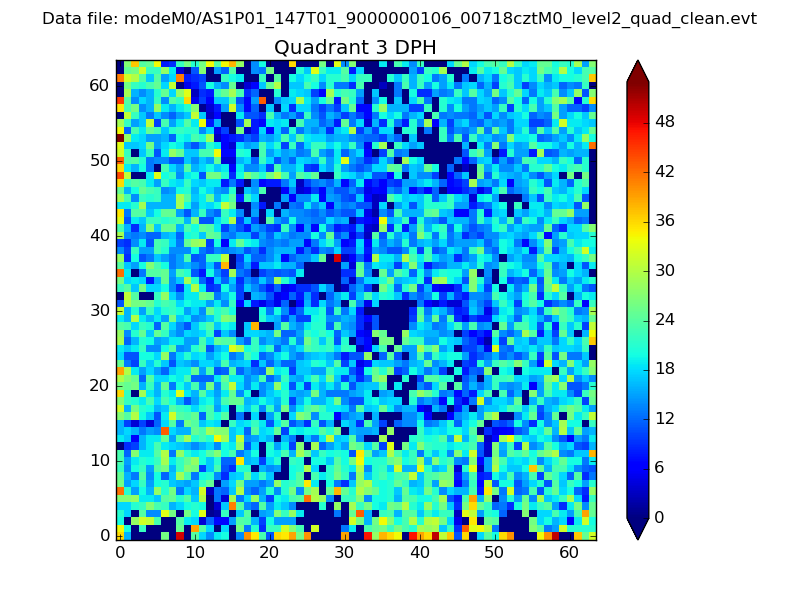 |
 |
Quadrant C |
| Plot type | Count rate plots | Images |
|---|---|---|
| Comparison with Poisson distribution Blue bars denote a histogram of data divided into 1 sec bins. Red curve is a Poisson curve with rate = median count rate of data. |
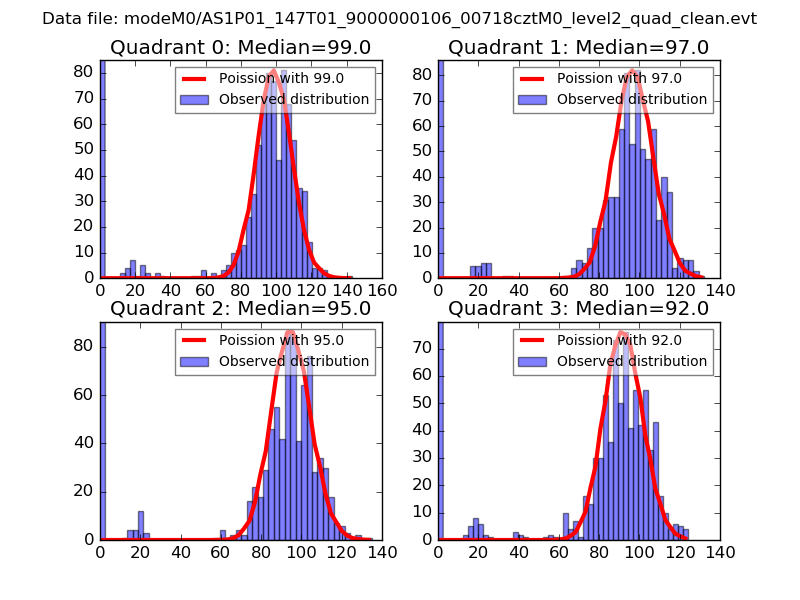 |
 |
| Quadrant-wise count rates Data is divided into 100 sec bins |
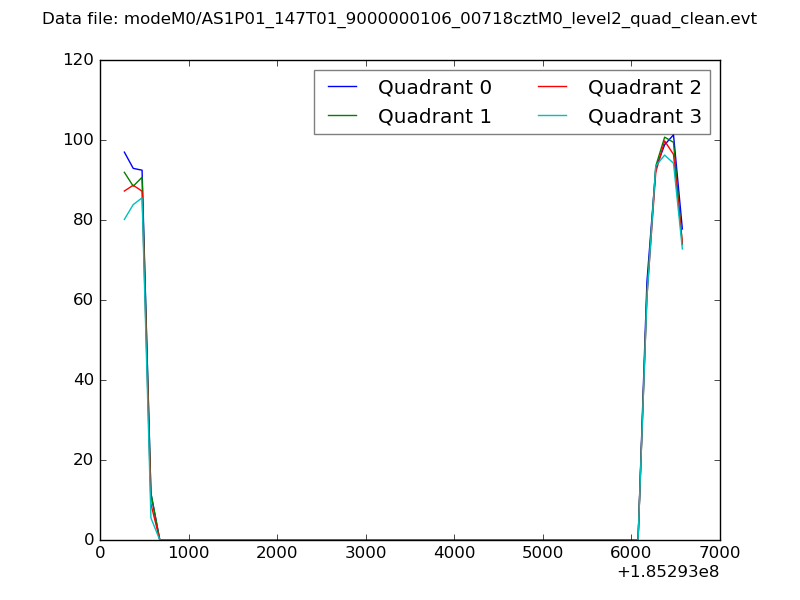 |
|
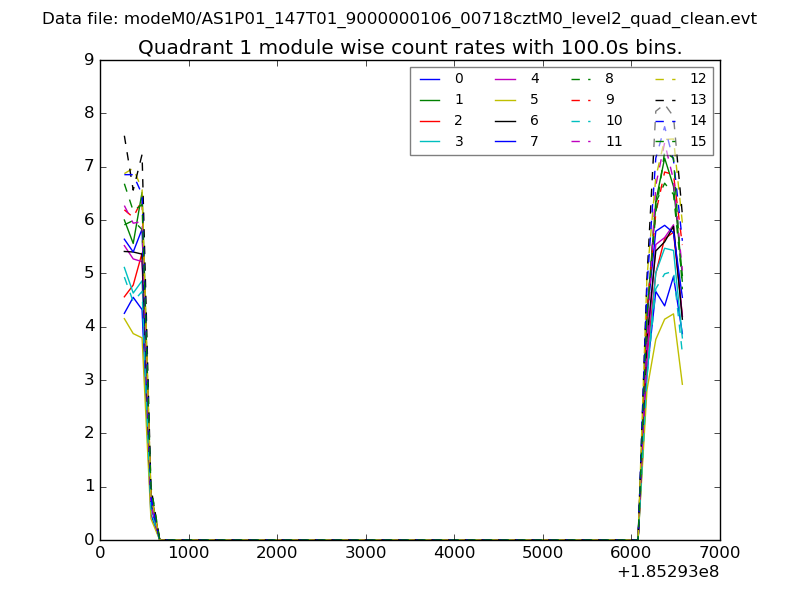
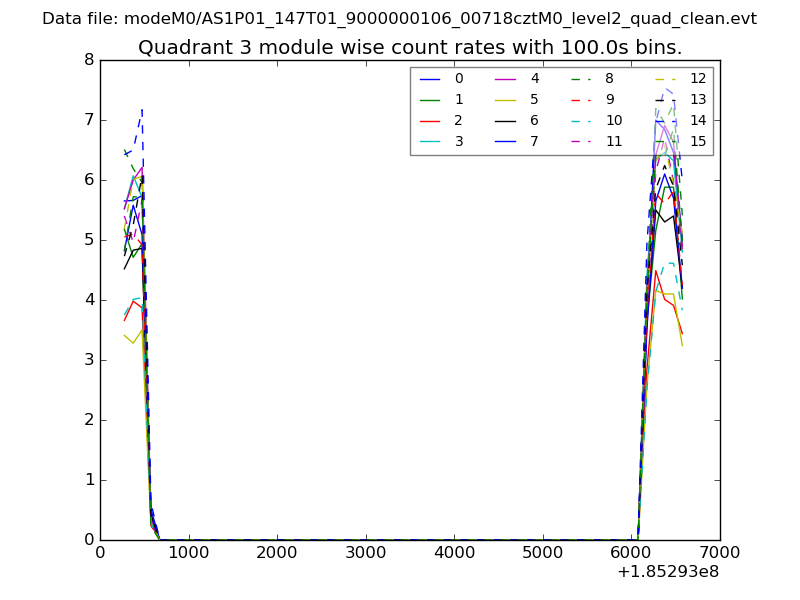
| Module-wise count rates for Quadrant A Data is divided into 100 sec bins |
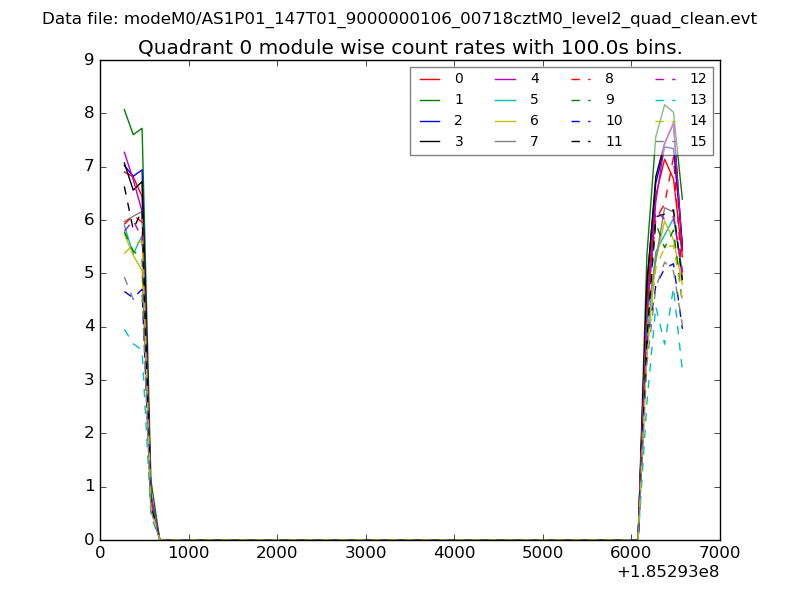 |
 |
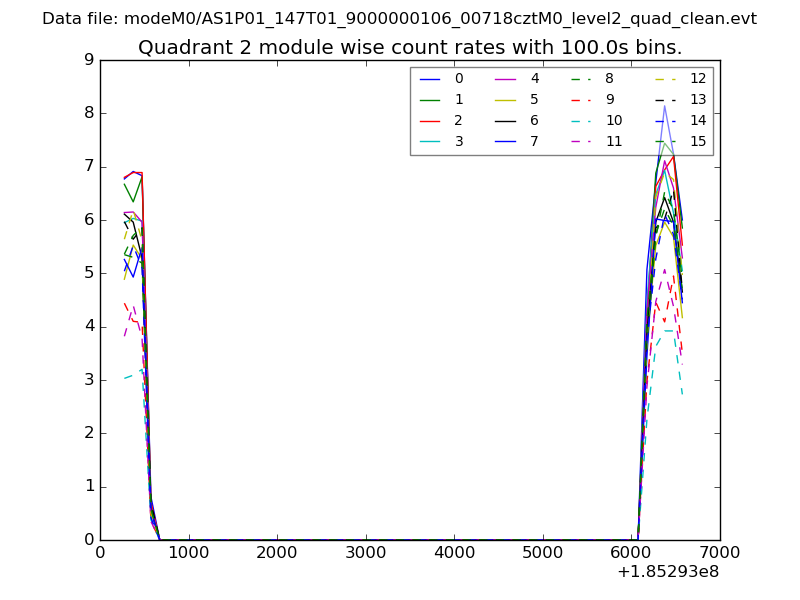
| Module-wise count rates for Quadrant B Data is divided into 100 sec bins |
 |
 |
| Module-wise count rates for Quadrant C Data is divided into 100 sec bins |
 |
 |
| Module-wise count rates for Quadrant D Data is divided into 100 sec bins |
 |
 |
| Parameter | Plot |
|---|---|
| CZT HV Monitor | 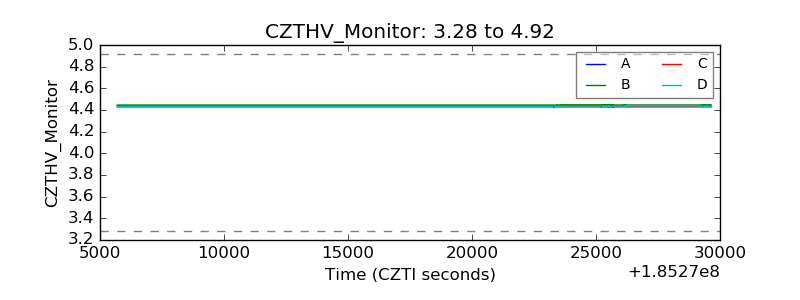 |
| D_VDD | 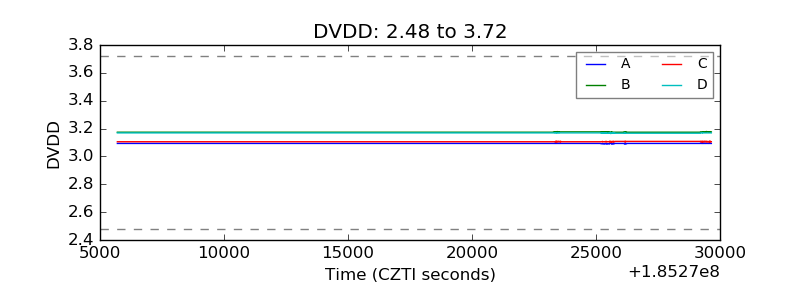 |
| Temperature 1 | 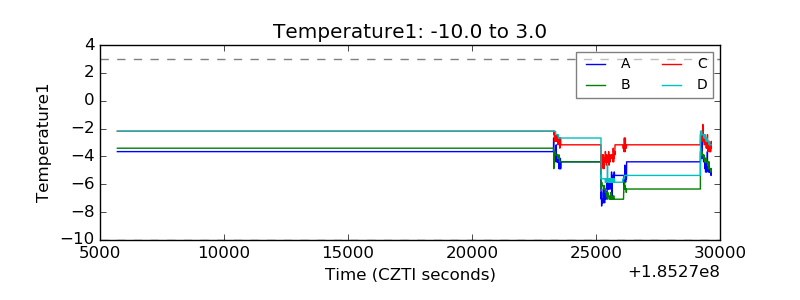 |
| Veto HV Monitor |  |
| Veto LLD | 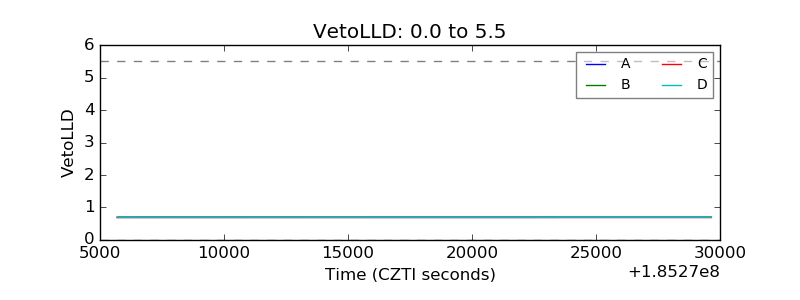 |
| Alpha Counter | 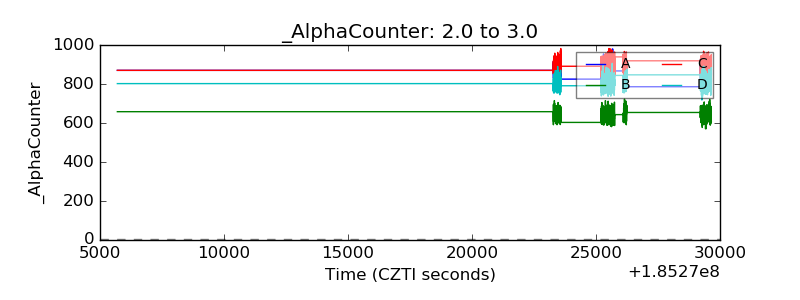 |
| _CPM_Rate | 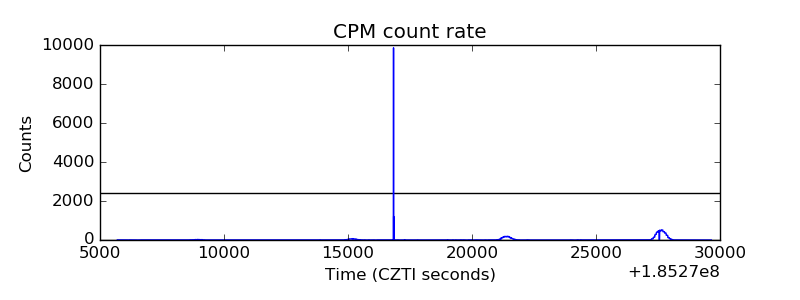 |
| CZT Counter | 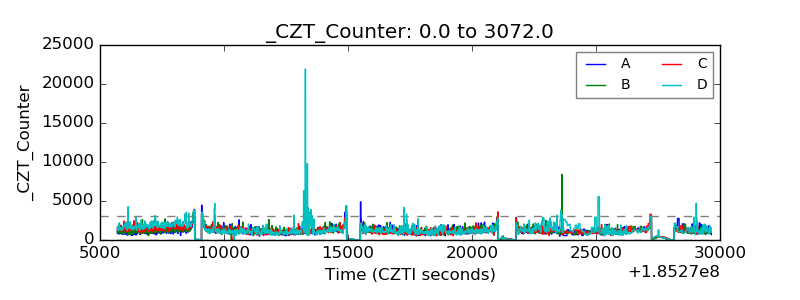 |
| +2.5 Volts monitor |  |
| +5 Volts monitor |  |
| _ROLL_ROT | 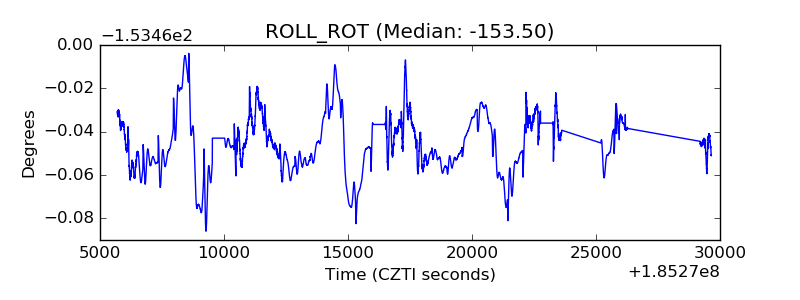 |
| _Roll_DEC | 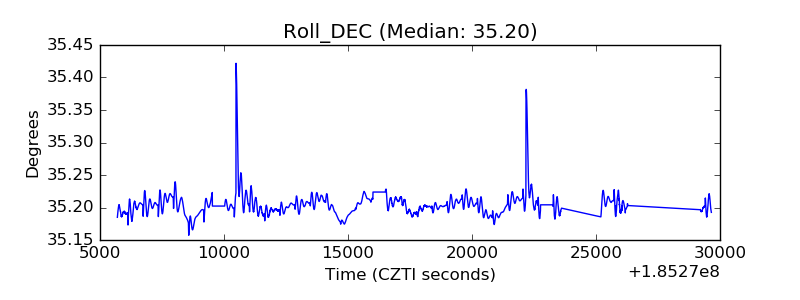 |
| _Roll_RA | 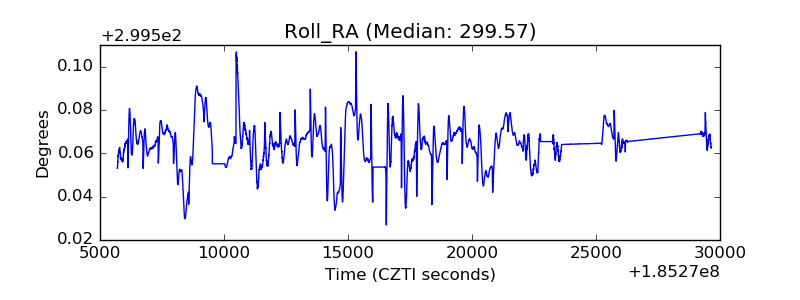 |
| Veto Counter | 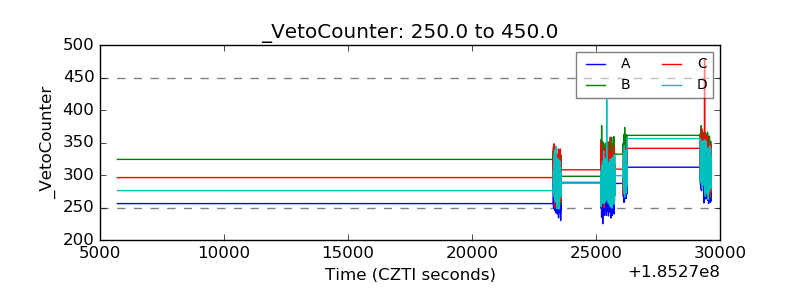 |