| Param | Original file | Final file |
|---|---|---|
| Filename | modeM0/AS1P01_147T01_9000000106_00721cztM0_level2.evt | modeM0/AS1P01_147T01_9000000106_00721cztM0_level2_quad_clean.evt |
| Size (bytes) | 900,434,880 | 66,435,840 |
| Size | 858.7 MB | 63.4 MB |
| Events in quadrant A | 6,578,654 | 408,900 |
| Events in quadrant B | 6,950,940 | 414,584 |
| Events in quadrant C | 6,523,819 | 402,436 |
| Events in quadrant D | 6,834,598 | 384,035 |
| Mode M9 | |||
|---|---|---|---|
| Quadrant | BADHDUFLAG | Total packets | Discarded packets |
| A | 0 | 11 | 0 |
| B | 0 | 11 | 0 |
| C | 0 | 11 | 0 |
| D | 0 | 11 | 0 |
| Mode SS | |||
|---|---|---|---|
| Quadrant | BADHDUFLAG | Total packets | Discarded packets |
| A | 0 | 118 | 0 |
| B | 0 | 118 | 0 |
| C | 0 | 118 | 0 |
| D | 0 | 118 | 0 |
| Mode M0 | |||
|---|---|---|---|
| Quadrant | BADHDUFLAG | Total packets | Discarded packets |
| A | 0 | 23653 | 1 |
| B | 0 | 24740 | 1 |
| C | 0 | 23437 | 1 |
| D | 0 | 24403 | 1 |
| Quadrant | Total seconds | Saturated seconds | Saturation percentage |
|---|---|---|---|
| A | 5739 | 11 | 0.191671% |
| B | 5739 | 15 | 0.261370% |
| C | 5739 | 10 | 0.174246% |
| D | 5740 | 81 | 1.411150% |
Noise dominated data is calculated using 1-second bins in cleaned event files. If a bin has >2000 counts, and if more than 50% of those come from <1% of pixels, then it is considered to be noise-dominated and hence unusable.
| Quadrant | # 1 sec bins | Bins with >0 counts | Bins with >2000 counts | High rate bins dominated by noise | Noise dominated (total time) | Noise dominated (detector-on time) | Marked lightcurve |
|---|---|---|---|---|---|---|---|
| A | 6879 | 5740 | 134 | 134 | 1.95% | 2.33% |  |
| B | 6879 | 5740 | 172 | 172 | 2.50% | 3.00% |  |
| C | 6879 | 5740 | 103 | 103 | 1.50% | 1.79% | 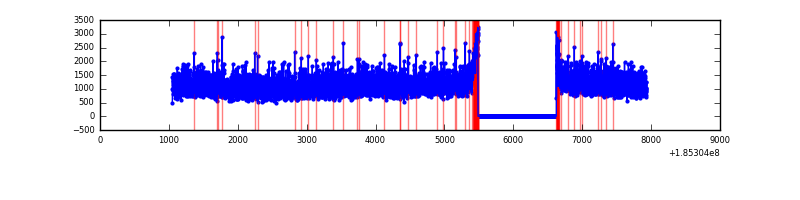 |
| D | 6880 | 5741 | 288 | 288 | 4.19% | 5.02% | 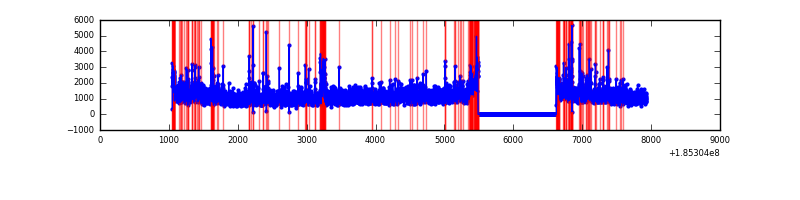 |
Top three noisy pixels from each quadrant. If the there are fewer than three noisy pixels in the level2.evt file, extra rows are filled as -1
| Pixel properties | Quadrant properties | ||||||
|---|---|---|---|---|---|---|---|
| Quadrant | DetID | PixID | Counts | Sigma | Mean | Median | Sigma |
| A | 15 | 171 | 37589 | 88.46 | 1694 | 1704 | 405.6 |
| A | 10 | 230 | 27307 | 63.12 | 1694 | 1704 | 405.6 |
| A | 12 | 236 | 10257 | 21.09 | 1694 | 1704 | 405.6 |
| B | 7 | 221 | 76617 | 178.69 | 1785 | 1794 | 418.7 |
| B | 0 | 220 | 34145 | 77.26 | 1785 | 1794 | 418.7 |
| B | 5 | 191 | 19429 | 42.11 | 1785 | 1794 | 418.7 |
| C | 15 | 241 | 75065 | 160.78 | 1637 | 1697 | 456.3 |
| C | 3 | 111 | 28809 | 59.41 | 1637 | 1697 | 456.3 |
| C | 3 | 79 | 15383 | 29.99 | 1637 | 1697 | 456.3 |
| D | 6 | 226 | 580534 | 1203.35 | 1561 | 1614 | 481.1 |
| D | 1 | 4 | 147149 | 302.51 | 1561 | 1614 | 481.1 |
| D | 7 | 207 | 80149 | 163.24 | 1561 | 1614 | 481.1 |
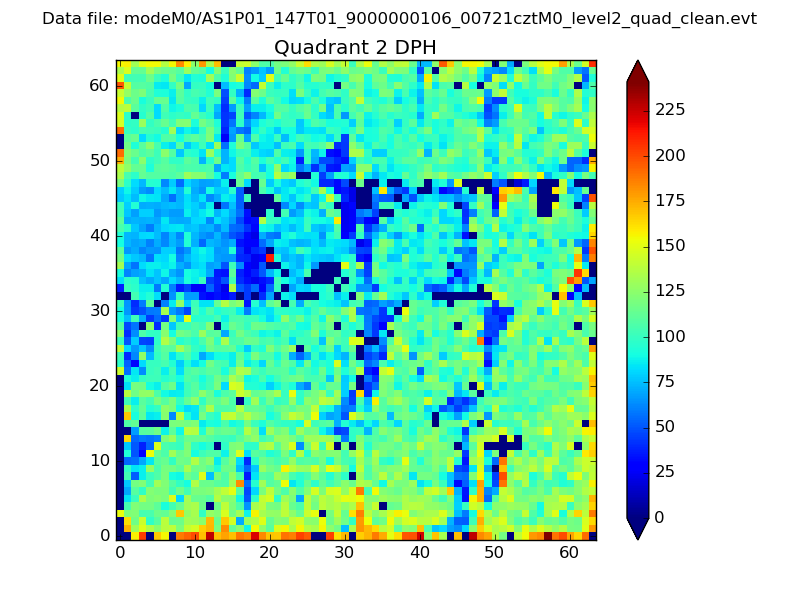
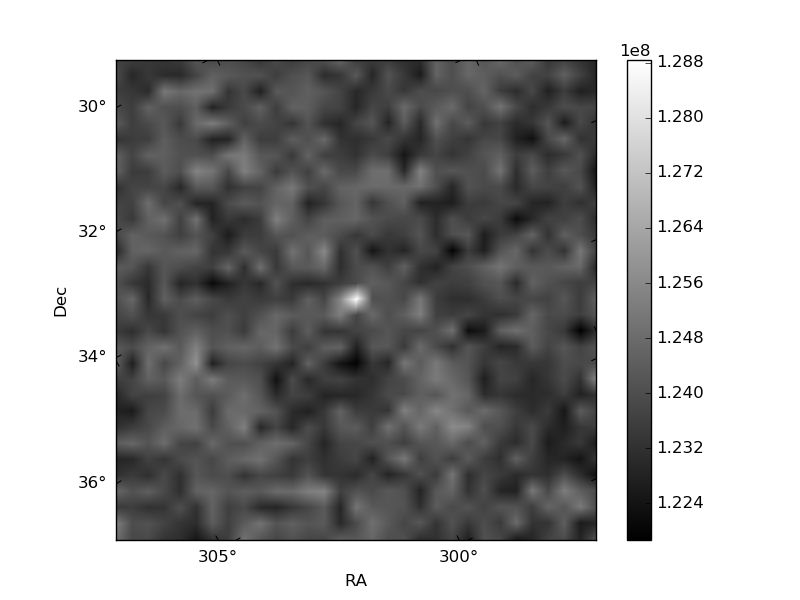
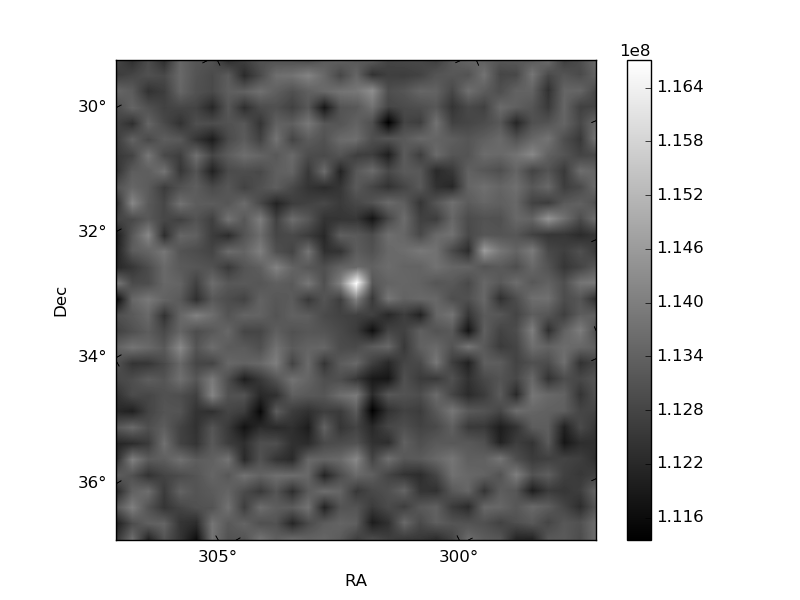
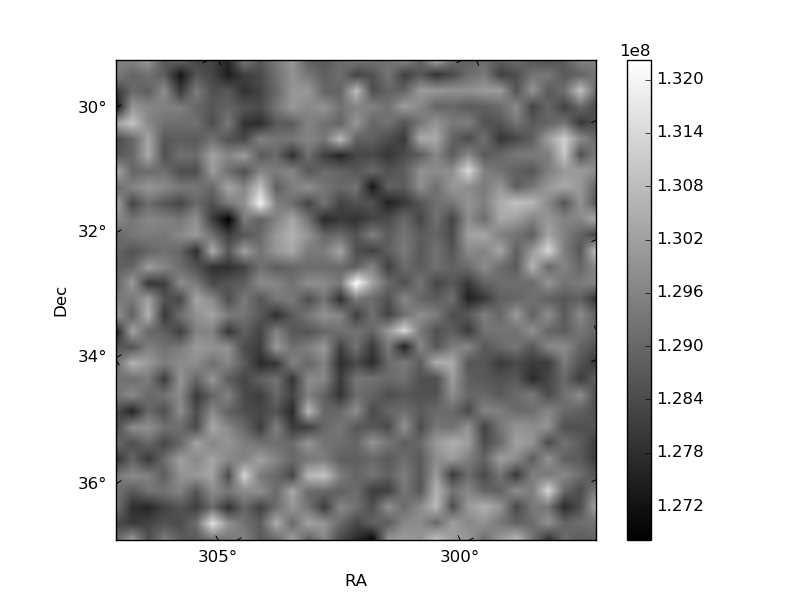
Histogram calculated using DETX and DETY for each event in the final _common_clean file
| Quadrant A | 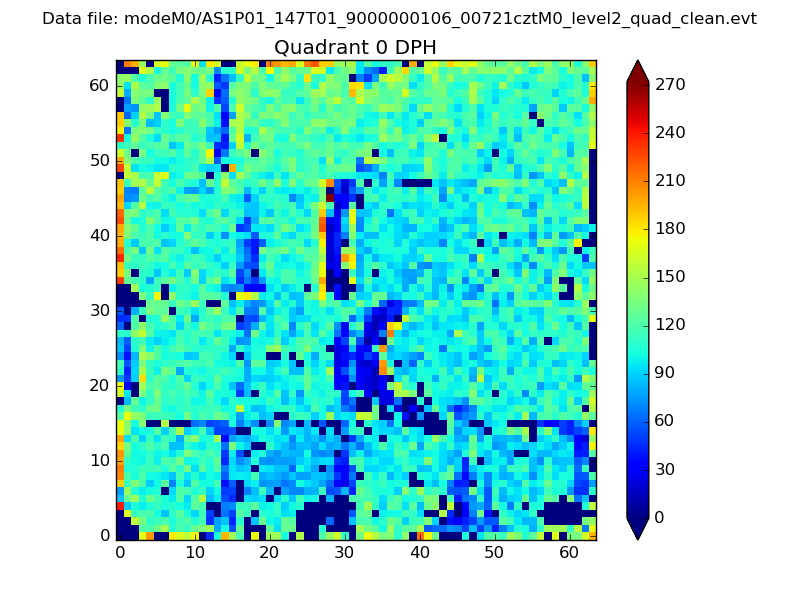 |
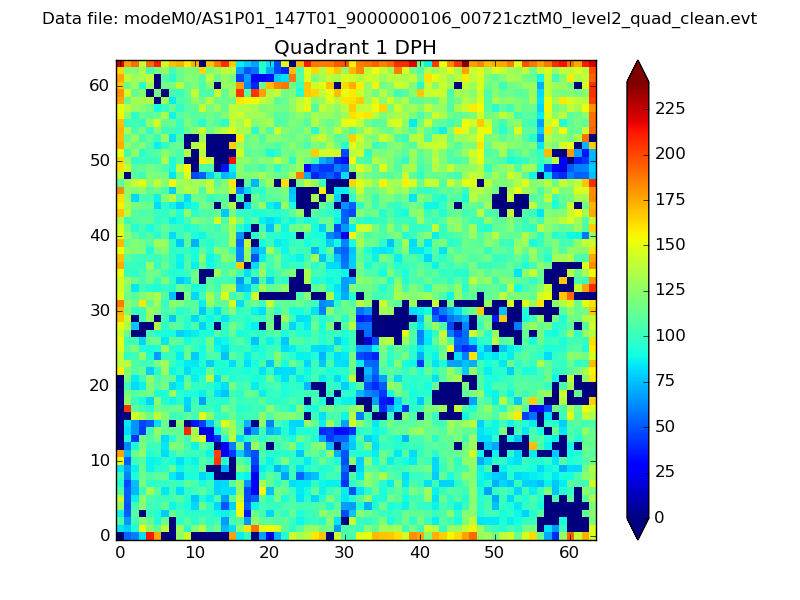 |
Quadrant B |
|---|---|---|---|
| Quadrant D | 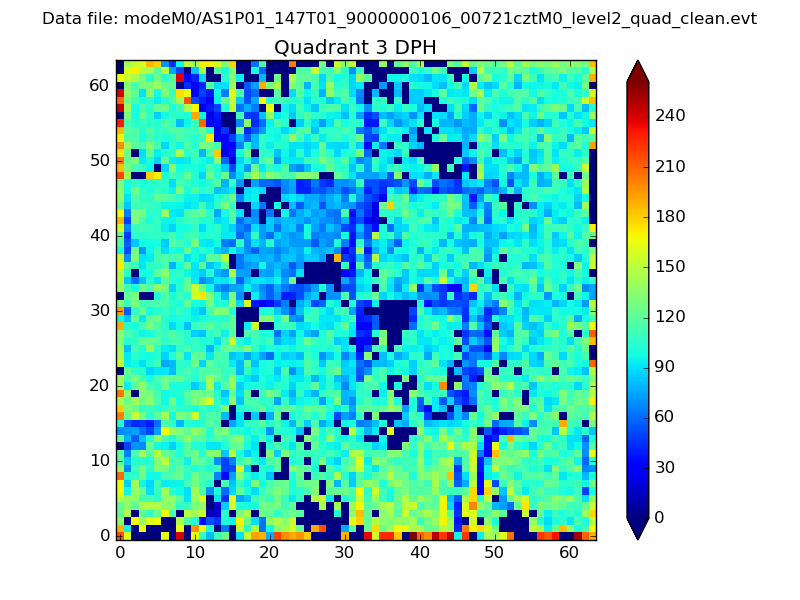 |
 |
Quadrant C |
| Plot type | Count rate plots | Images |
|---|---|---|
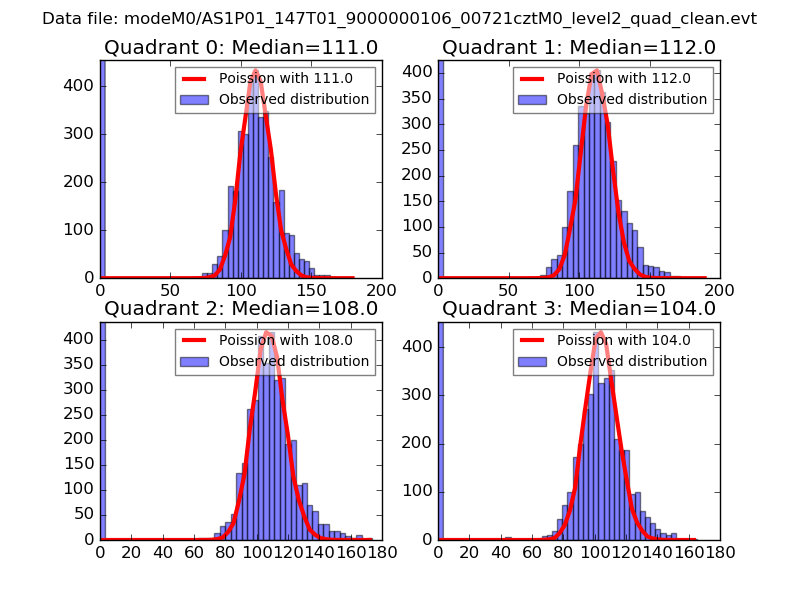
| Comparison with Poisson distribution Blue bars denote a histogram of data divided into 1 sec bins. Red curve is a Poisson curve with rate = median count rate of data. |
 |
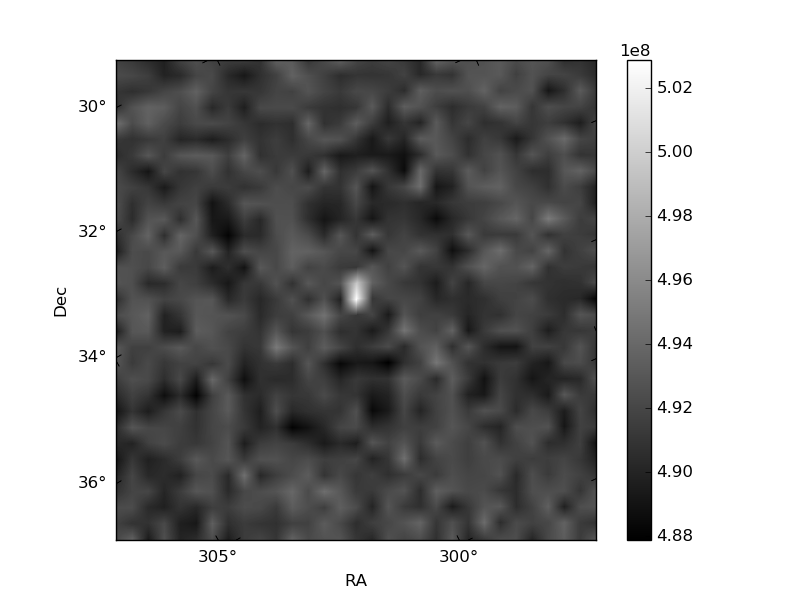 |
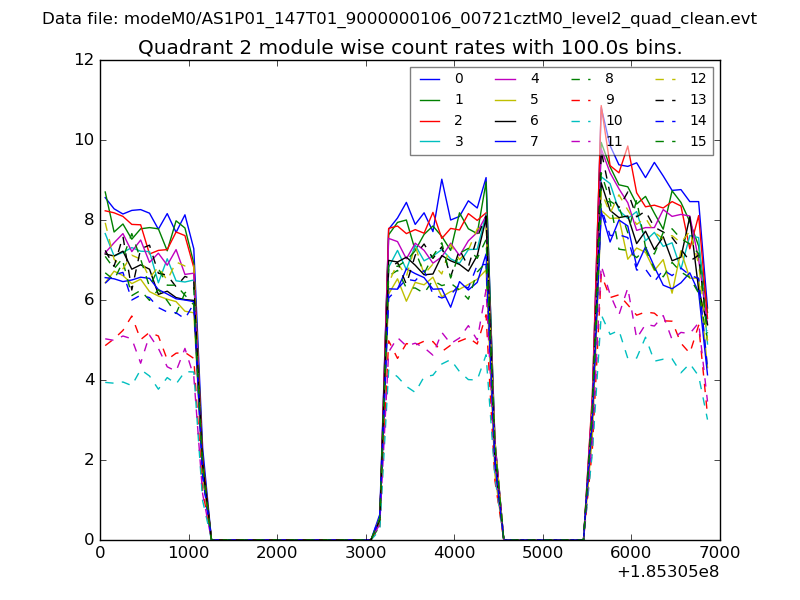
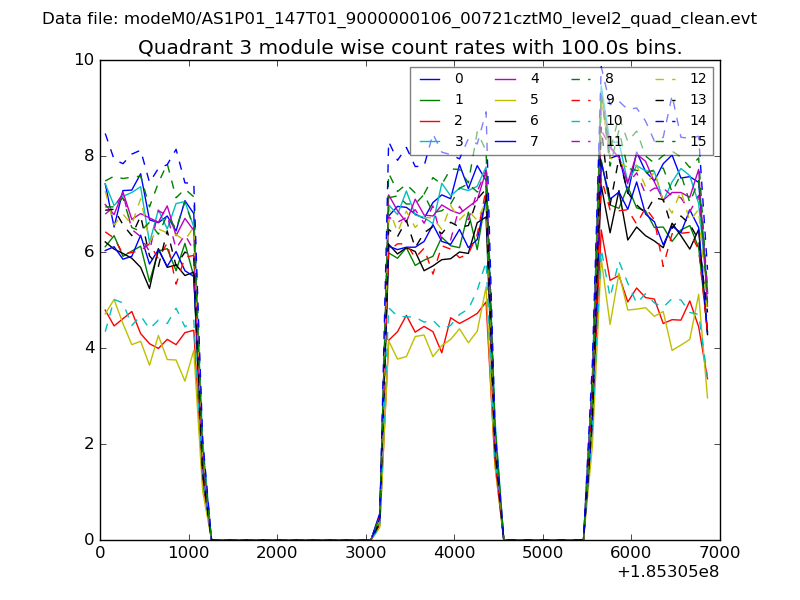
| Quadrant-wise count rates Data is divided into 100 sec bins |
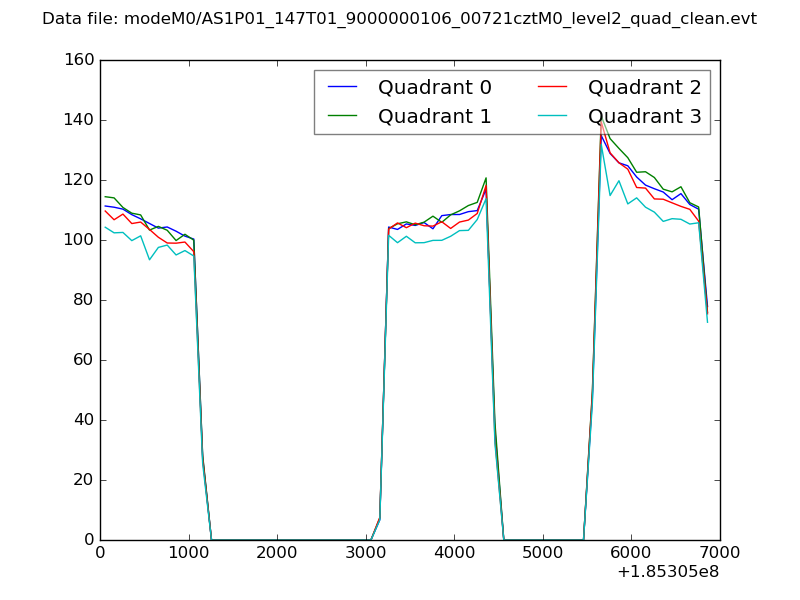 |
|
| Module-wise count rates for Quadrant A Data is divided into 100 sec bins |
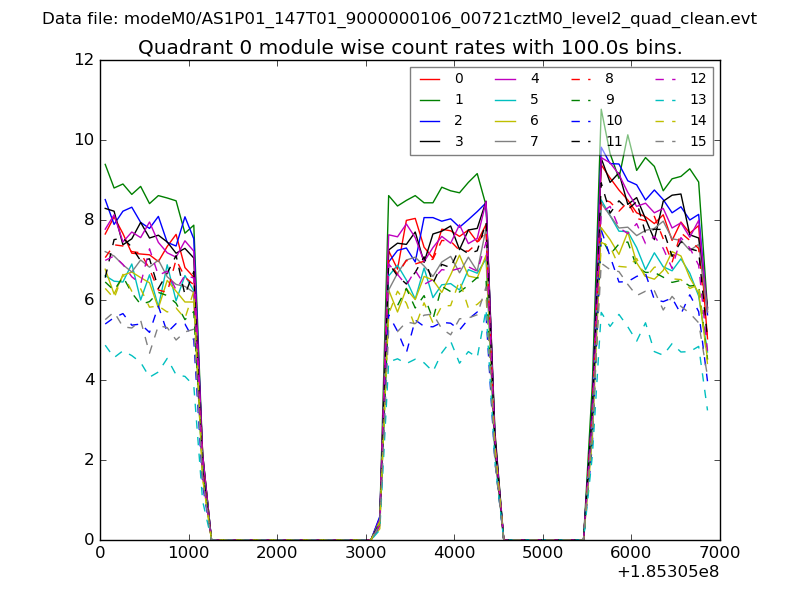 |
 |
| Module-wise count rates for Quadrant B Data is divided into 100 sec bins |
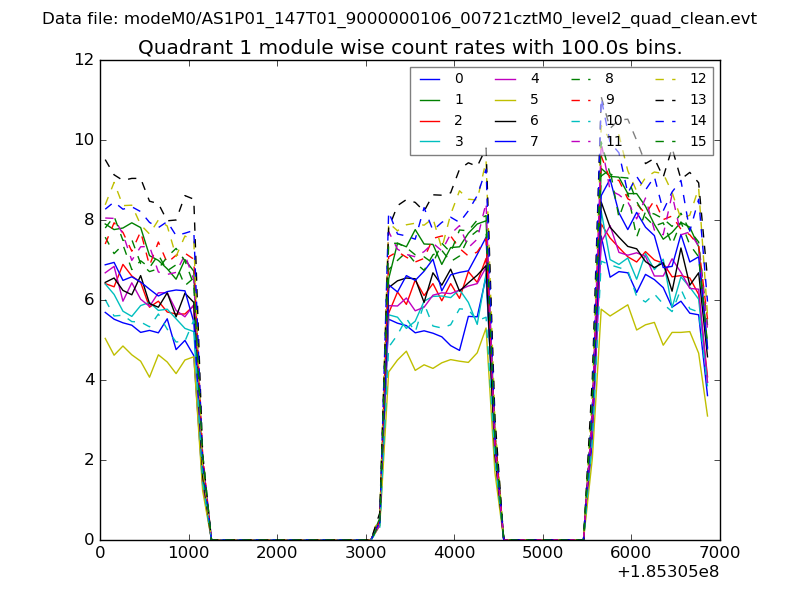 |
 |
| Module-wise count rates for Quadrant C Data is divided into 100 sec bins |
 |
 |
| Module-wise count rates for Quadrant D Data is divided into 100 sec bins |
 |
 |
| Parameter | Plot |
|---|---|
| CZT HV Monitor | 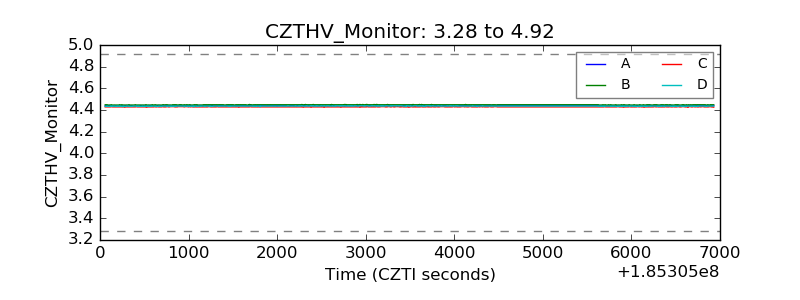 |
| D_VDD | 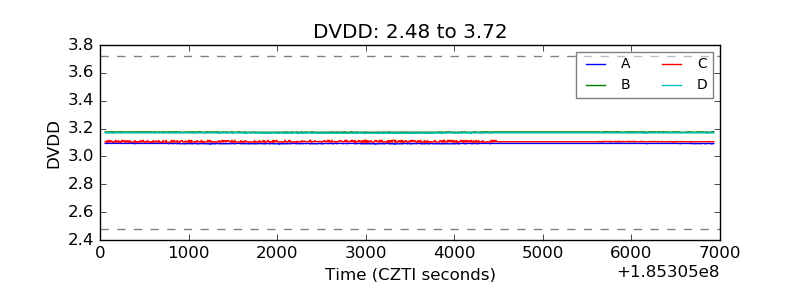 |
| Temperature 1 | 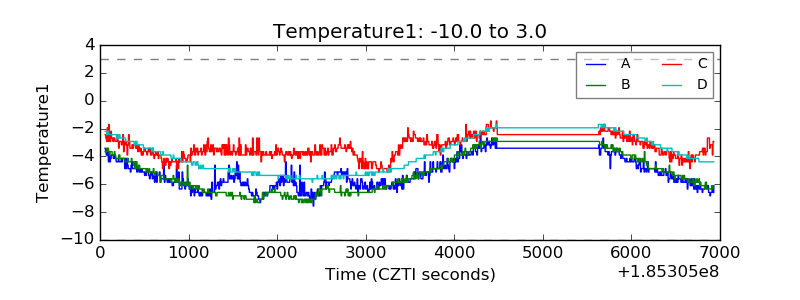 |
| Veto HV Monitor | 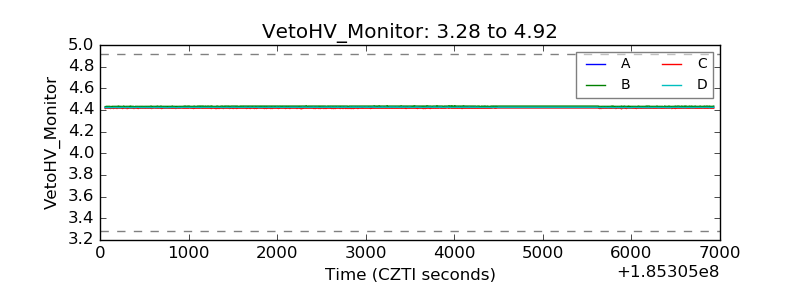 |
| Veto LLD | 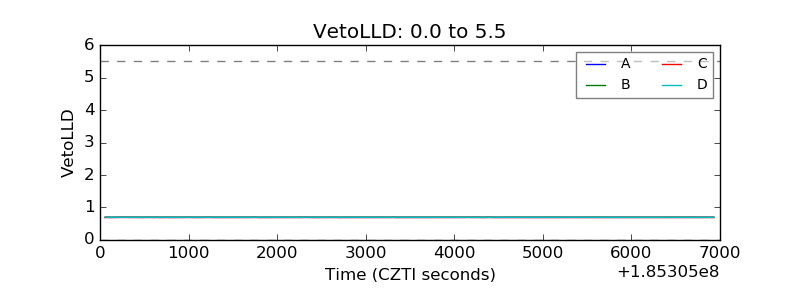 |
| Alpha Counter | 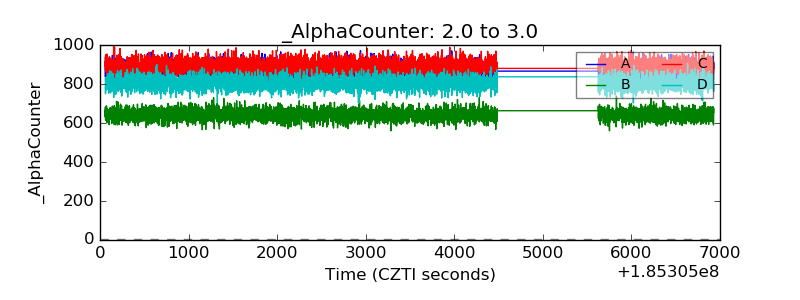 |
| _CPM_Rate | 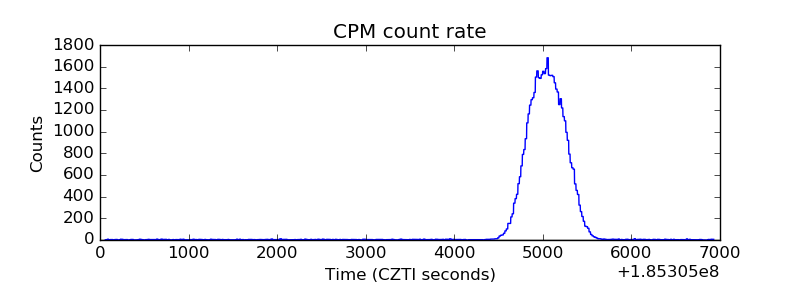 |
| CZT Counter | 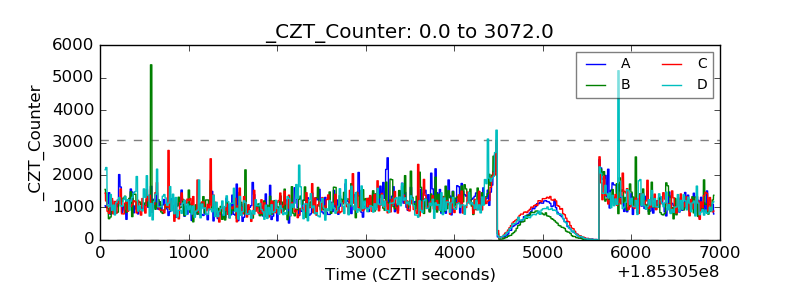 |
| +2.5 Volts monitor |  |
| +5 Volts monitor |  |
| _ROLL_ROT | 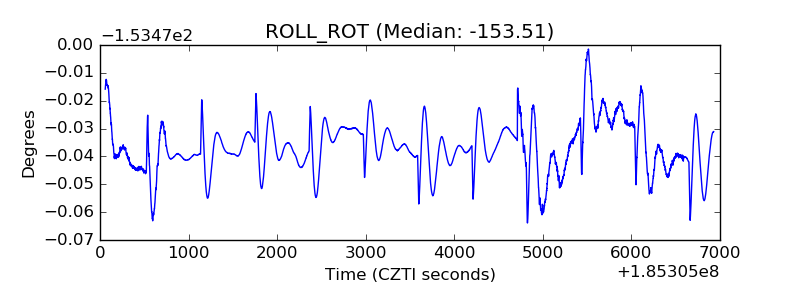 |
| _Roll_DEC | 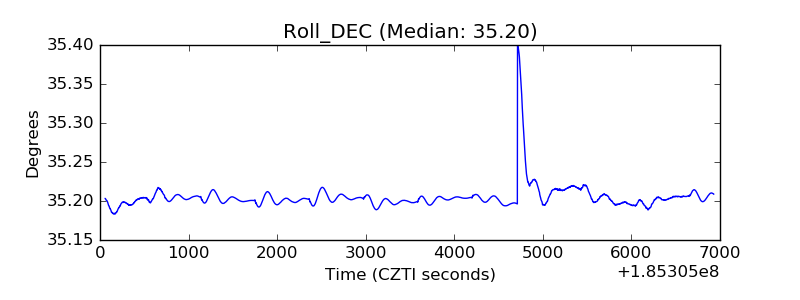 |
| _Roll_RA | 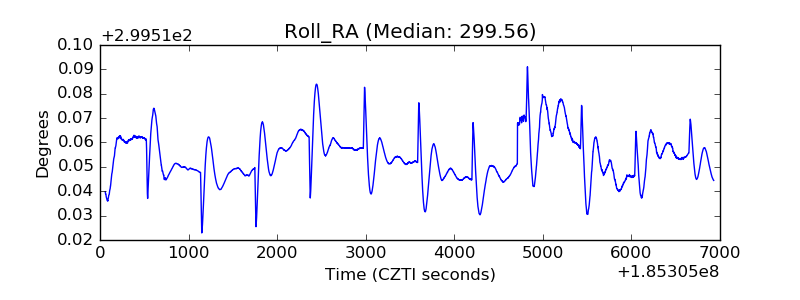 |
| Veto Counter | 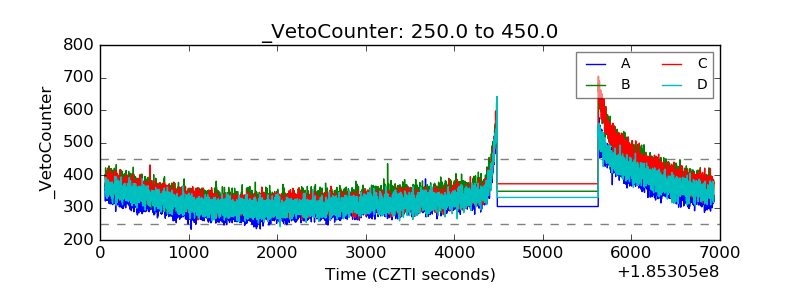 |