| Param | Original file | Final file |
|---|---|---|
| Filename | modeM0/AS1P01_147T01_9000000106_00722cztM0_level2.evt | modeM0/AS1P01_147T01_9000000106_00722cztM0_level2_quad_clean.evt |
| Size (bytes) | 997,505,280 | 72,887,040 |
| Size | 951.3 MB | 69.5 MB |
| Events in quadrant A | 7,345,146 | 447,171 |
| Events in quadrant B | 7,683,069 | 457,363 |
| Events in quadrant C | 7,164,817 | 445,095 |
| Events in quadrant D | 7,601,124 | 420,493 |
| Mode M9 | |||
|---|---|---|---|
| Quadrant | BADHDUFLAG | Total packets | Discarded packets |
| A | 0 | 13 | 0 |
| B | 0 | 13 | 0 |
| C | 0 | 13 | 0 |
| D | 0 | 13 | 0 |
| Mode SS | |||
|---|---|---|---|
| Quadrant | BADHDUFLAG | Total packets | Discarded packets |
| A | 0 | 126 | 0 |
| B | 0 | 126 | 0 |
| C | 0 | 126 | 0 |
| D | 0 | 126 | 0 |
| Mode M0 | |||
|---|---|---|---|
| Quadrant | BADHDUFLAG | Total packets | Discarded packets |
| A | 0 | 26294 | 1 |
| B | 0 | 27282 | 1 |
| C | 0 | 25702 | 1 |
| D | 0 | 26999 | 5 |
| Quadrant | Total seconds | Saturated seconds | Saturation percentage |
|---|---|---|---|
| A | 6262 | 40 | 0.638774% |
| B | 6263 | 23 | 0.367236% |
| C | 6263 | 7 | 0.111768% |
| D | 6262 | 88 | 1.405302% |
Noise dominated data is calculated using 1-second bins in cleaned event files. If a bin has >2000 counts, and if more than 50% of those come from <1% of pixels, then it is considered to be noise-dominated and hence unusable.
| Quadrant | # 1 sec bins | Bins with >0 counts | Bins with >2000 counts | High rate bins dominated by noise | Noise dominated (total time) | Noise dominated (detector-on time) | Marked lightcurve |
|---|---|---|---|---|---|---|---|
| A | 7497 | 6263 | 197 | 197 | 2.63% | 3.15% | 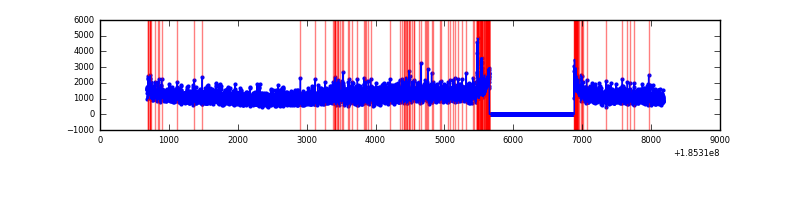 |
| B | 7498 | 6264 | 168 | 168 | 2.24% | 2.68% | 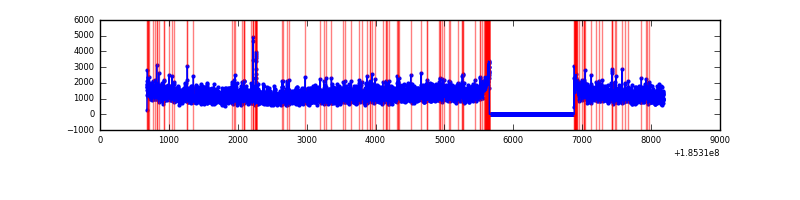 |
| C | 7498 | 6264 | 94 | 94 | 1.25% | 1.50% |  |
| D | 7497 | 6263 | 339 | 339 | 4.52% | 5.41% | 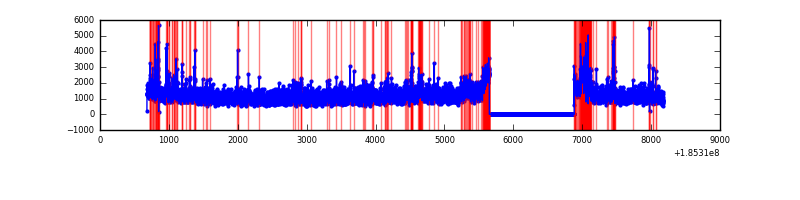 |
Top three noisy pixels from each quadrant. If the there are fewer than three noisy pixels in the level2.evt file, extra rows are filled as -1
| Pixel properties | Quadrant properties | ||||||
|---|---|---|---|---|---|---|---|
| Quadrant | DetID | PixID | Counts | Sigma | Mean | Median | Sigma |
| A | 14 | 111 | 61509 | 134.46 | 1858 | 1873 | 443.5 |
| A | 10 | 230 | 51724 | 112.4 | 1858 | 1873 | 443.5 |
| A | 15 | 171 | 51538 | 111.98 | 1858 | 1873 | 443.5 |
| B | 5 | 191 | 72466 | 153.05 | 1970 | 1981 | 460.5 |
| B | 7 | 221 | 47772 | 99.43 | 1970 | 1981 | 460.5 |
| B | 0 | 220 | 30615 | 62.17 | 1970 | 1981 | 460.5 |
| C | 15 | 241 | 41108 | 78.21 | 1811 | 1882 | 501.6 |
| C | 3 | 111 | 25605 | 47.3 | 1811 | 1882 | 501.6 |
| C | 3 | 79 | 14155 | 24.47 | 1811 | 1882 | 501.6 |
| D | 6 | 226 | 418087 | 783.13 | 1733 | 1795 | 531.6 |
| D | 7 | 207 | 384533 | 720.01 | 1733 | 1795 | 531.6 |
| D | 1 | 4 | 162560 | 302.43 | 1733 | 1795 | 531.6 |
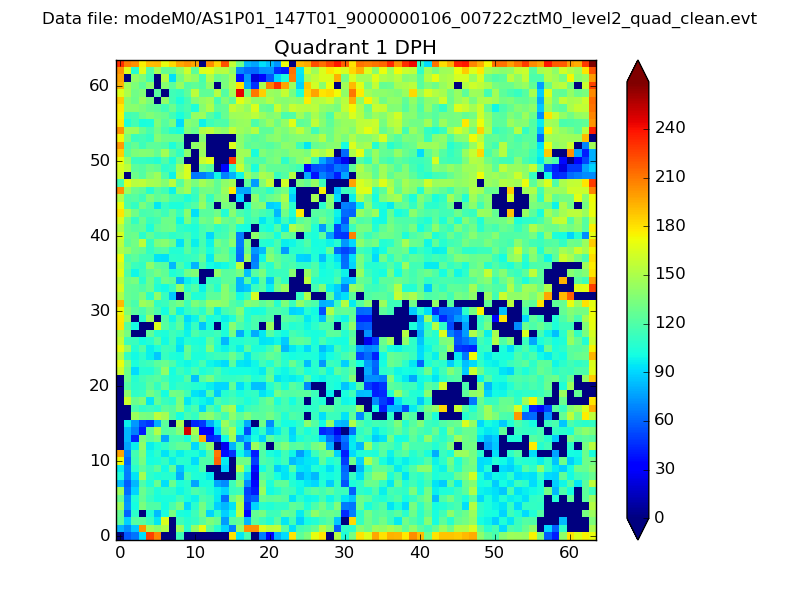
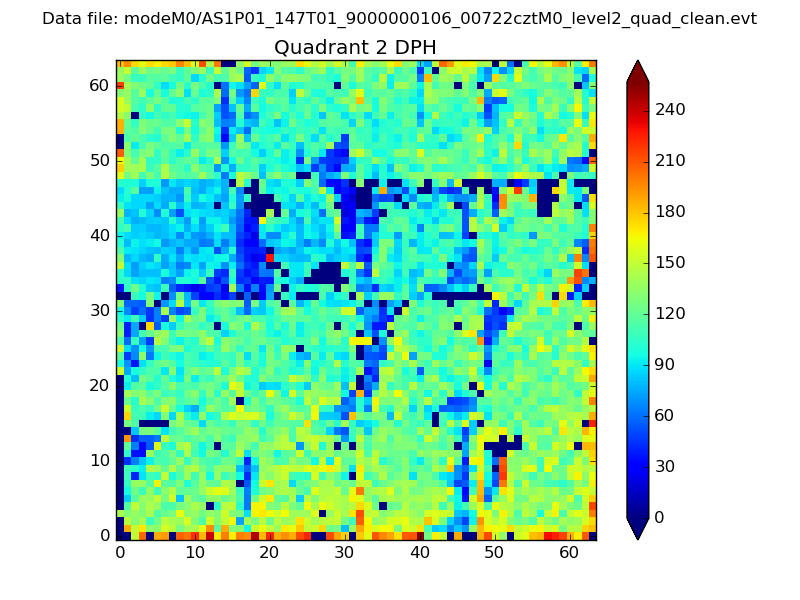
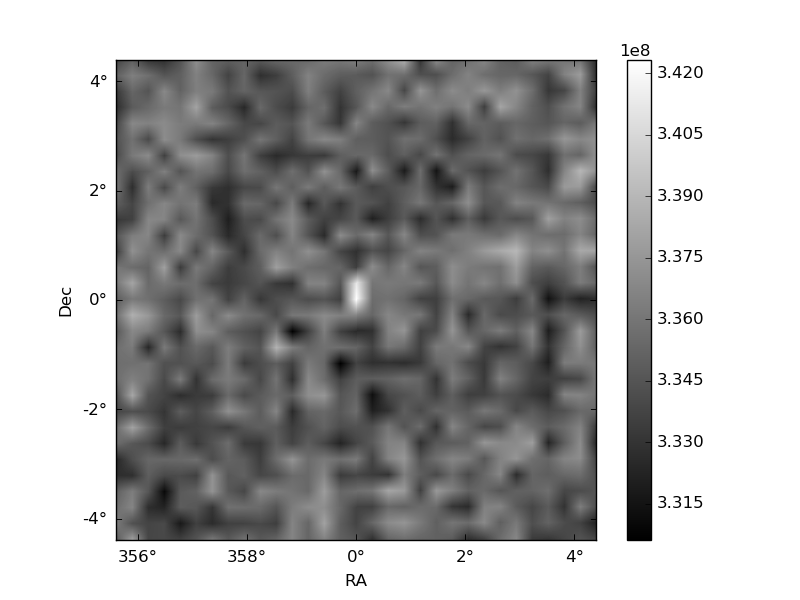
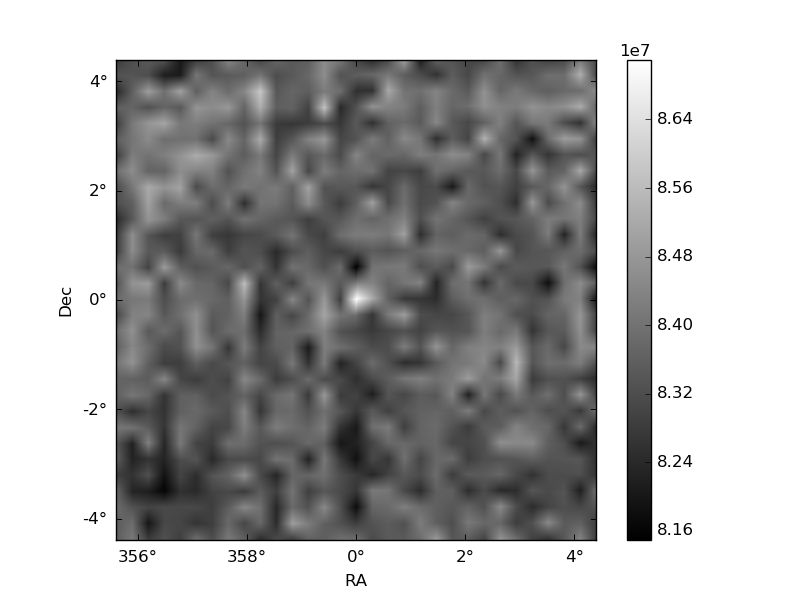
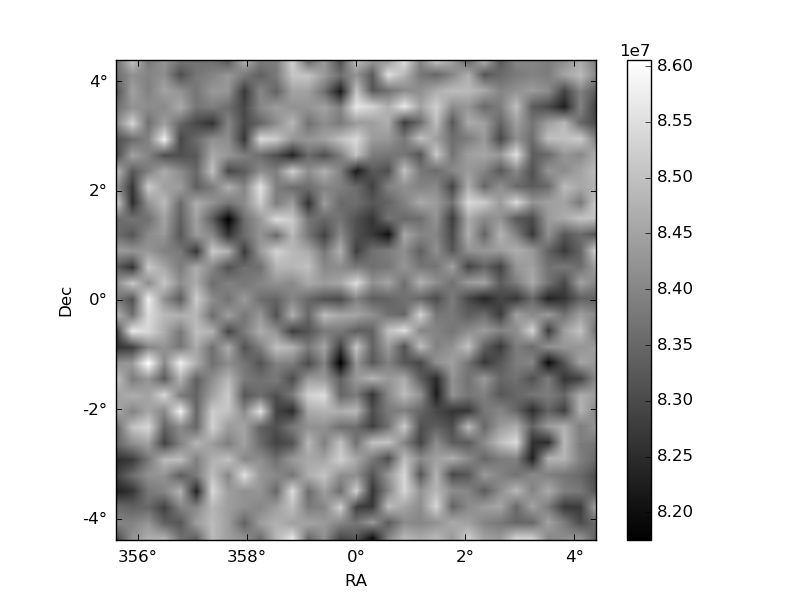
Histogram calculated using DETX and DETY for each event in the final _common_clean file
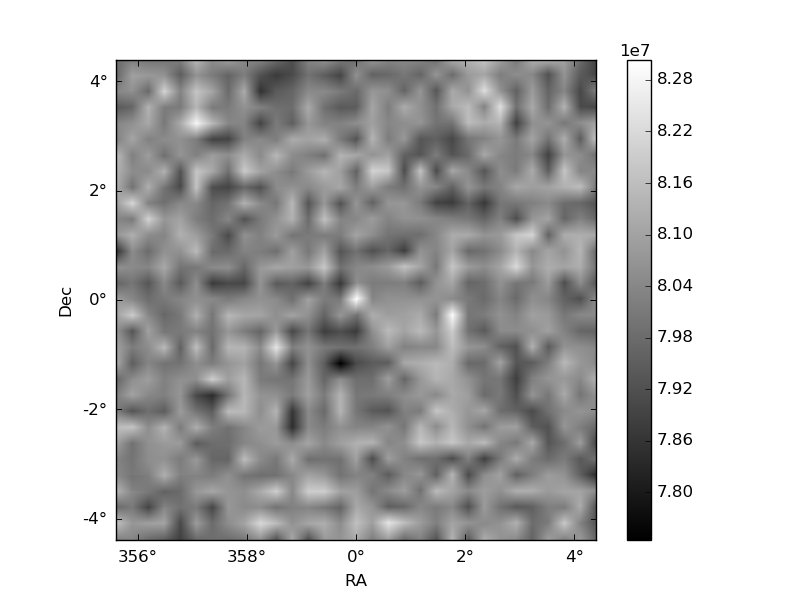
| Quadrant A | 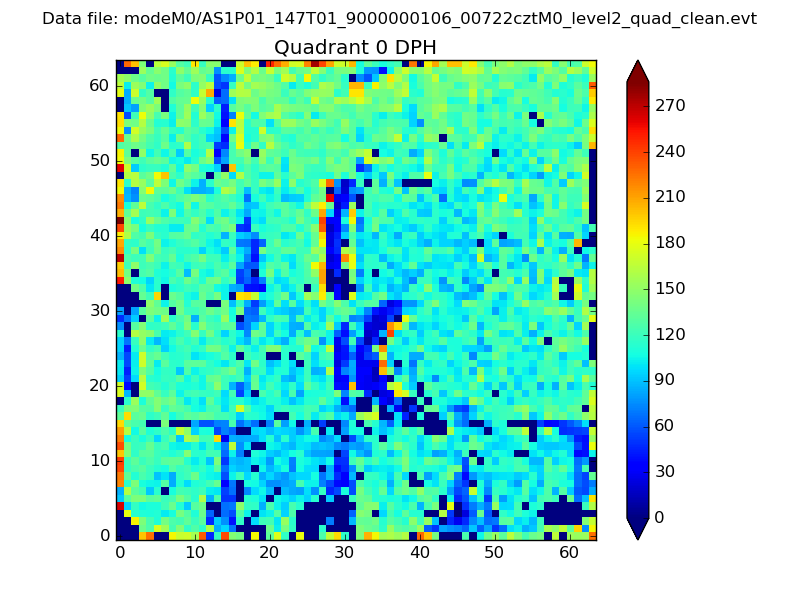 |
 |
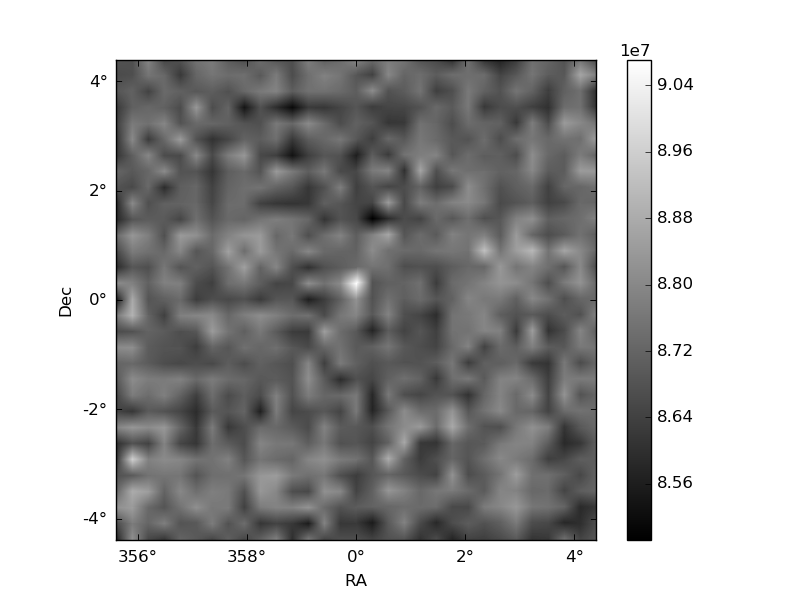
Quadrant B |
|---|---|---|---|
| Quadrant D | 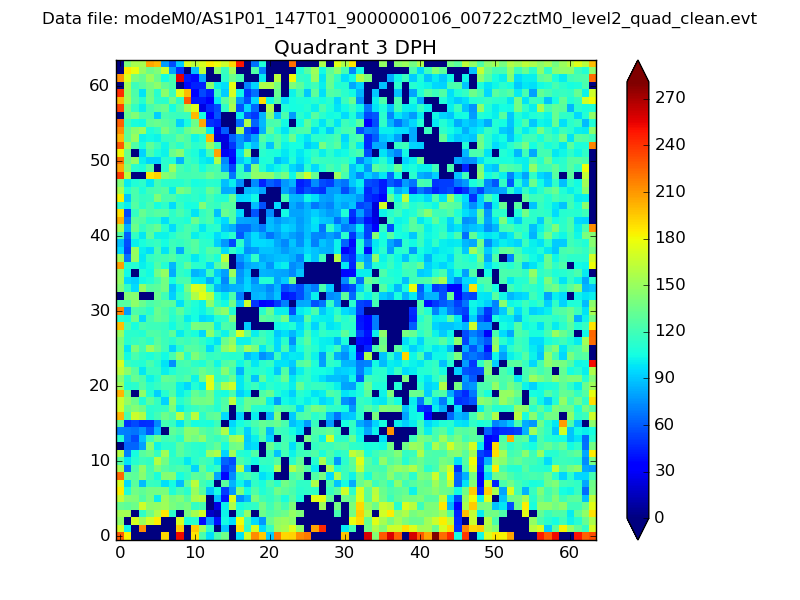 |
 |
Quadrant C |
| Plot type | Count rate plots | Images |
|---|---|---|
| Comparison with Poisson distribution Blue bars denote a histogram of data divided into 1 sec bins. Red curve is a Poisson curve with rate = median count rate of data. |
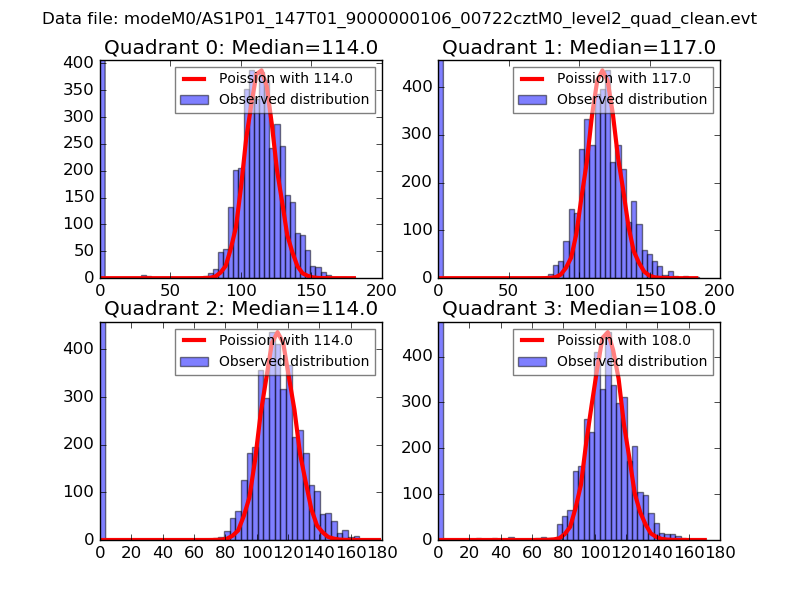 |
 |
| Quadrant-wise count rates Data is divided into 100 sec bins |
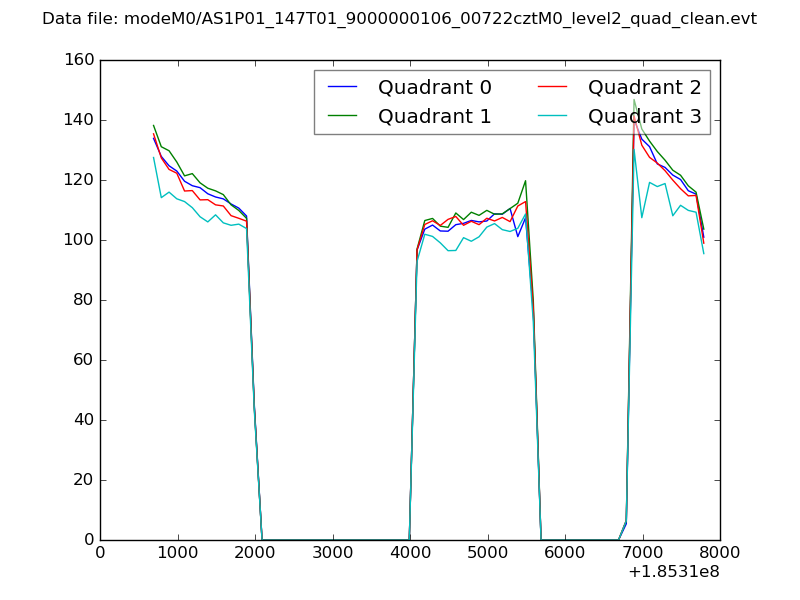 |
|
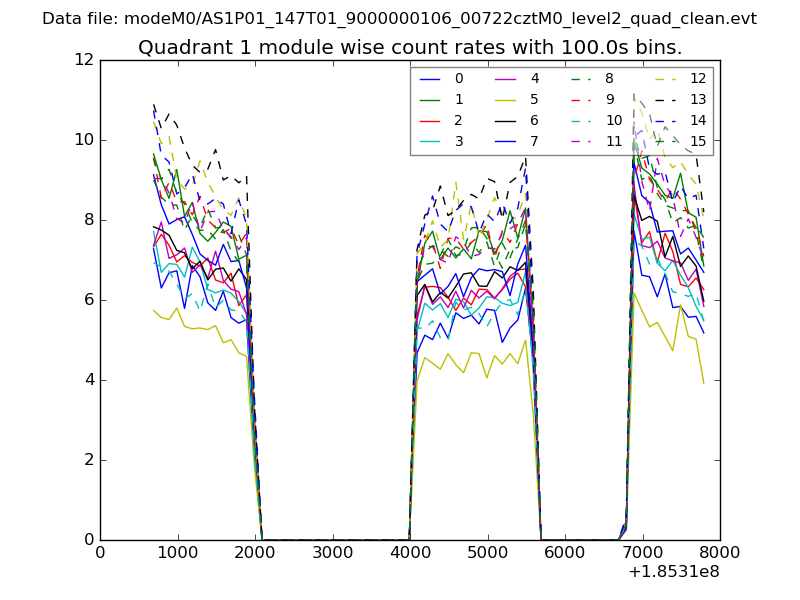
| Module-wise count rates for Quadrant A Data is divided into 100 sec bins |
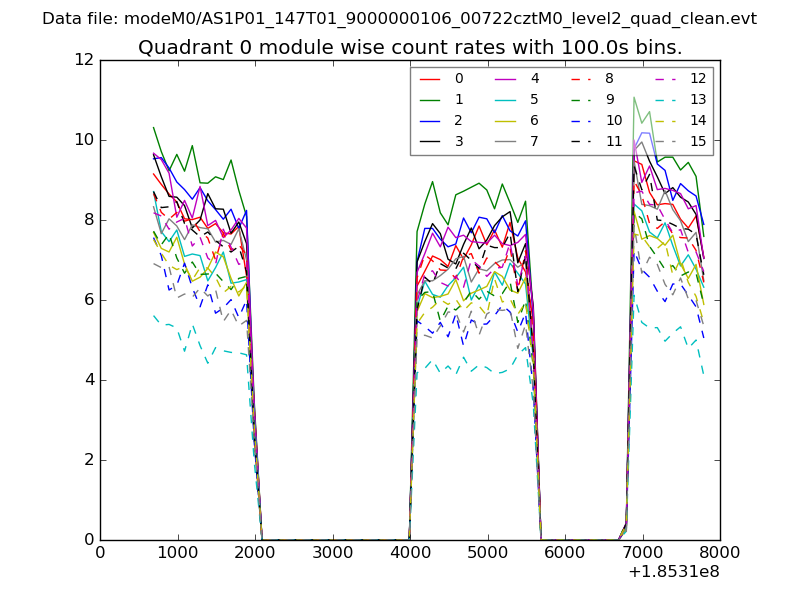 |
 |
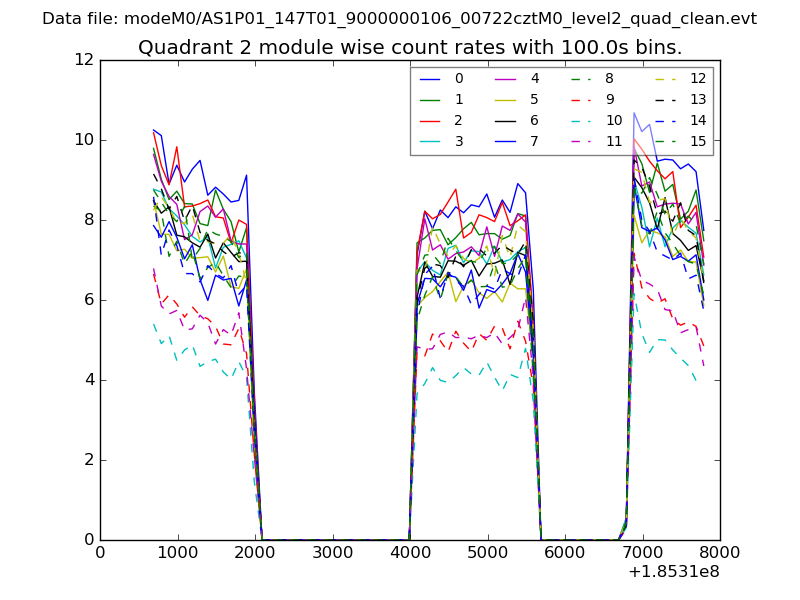
| Module-wise count rates for Quadrant B Data is divided into 100 sec bins |
 |
 |
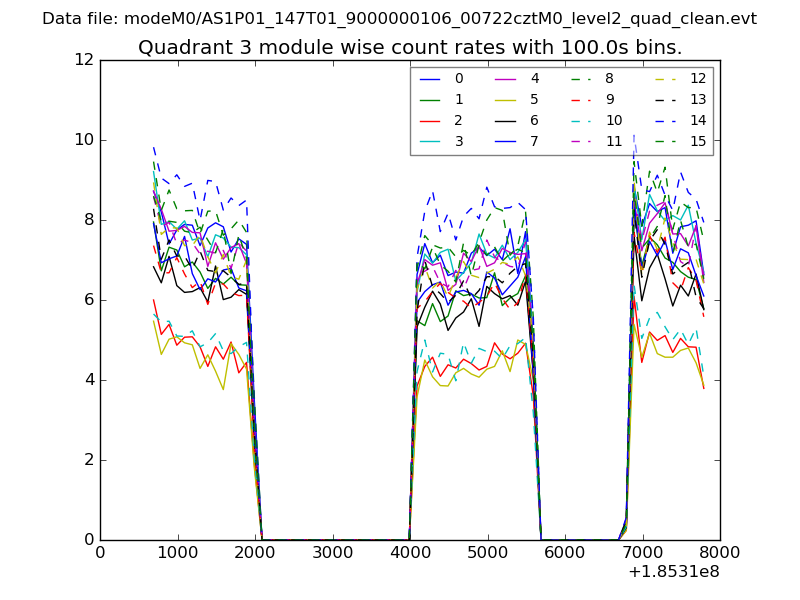
| Module-wise count rates for Quadrant C Data is divided into 100 sec bins |
 |
 |
| Module-wise count rates for Quadrant D Data is divided into 100 sec bins |
 |
 |
| Parameter | Plot |
|---|---|
| CZT HV Monitor |  |
| D_VDD | 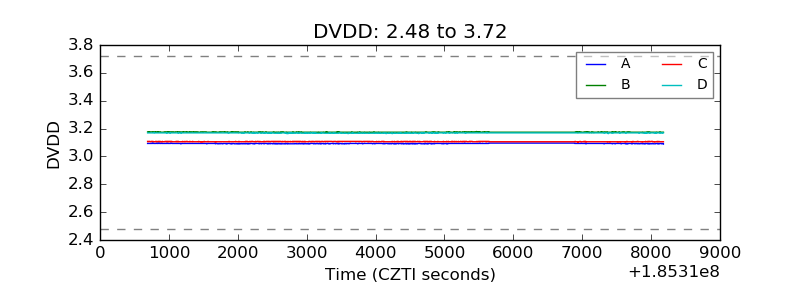 |
| Temperature 1 | 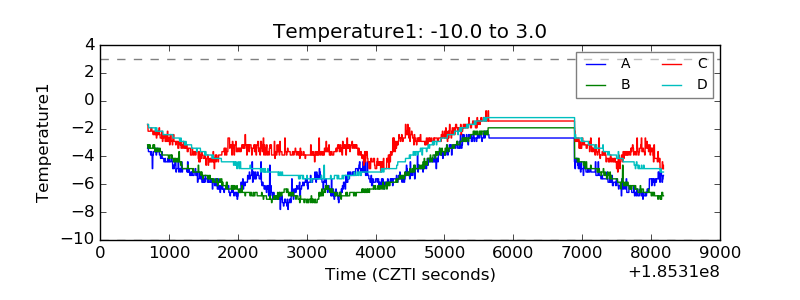 |
| Veto HV Monitor | 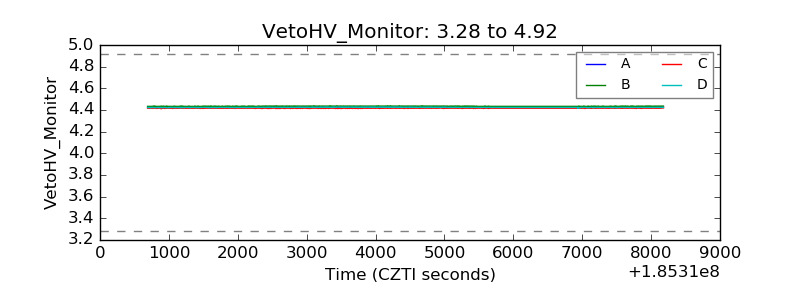 |
| Veto LLD | 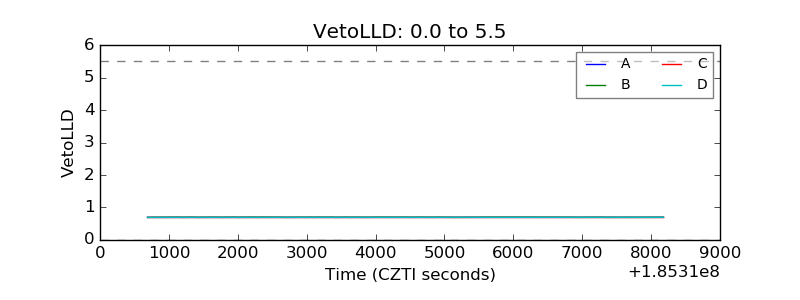 |
| Alpha Counter | 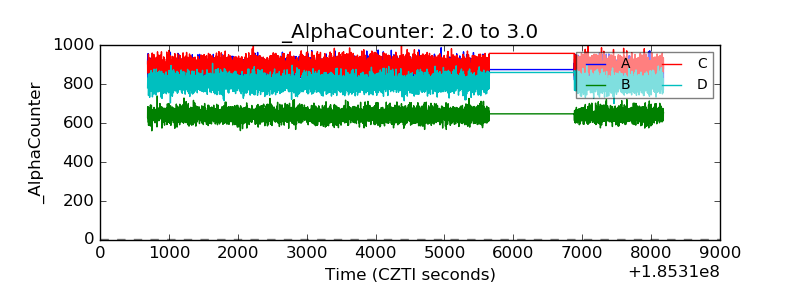 |
| _CPM_Rate | 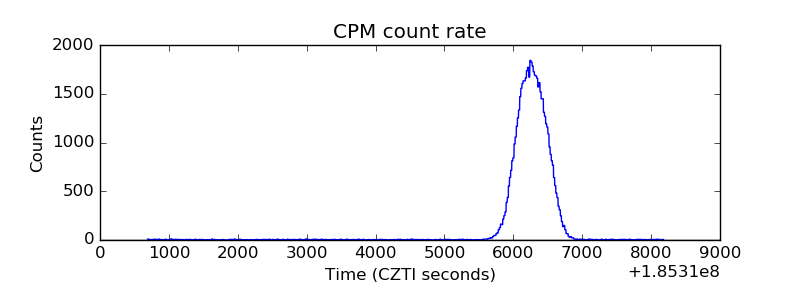 |
| CZT Counter | 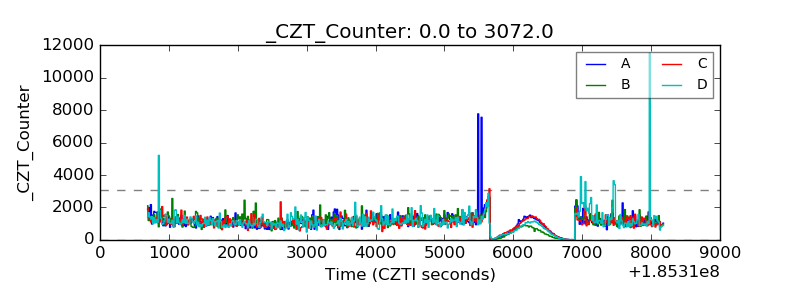 |
| +2.5 Volts monitor |  |
| +5 Volts monitor | 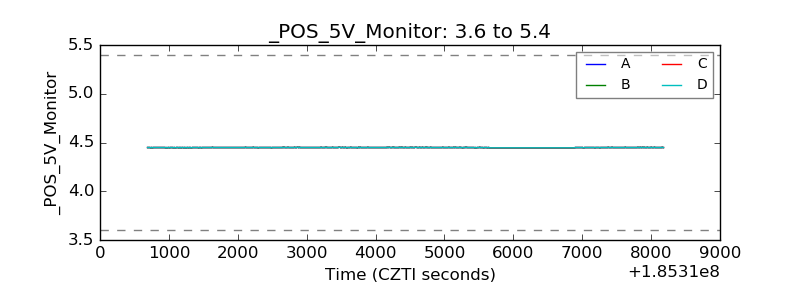 |
| _ROLL_ROT | 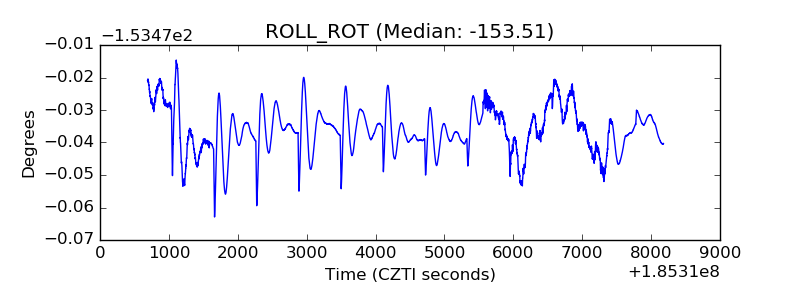 |
| _Roll_DEC | 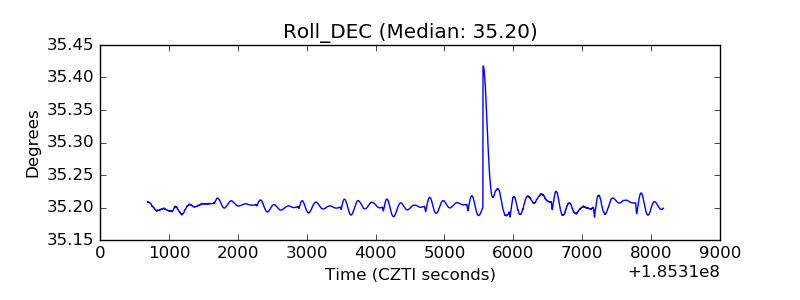 |
| _Roll_RA | 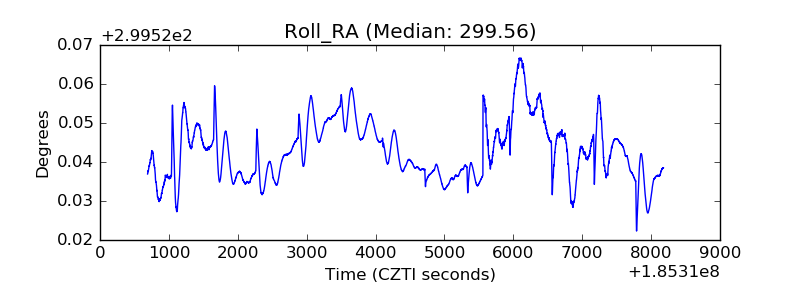 |
| Veto Counter | 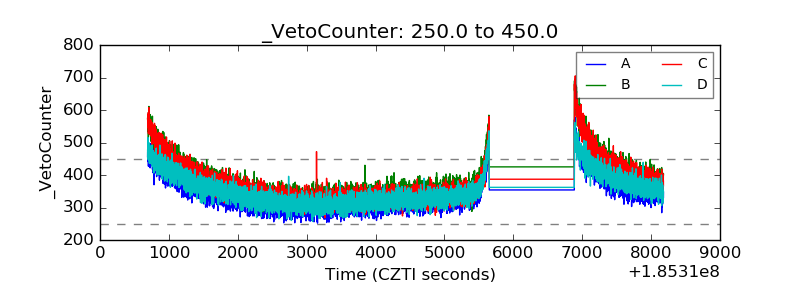 |