| Param | Original file | Final file |
|---|---|---|
| Filename | modeM0/AS1P01_147T01_9000000106_00723cztM0_level2.evt | modeM0/AS1P01_147T01_9000000106_00723cztM0_level2_quad_clean.evt |
| Size (bytes) | 1,033,963,200 | 67,037,760 |
| Size | 986.1 MB | 63.9 MB |
| Events in quadrant A | 7,600,134 | 398,778 |
| Events in quadrant B | 7,941,903 | 406,658 |
| Events in quadrant C | 7,464,413 | 394,694 |
| Events in quadrant D | 7,874,578 | 374,605 |
| Mode M9 | |||
|---|---|---|---|
| Quadrant | BADHDUFLAG | Total packets | Discarded packets |
| A | 0 | 13 | 0 |
| B | 0 | 13 | 0 |
| C | 0 | 13 | 0 |
| D | 0 | 13 | 0 |
| Mode SS | |||
|---|---|---|---|
| Quadrant | BADHDUFLAG | Total packets | Discarded packets |
| A | 0 | 132 | 0 |
| B | 0 | 132 | 0 |
| C | 0 | 132 | 0 |
| D | 0 | 132 | 0 |
| Mode M0 | |||
|---|---|---|---|
| Quadrant | BADHDUFLAG | Total packets | Discarded packets |
| A | 0 | 27216 | 2 |
| B | 0 | 28229 | 6 |
| C | 0 | 26780 | 2 |
| D | 0 | 28037 | 2 |
| Quadrant | Total seconds | Saturated seconds | Saturation percentage |
|---|---|---|---|
| A | 6525 | 14 | 0.214559% |
| B | 6524 | 4 | 0.061312% |
| C | 6524 | 4 | 0.061312% |
| D | 6524 | 90 | 1.379522% |
Noise dominated data is calculated using 1-second bins in cleaned event files. If a bin has >2000 counts, and if more than 50% of those come from <1% of pixels, then it is considered to be noise-dominated and hence unusable.
| Quadrant | # 1 sec bins | Bins with >0 counts | Bins with >2000 counts | High rate bins dominated by noise | Noise dominated (total time) | Noise dominated (detector-on time) | Marked lightcurve |
|---|---|---|---|---|---|---|---|
| A | 7835 | 6526 | 158 | 158 | 2.02% | 2.42% | 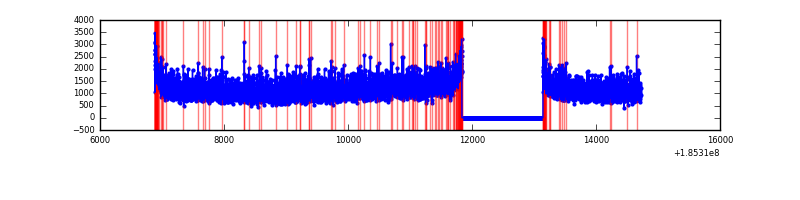 |
| B | 7834 | 6525 | 142 | 142 | 1.81% | 2.18% | 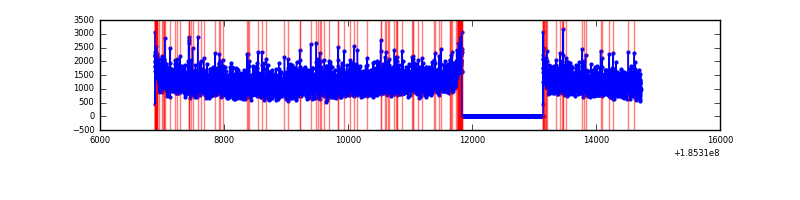 |
| C | 7834 | 6525 | 93 | 93 | 1.19% | 1.43% | 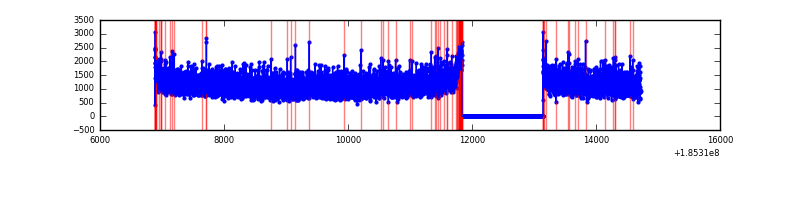 |
| D | 7834 | 6525 | 370 | 370 | 4.72% | 5.67% | 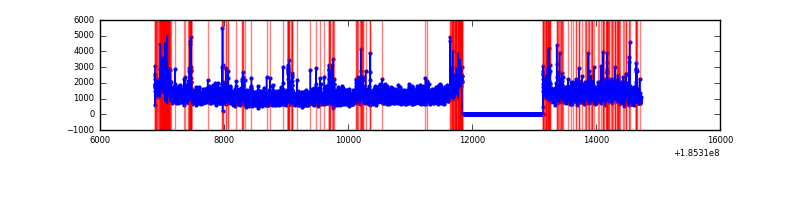 |
Top three noisy pixels from each quadrant. If the there are fewer than three noisy pixels in the level2.evt file, extra rows are filled as -1
| Pixel properties | Quadrant properties | ||||||
|---|---|---|---|---|---|---|---|
| Quadrant | DetID | PixID | Counts | Sigma | Mean | Median | Sigma |
| A | 10 | 230 | 69565 | 145.48 | 1949 | 1965 | 464.7 |
| A | 15 | 17 | 26326 | 52.43 | 1949 | 1965 | 464.7 |
| A | 15 | 171 | 12422 | 22.5 | 1949 | 1965 | 464.7 |
| B | 5 | 191 | 28709 | 55.67 | 2065 | 2081 | 478.3 |
| B | 0 | 220 | 23610 | 45.01 | 2065 | 2081 | 478.3 |
| B | 4 | 232 | 15461 | 27.97 | 2065 | 2081 | 478.3 |
| C | 15 | 241 | 42337 | 77.29 | 1883 | 1950 | 522.6 |
| C | 3 | 111 | 24852 | 43.83 | 1883 | 1950 | 522.6 |
| C | 9 | 52 | 15478 | 25.89 | 1883 | 1950 | 522.6 |
| D | 6 | 226 | 740224 | 1345.3 | 1789 | 1856 | 548.8 |
| D | 1 | 4 | 104001 | 186.11 | 1789 | 1856 | 548.8 |
| D | 14 | 52 | 84430 | 150.45 | 1789 | 1856 | 548.8 |
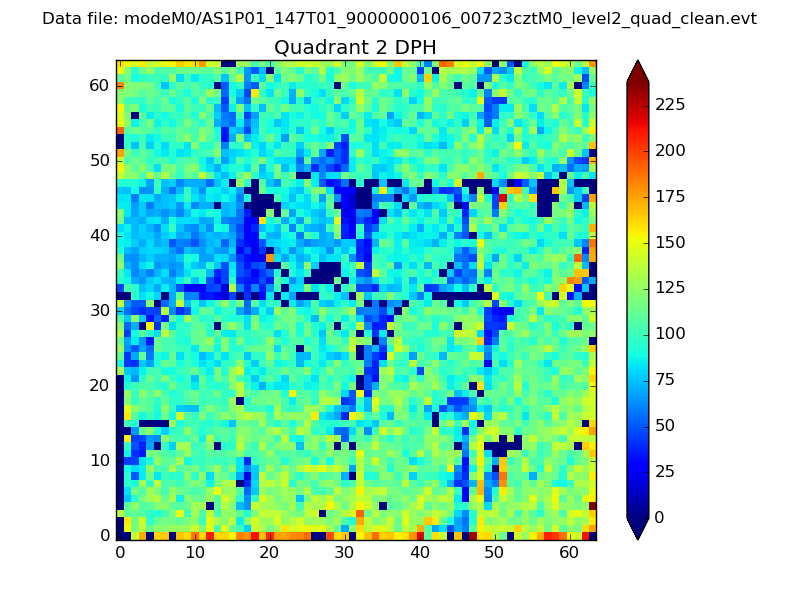
Histogram calculated using DETX and DETY for each event in the final _common_clean file
| Quadrant A | 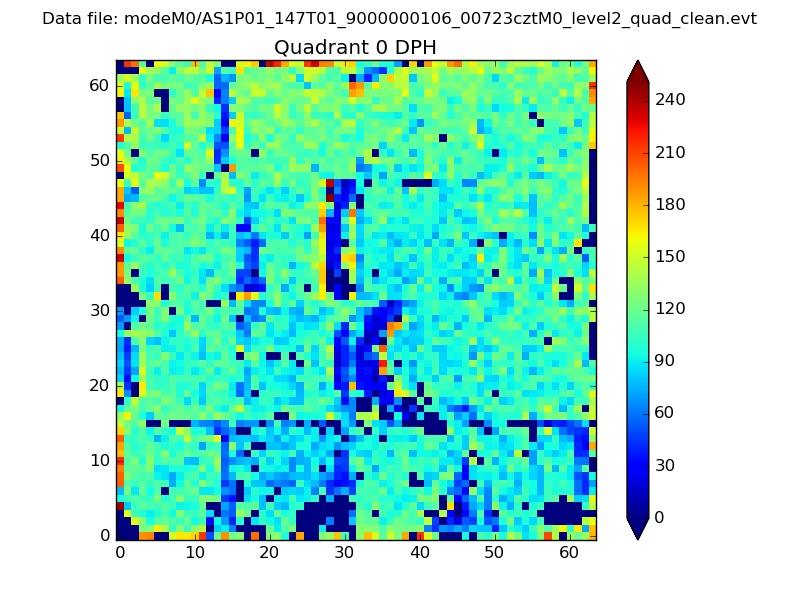 |
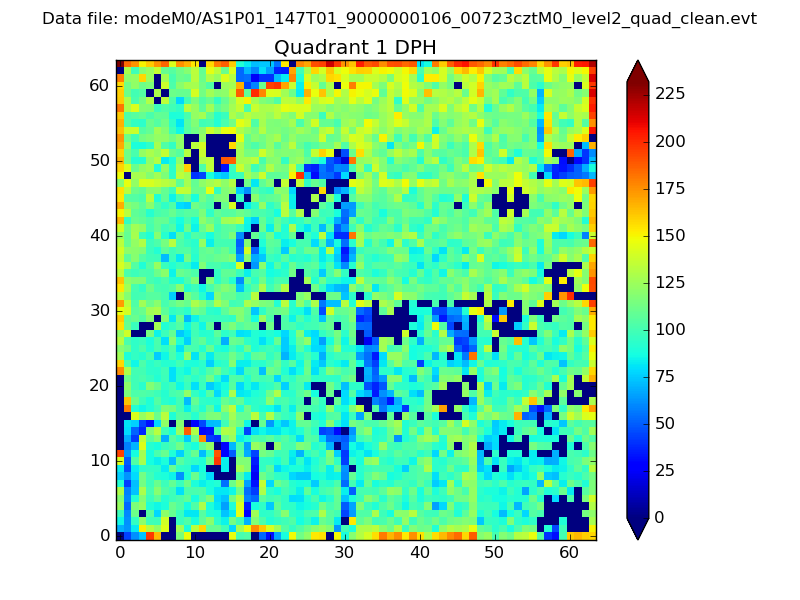 |
Quadrant B |
|---|---|---|---|
| Quadrant D | 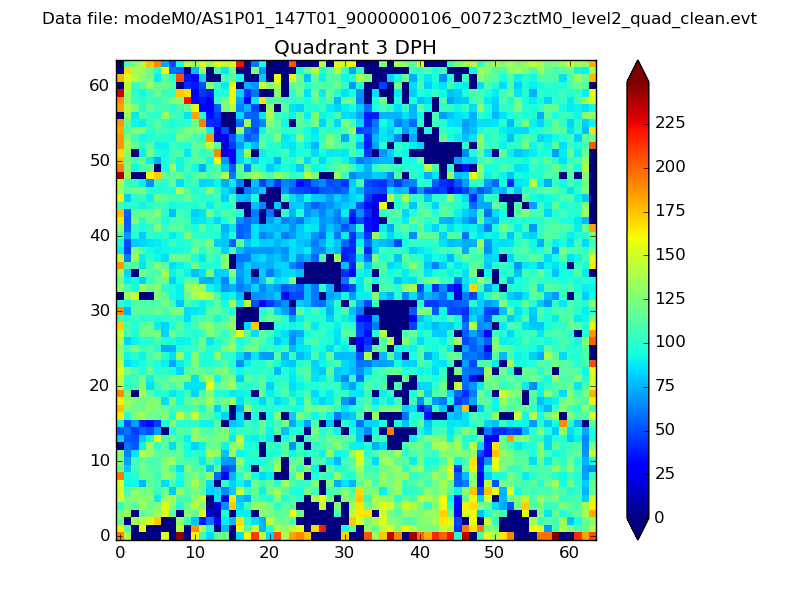 |
 |
Quadrant C |
| Plot type | Count rate plots | Images |
|---|---|---|
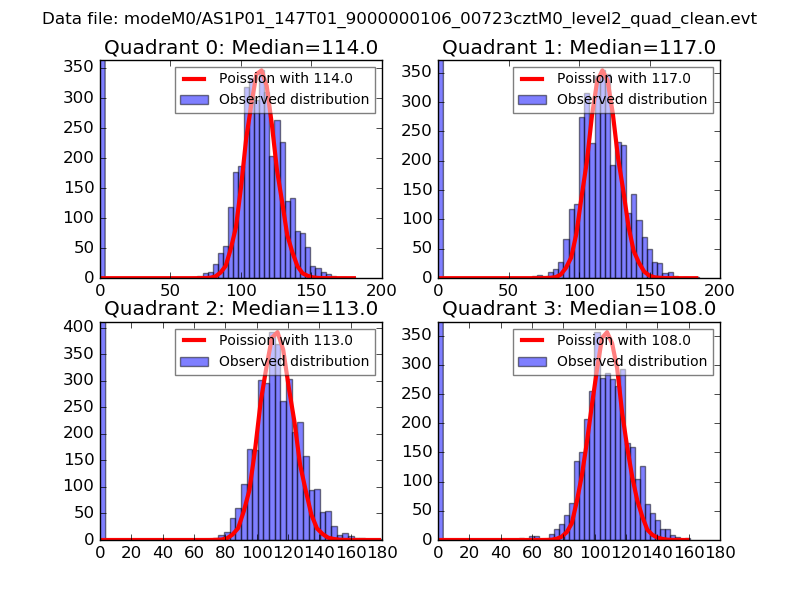
| Comparison with Poisson distribution Blue bars denote a histogram of data divided into 1 sec bins. Red curve is a Poisson curve with rate = median count rate of data. |
 |
 |
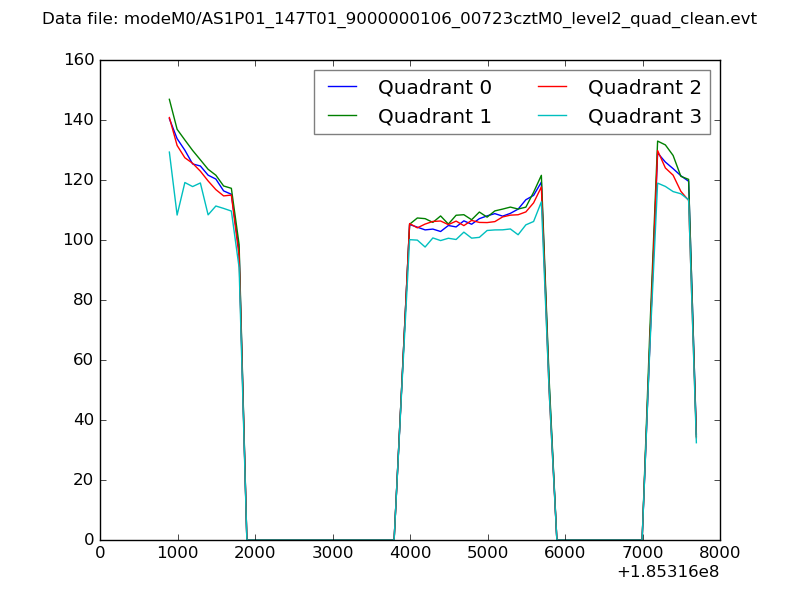
| Quadrant-wise count rates Data is divided into 100 sec bins |
 |
|
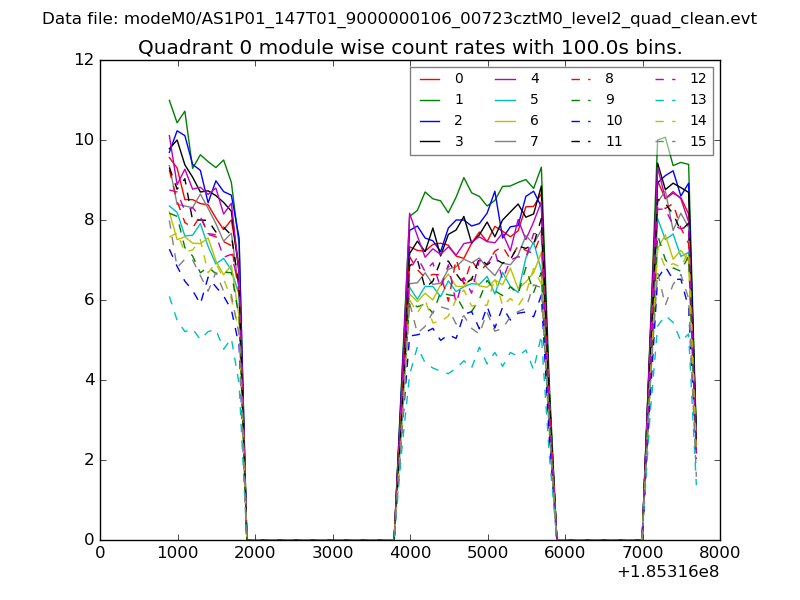
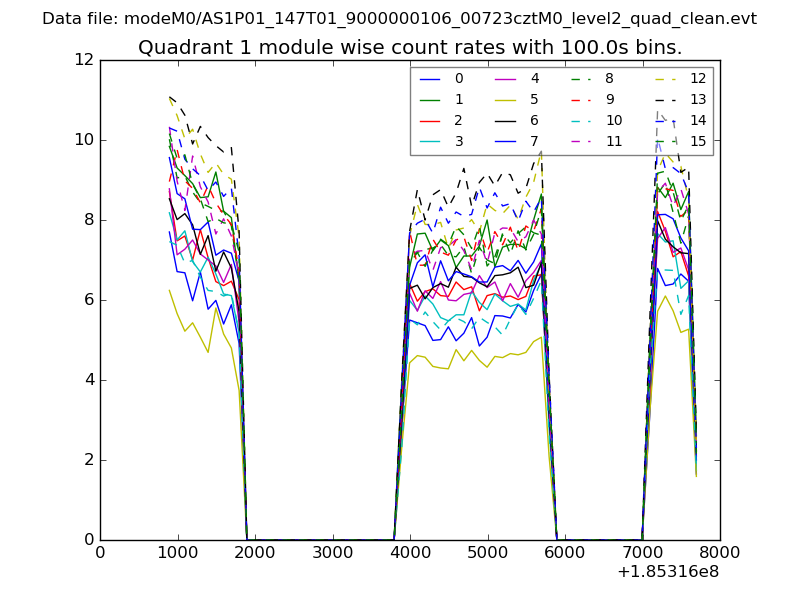
| Module-wise count rates for Quadrant A Data is divided into 100 sec bins |
 |
 |
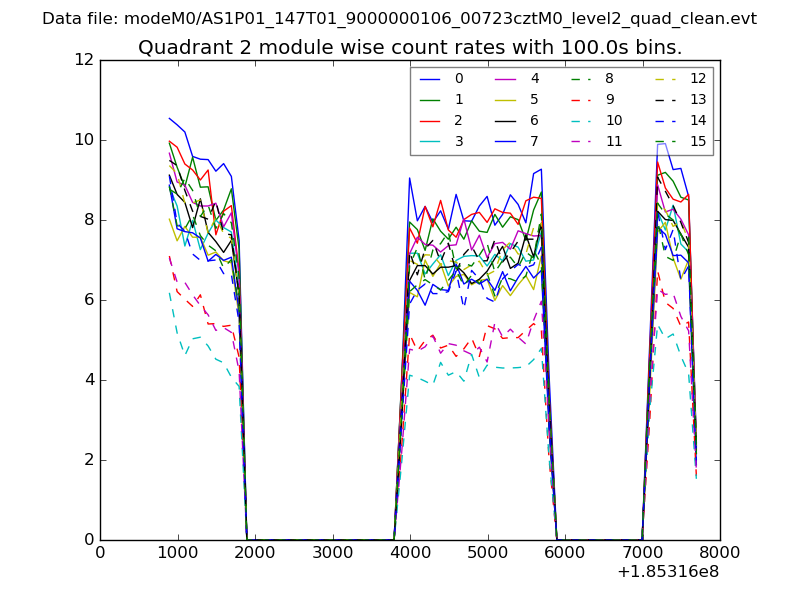
| Module-wise count rates for Quadrant B Data is divided into 100 sec bins |
 |
 |
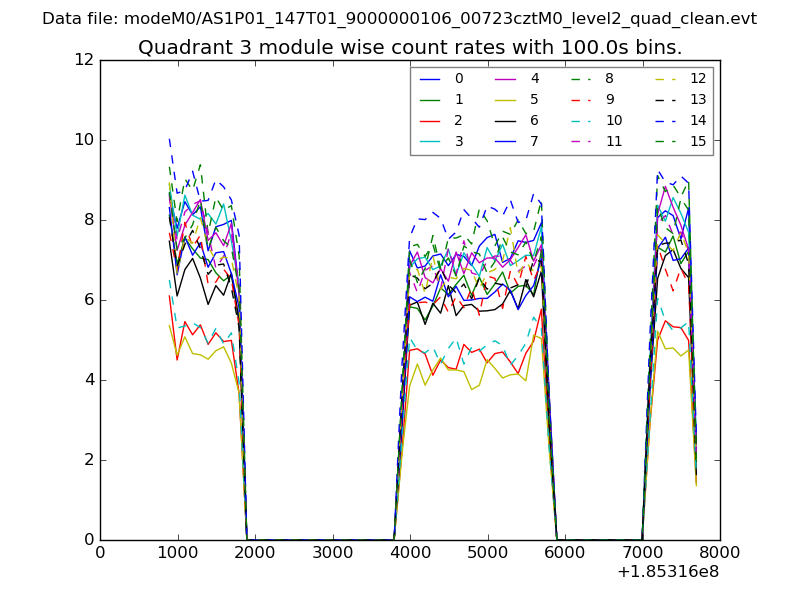
| Module-wise count rates for Quadrant C Data is divided into 100 sec bins |
 |
 |
| Module-wise count rates for Quadrant D Data is divided into 100 sec bins |
 |
 |
| Parameter | Plot |
|---|---|
| CZT HV Monitor | 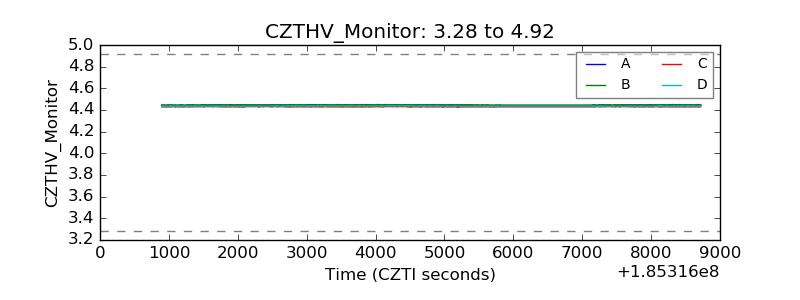 |
| D_VDD | 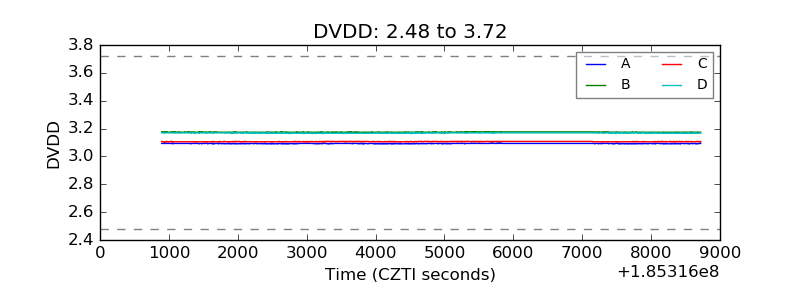 |
| Temperature 1 | 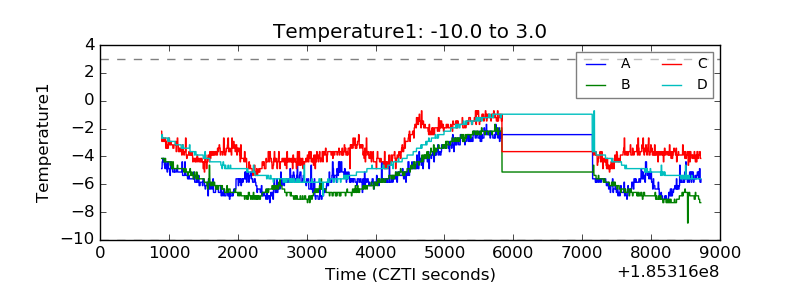 |
| Veto HV Monitor | 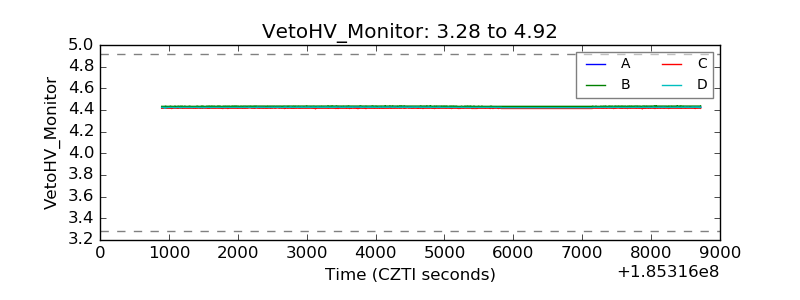 |
| Veto LLD | 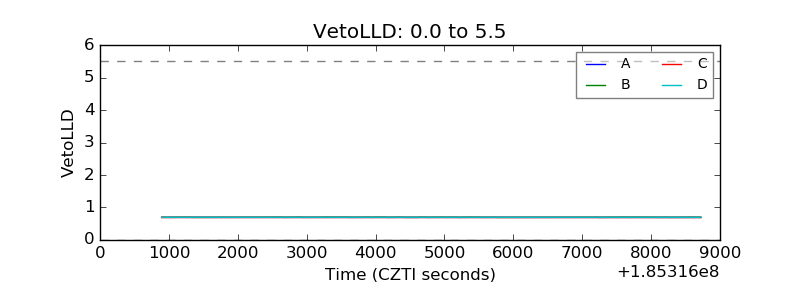 |
| Alpha Counter | 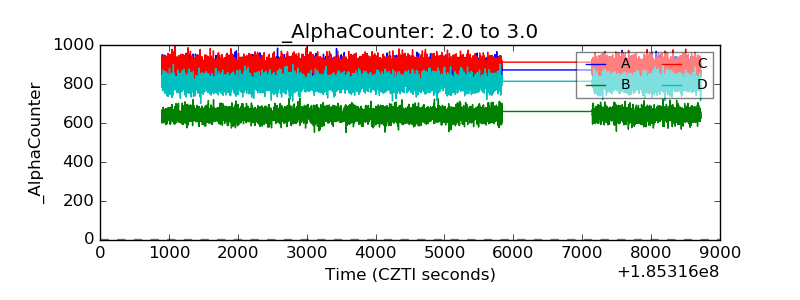 |
| _CPM_Rate | 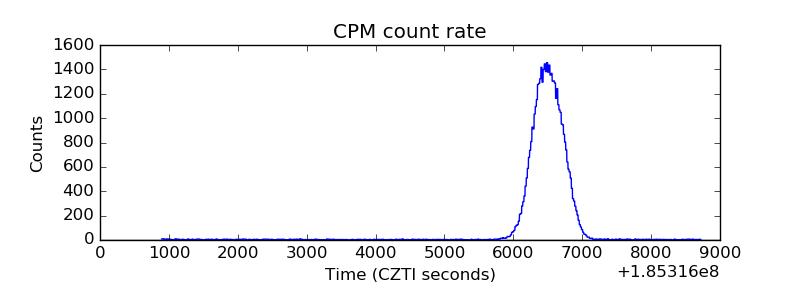 |
| CZT Counter | 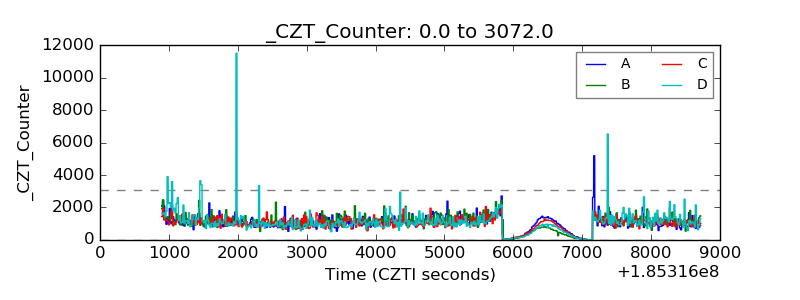 |
| +2.5 Volts monitor |  |
| +5 Volts monitor |  |
| _ROLL_ROT |  |
| _Roll_DEC | 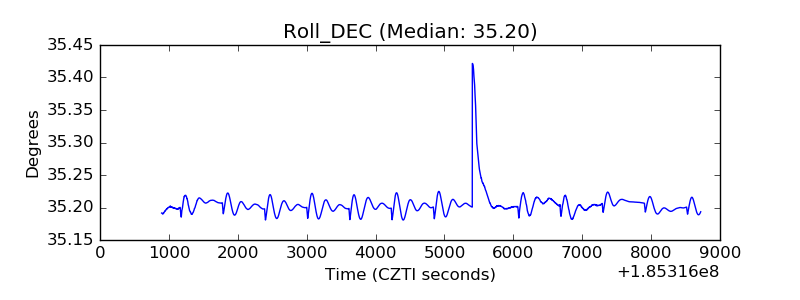 |
| _Roll_RA | 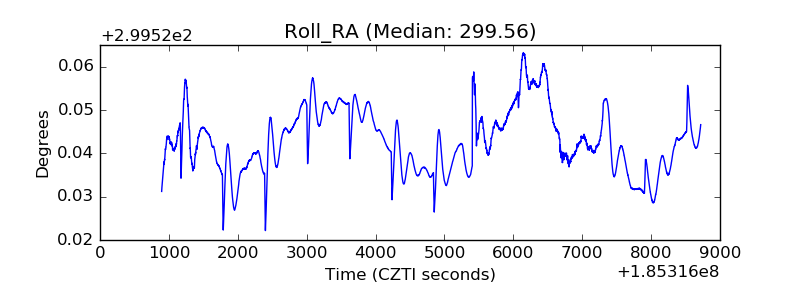 |
| Veto Counter | 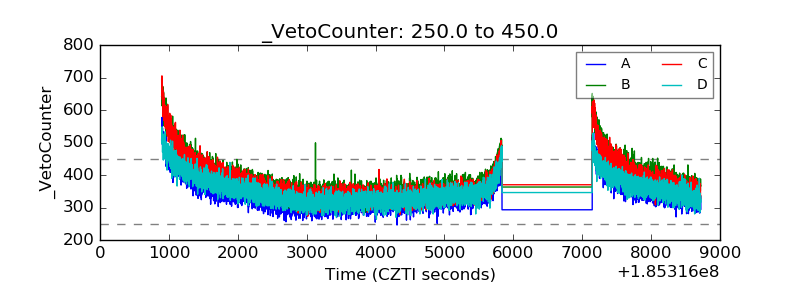 |