| Param | Original file | Final file |
|---|---|---|
| Filename | modeM0/AS1P01_147T01_9000000106_00724cztM0_level2.evt | modeM0/AS1P01_147T01_9000000106_00724cztM0_level2_quad_clean.evt |
| Size (bytes) | 657,472,320 | 40,674,240 |
| Size | 627.0 MB | 38.8 MB |
| Events in quadrant A | 4,919,062 | 234,862 |
| Events in quadrant B | 5,027,535 | 239,489 |
| Events in quadrant C | 4,698,770 | 232,772 |
| Events in quadrant D | 4,981,294 | 223,279 |
| Mode SS | |||
|---|---|---|---|
| Quadrant | BADHDUFLAG | Total packets | Discarded packets |
| A | 0 | 86 | 0 |
| B | 0 | 86 | 0 |
| C | 0 | 86 | 0 |
| D | 0 | 86 | 0 |
| Mode M0 | |||
|---|---|---|---|
| Quadrant | BADHDUFLAG | Total packets | Discarded packets |
| A | 0 | 17632 | 0 |
| B | 0 | 17970 | 0 |
| C | 0 | 17013 | 0 |
| D | 0 | 17805 | 0 |
| Quadrant | Total seconds | Saturated seconds | Saturation percentage |
|---|---|---|---|
| A | 4266 | 1 | 0.023441% |
| B | 4267 | 0 | 0.000000% |
| C | 4267 | 3 | 0.070307% |
| D | 4267 | 43 | 1.007734% |
Noise dominated data is calculated using 1-second bins in cleaned event files. If a bin has >2000 counts, and if more than 50% of those come from <1% of pixels, then it is considered to be noise-dominated and hence unusable.
| Quadrant | # 1 sec bins | Bins with >0 counts | Bins with >2000 counts | High rate bins dominated by noise | Noise dominated (total time) | Noise dominated (detector-on time) | Marked lightcurve |
|---|---|---|---|---|---|---|---|
| A | 4266 | 4266 | 79 | 79 | 1.85% | 1.85% | 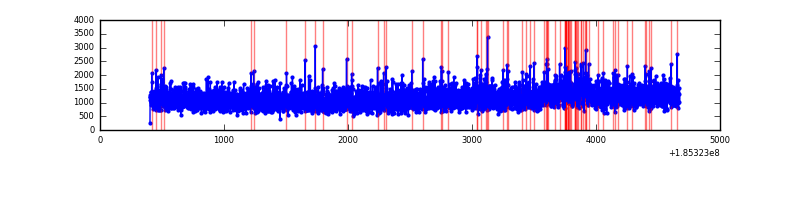 |
| B | 4267 | 4267 | 60 | 60 | 1.41% | 1.41% | 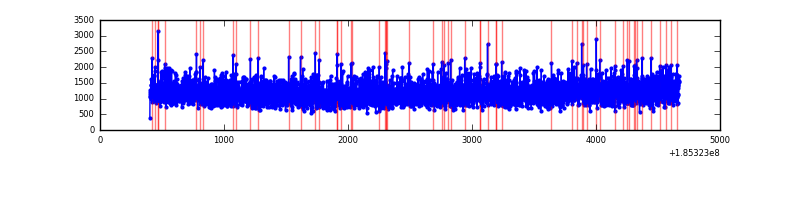 |
| C | 4267 | 4267 | 39 | 39 | 0.91% | 0.91% | 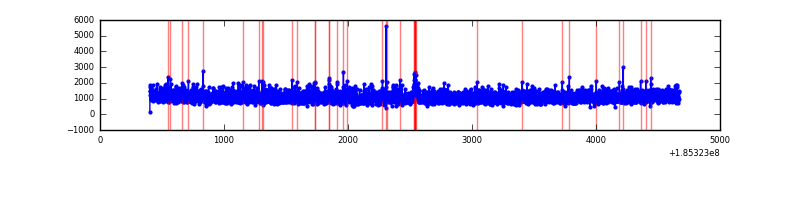 |
| D | 4267 | 4267 | 158 | 158 | 3.70% | 3.70% | 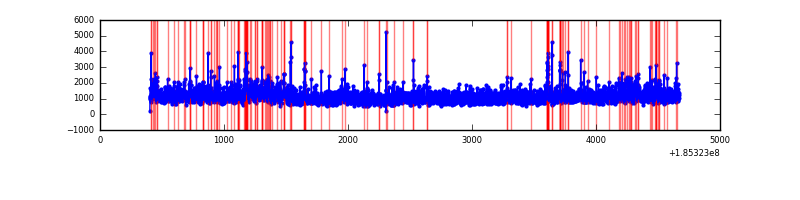 |
Top three noisy pixels from each quadrant. If the there are fewer than three noisy pixels in the level2.evt file, extra rows are filled as -1
| Pixel properties | Quadrant properties | ||||||
|---|---|---|---|---|---|---|---|
| Quadrant | DetID | PixID | Counts | Sigma | Mean | Median | Sigma |
| A | 12 | 133 | 78175 | 253.65 | 1257 | 1268 | 303.2 |
| A | 12 | 189 | 8359 | 23.39 | 1257 | 1268 | 303.2 |
| A | 13 | 8 | 6052 | 15.78 | 1257 | 1268 | 303.2 |
| B | 4 | 232 | 27047 | 83.98 | 1309 | 1319 | 306.4 |
| B | 0 | 220 | 15845 | 47.42 | 1309 | 1319 | 306.4 |
| B | 0 | 207 | 8674 | 24.01 | 1309 | 1319 | 306.4 |
| C | 9 | 52 | 30497 | 90.0 | 1179 | 1222 | 325.3 |
| C | 15 | 241 | 25205 | 73.73 | 1179 | 1222 | 325.3 |
| C | 3 | 111 | 18643 | 53.56 | 1179 | 1222 | 325.3 |
| D | 6 | 226 | 516369 | 1488.42 | 1120 | 1160 | 346.1 |
| D | 14 | 52 | 84110 | 239.64 | 1120 | 1160 | 346.1 |
| D | 9 | 52 | 53257 | 150.51 | 1120 | 1160 | 346.1 |
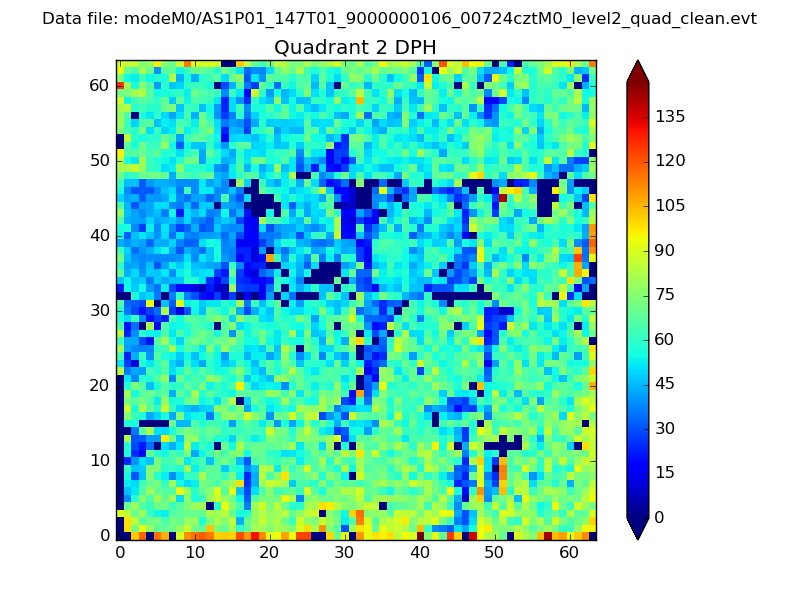
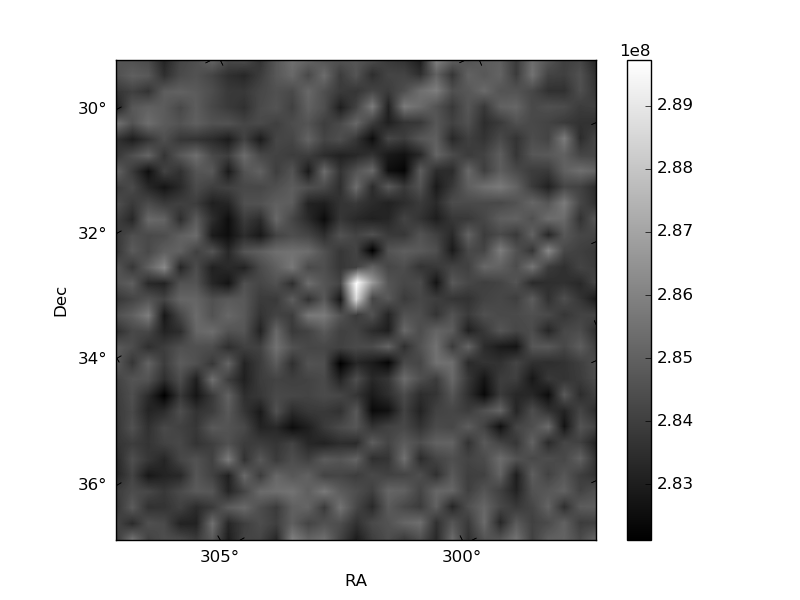
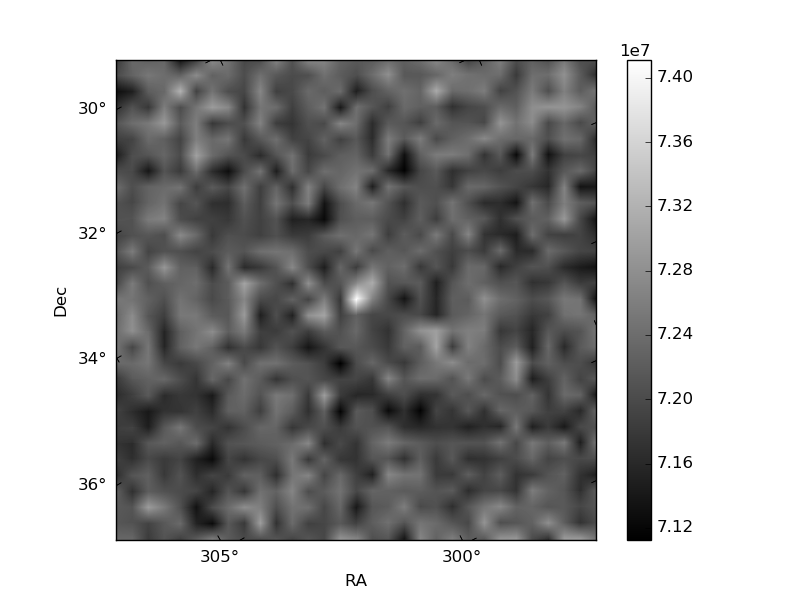
Histogram calculated using DETX and DETY for each event in the final _common_clean file
| Quadrant A | 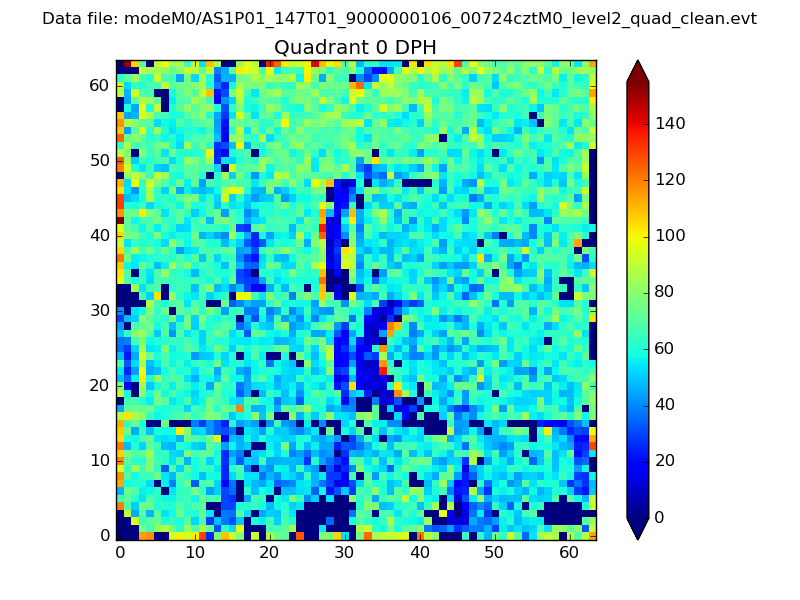 |
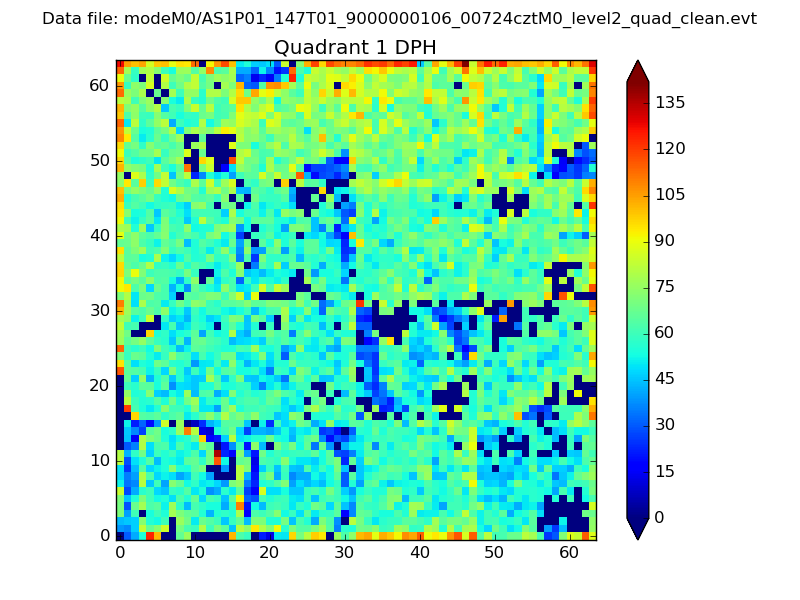 |
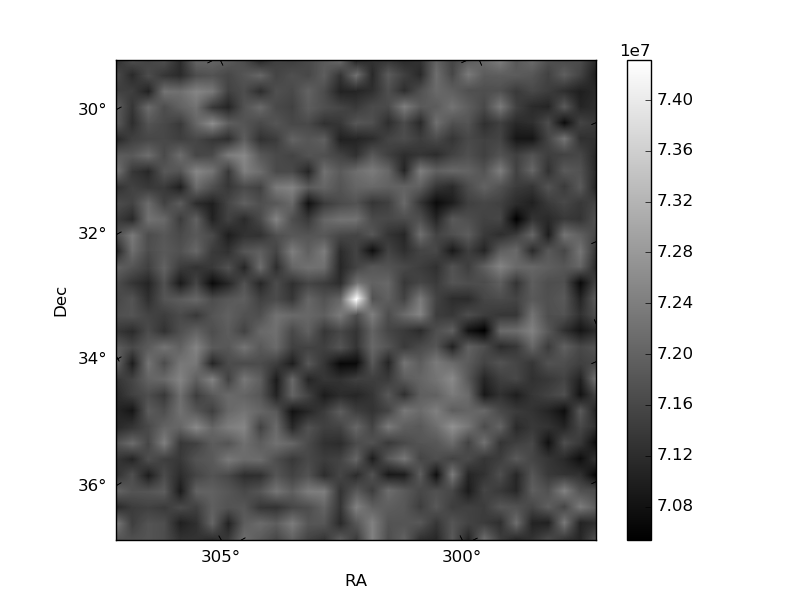
Quadrant B |
|---|---|---|---|
| Quadrant D | 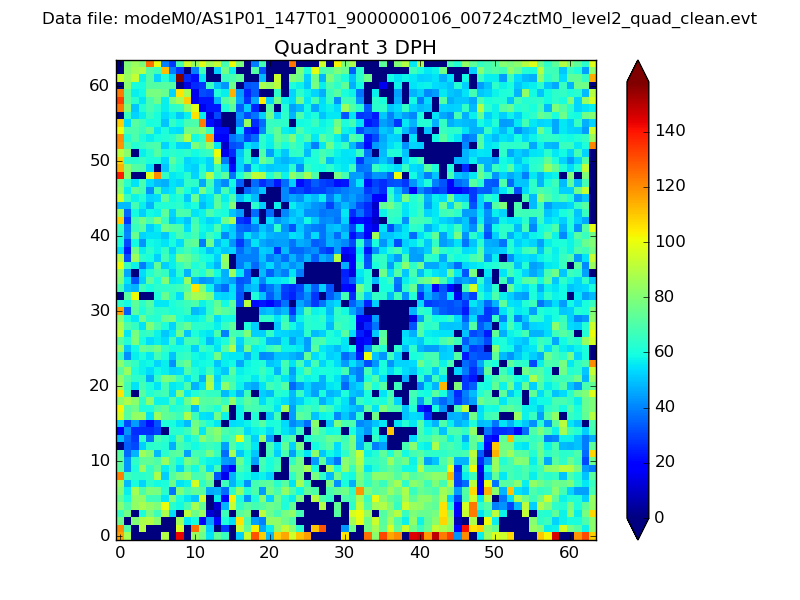 |
 |
Quadrant C |
| Plot type | Count rate plots | Images |
|---|---|---|
| Comparison with Poisson distribution Blue bars denote a histogram of data divided into 1 sec bins. Red curve is a Poisson curve with rate = median count rate of data. |
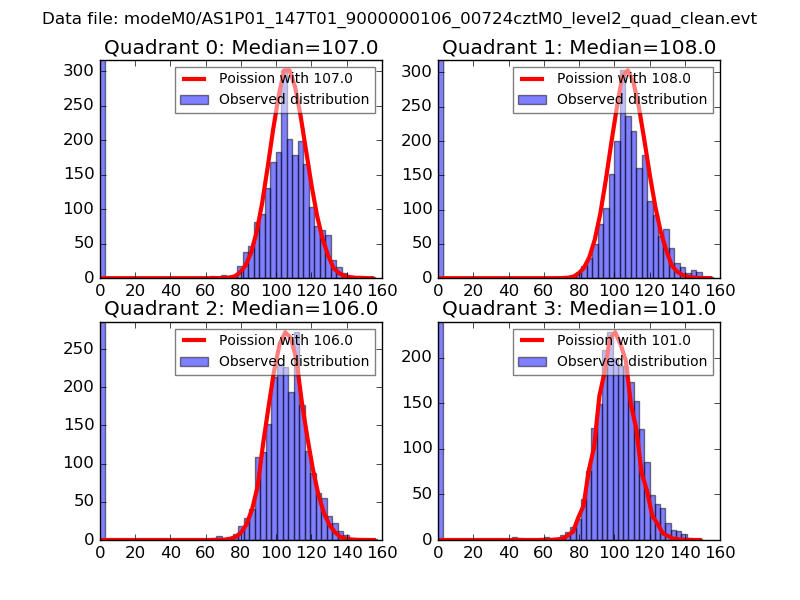 |
 |
| Quadrant-wise count rates Data is divided into 100 sec bins |
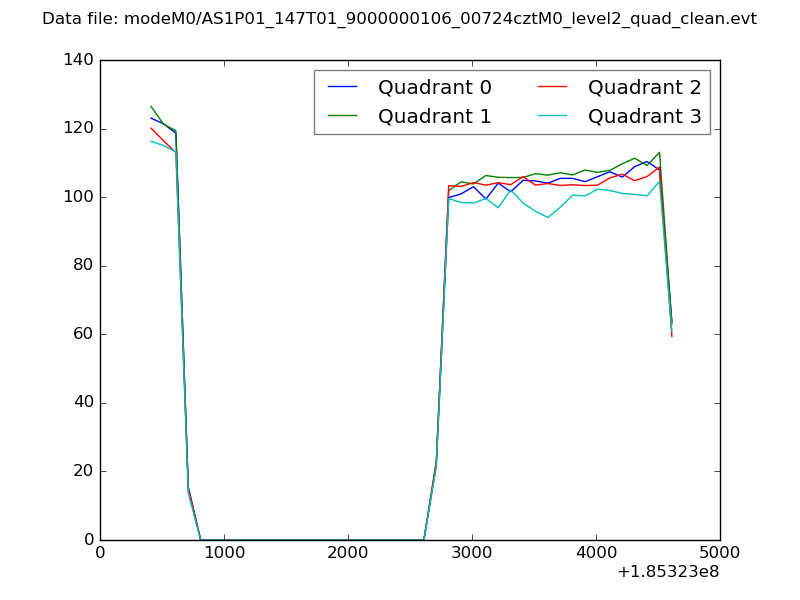 |
|
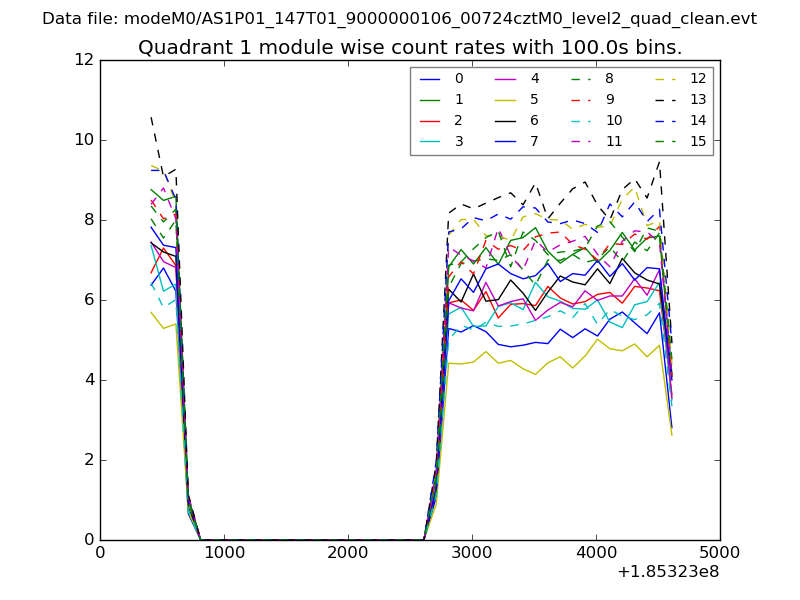
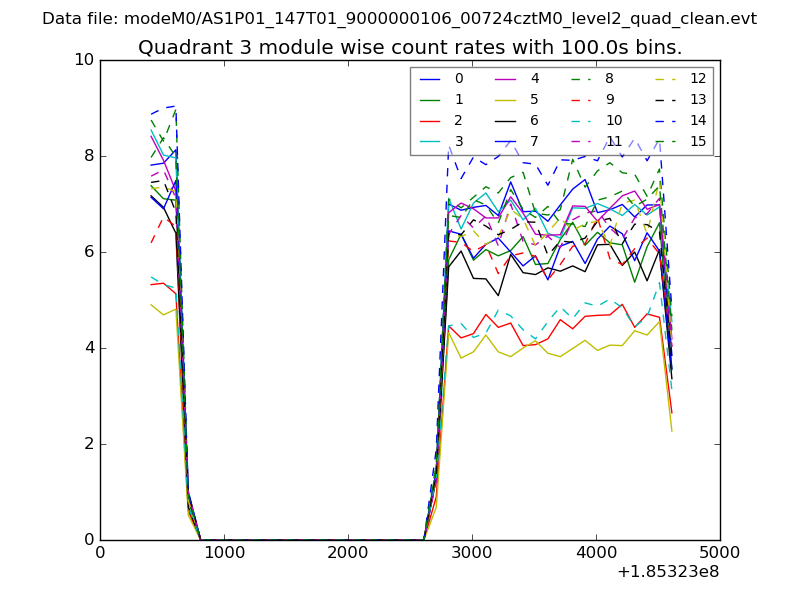
| Module-wise count rates for Quadrant A Data is divided into 100 sec bins |
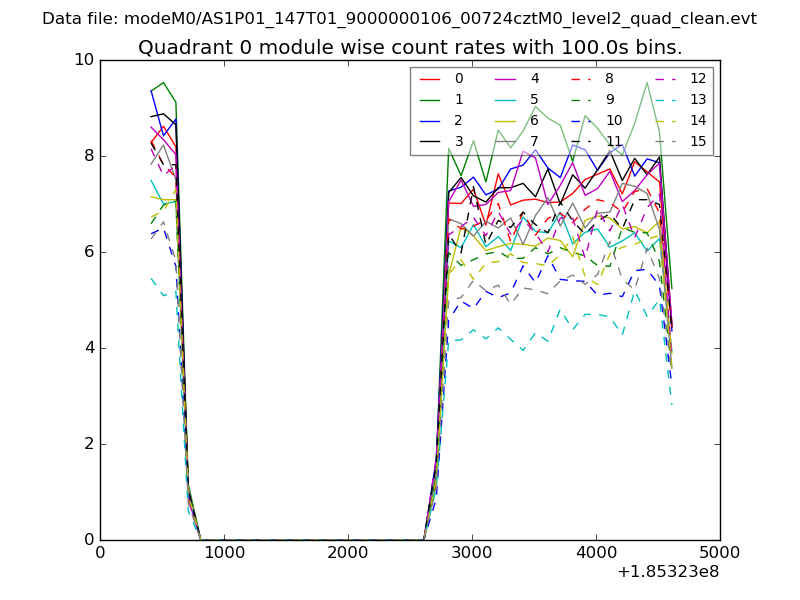 |
 |
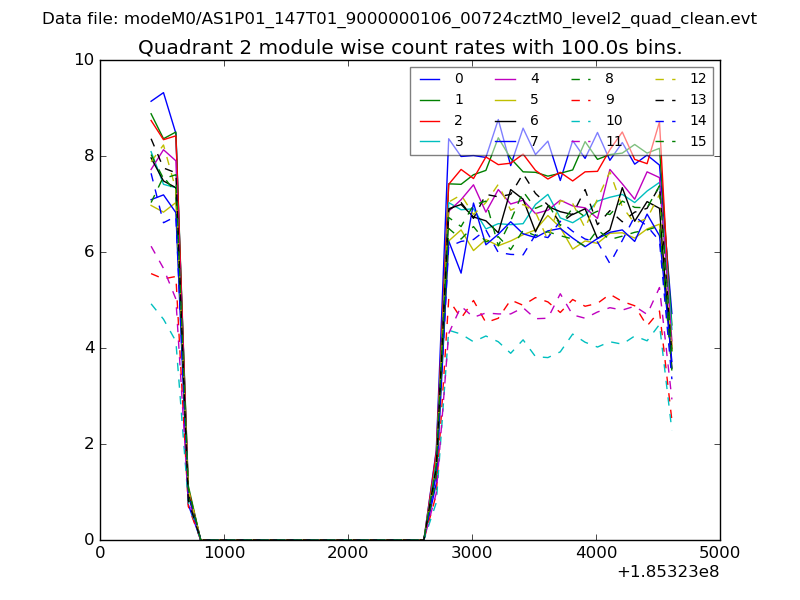
| Module-wise count rates for Quadrant B Data is divided into 100 sec bins |
 |
 |
| Module-wise count rates for Quadrant C Data is divided into 100 sec bins |
 |
 |
| Module-wise count rates for Quadrant D Data is divided into 100 sec bins |
 |
 |
| Parameter | Plot |
|---|---|
| CZT HV Monitor | 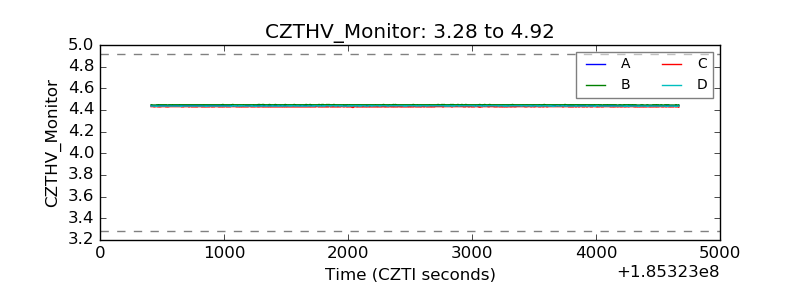 |
| D_VDD | 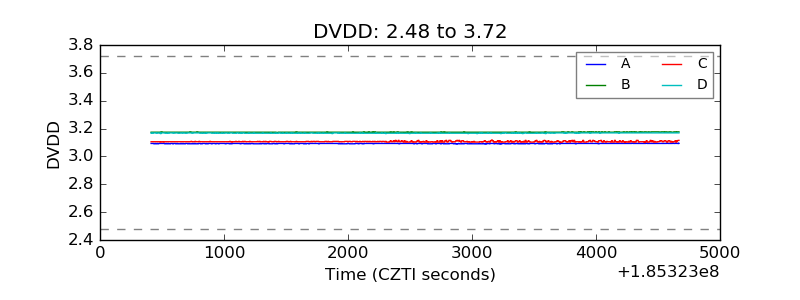 |
| Temperature 1 | 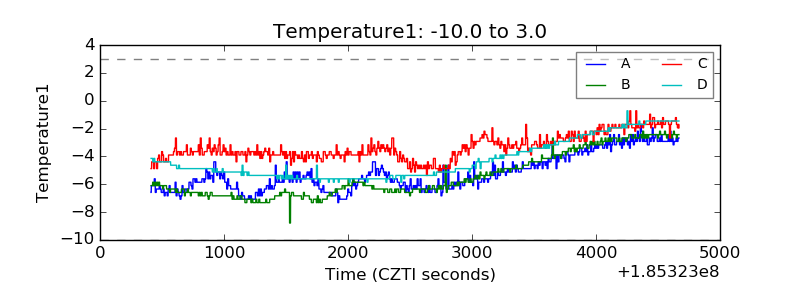 |
| Veto HV Monitor | 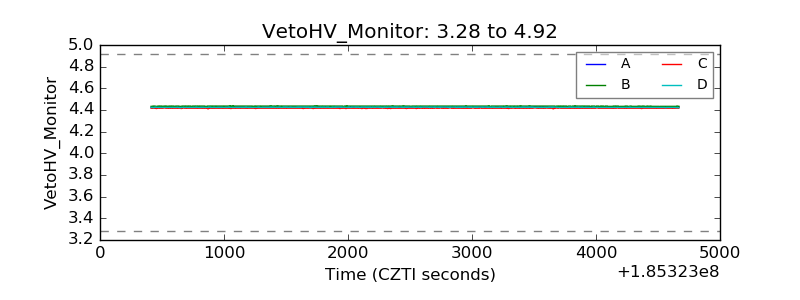 |
| Veto LLD | 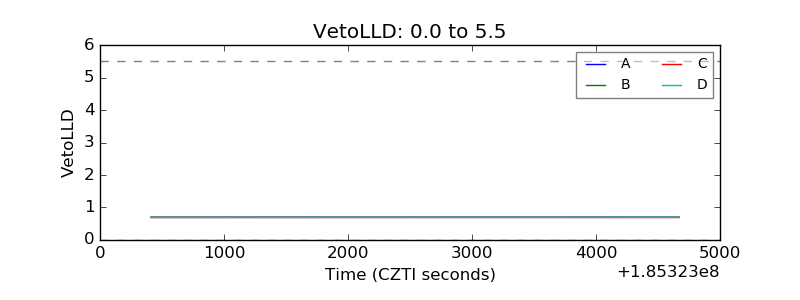 |
| Alpha Counter | 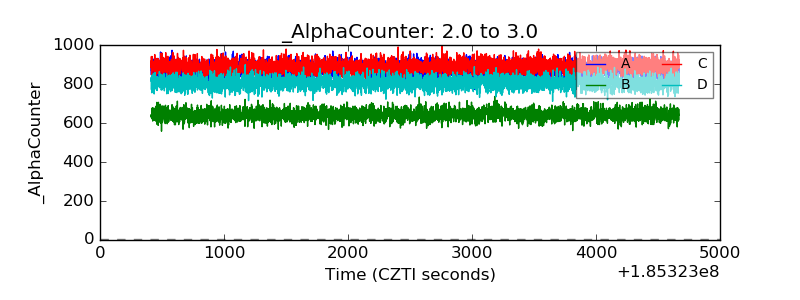 |
| _CPM_Rate | 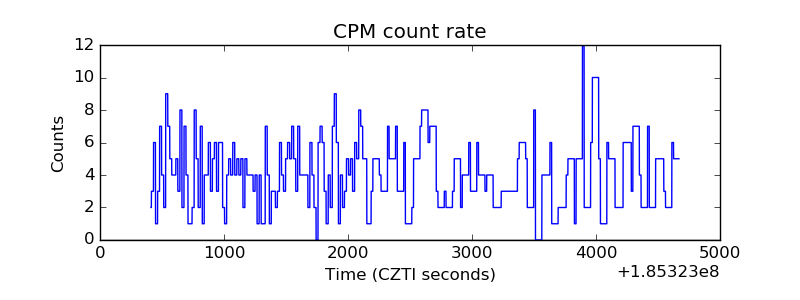 |
| CZT Counter | 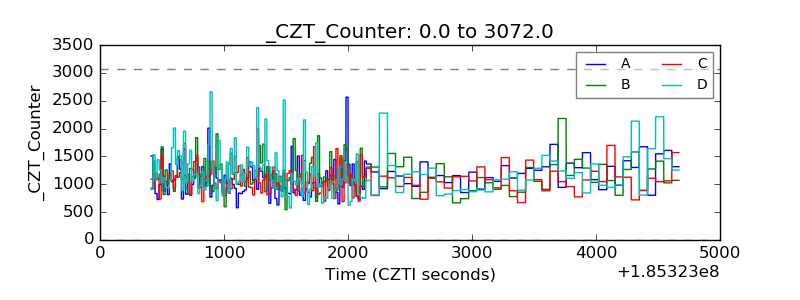 |
| +2.5 Volts monitor |  |
| +5 Volts monitor |  |
| _ROLL_ROT | 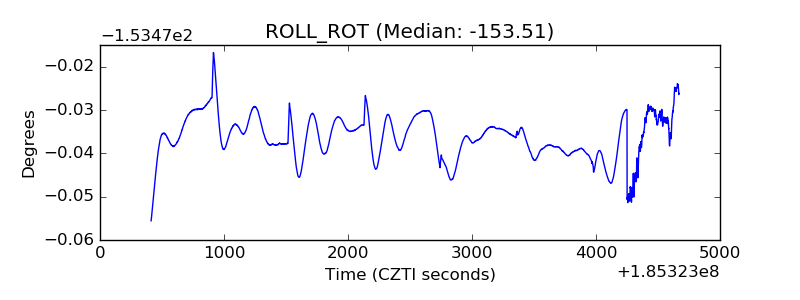 |
| _Roll_DEC | 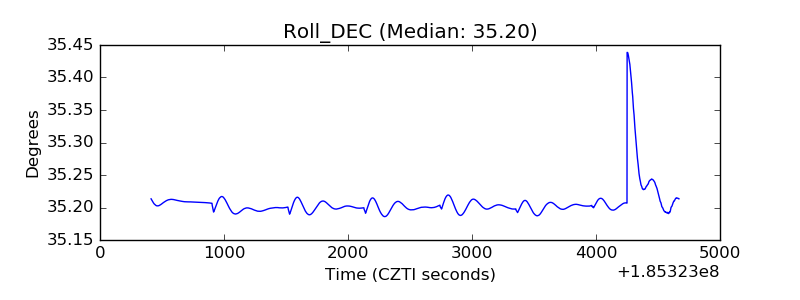 |
| _Roll_RA | 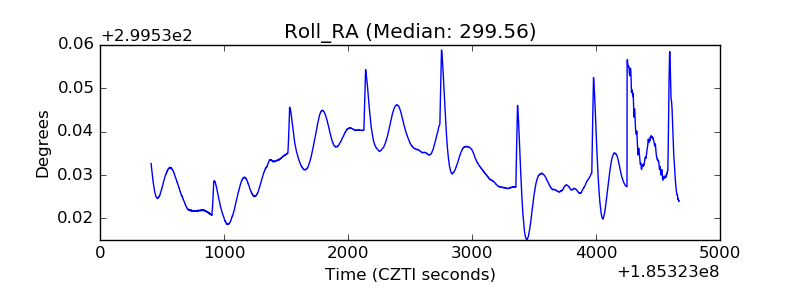 |
| Veto Counter | 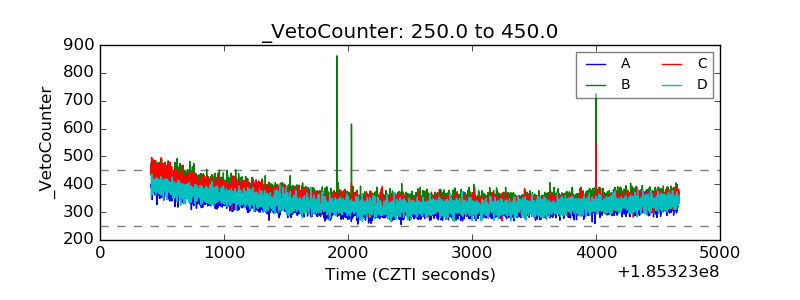 |