| Param | Original file | Final file |
|---|---|---|
| Filename | modeM0/AS1P01_147T01_9000000106_00725cztM0_level2.evt | modeM0/AS1P01_147T01_9000000106_00725cztM0_level2_quad_clean.evt |
| Size (bytes) | 1,075,507,200 | 53,588,160 |
| Size | 1.0 GB | 51.1 MB |
| Events in quadrant A | 7,663,320 | 305,131 |
| Events in quadrant B | 7,983,551 | 310,916 |
| Events in quadrant C | 7,185,841 | 305,050 |
| Events in quadrant D | 9,327,053 | 266,680 |
| Mode M9 | |||
|---|---|---|---|
| Quadrant | BADHDUFLAG | Total packets | Discarded packets |
| A | 0 | 11 | 0 |
| B | 0 | 11 | 0 |
| C | 0 | 11 | 0 |
| D | 0 | 11 | 0 |
| Mode SS | |||
|---|---|---|---|
| Quadrant | BADHDUFLAG | Total packets | Discarded packets |
| A | 0 | 126 | 0 |
| B | 0 | 126 | 0 |
| C | 0 | 126 | 0 |
| D | 0 | 126 | 0 |
| Mode M0 | |||
|---|---|---|---|
| Quadrant | BADHDUFLAG | Total packets | Discarded packets |
| A | 0 | 27180 | 1 |
| B | 0 | 28114 | 1 |
| C | 0 | 25796 | 2 |
| D | 0 | 32225 | 1 |
| Quadrant | Total seconds | Saturated seconds | Saturation percentage |
|---|---|---|---|
| A | 6222 | 94 | 1.510768% |
| B | 6222 | 55 | 0.883960% |
| C | 6221 | 16 | 0.257193% |
| D | 6221 | 885 | 14.226009% |
Noise dominated data is calculated using 1-second bins in cleaned event files. If a bin has >2000 counts, and if more than 50% of those come from <1% of pixels, then it is considered to be noise-dominated and hence unusable.
| Quadrant | # 1 sec bins | Bins with >0 counts | Bins with >2000 counts | High rate bins dominated by noise | Noise dominated (total time) | Noise dominated (detector-on time) | Marked lightcurve |
|---|---|---|---|---|---|---|---|
| A | 7257 | 6223 | 361 | 361 | 4.97% | 5.80% | 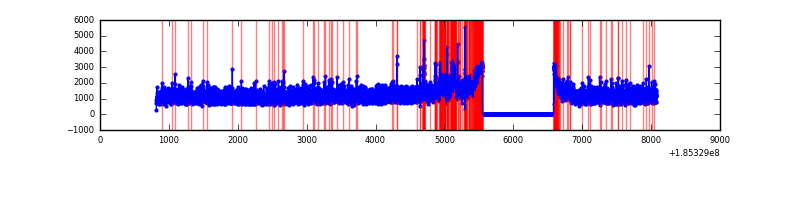 |
| B | 7257 | 6223 | 285 | 285 | 3.93% | 4.58% | 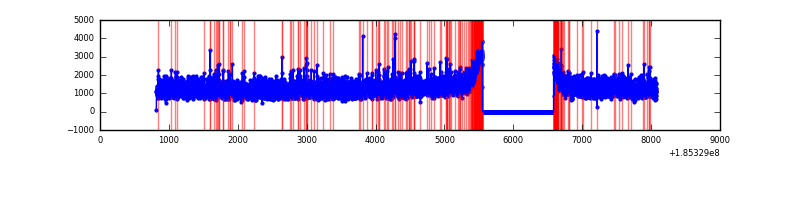 |
| C | 7256 | 6222 | 168 | 168 | 2.32% | 2.70% | 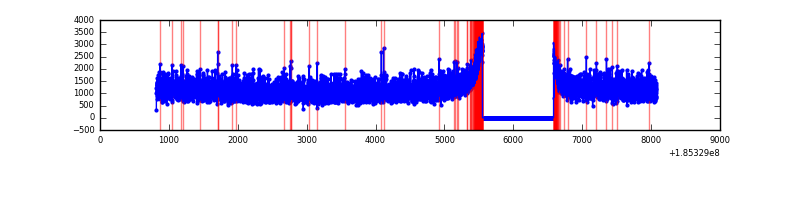 |
| D | 7256 | 6222 | 1308 | 1308 | 18.03% | 21.02% | 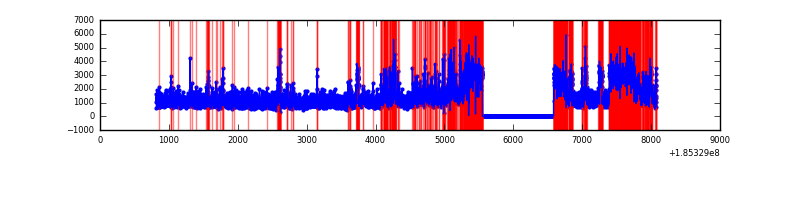 |
Top three noisy pixels from each quadrant. If the there are fewer than three noisy pixels in the level2.evt file, extra rows are filled as -1
| Pixel properties | Quadrant properties | ||||||
|---|---|---|---|---|---|---|---|
| Quadrant | DetID | PixID | Counts | Sigma | Mean | Median | Sigma |
| A | 15 | 171 | 296971 | 639.95 | 1905 | 1921 | 461.0 |
| A | 10 | 230 | 36191 | 74.33 | 1905 | 1921 | 461.0 |
| A | 15 | 69 | 11710 | 21.23 | 1905 | 1921 | 461.0 |
| B | 7 | 221 | 206055 | 430.4 | 2003 | 2016 | 474.1 |
| B | 14 | 50 | 91085 | 187.88 | 2003 | 2016 | 474.1 |
| B | 0 | 220 | 43846 | 88.24 | 2003 | 2016 | 474.1 |
| C | 15 | 241 | 41648 | 78.49 | 1809 | 1873 | 506.8 |
| C | 8 | 208 | 26940 | 49.46 | 1809 | 1873 | 506.8 |
| C | 3 | 111 | 26334 | 48.27 | 1809 | 1873 | 506.8 |
| D | 9 | 52 | 2525093 | 5105.81 | 1594 | 1653 | 494.2 |
| D | 6 | 226 | 651003 | 1313.86 | 1594 | 1653 | 494.2 |
| D | 10 | 85 | 108378 | 215.94 | 1594 | 1653 | 494.2 |
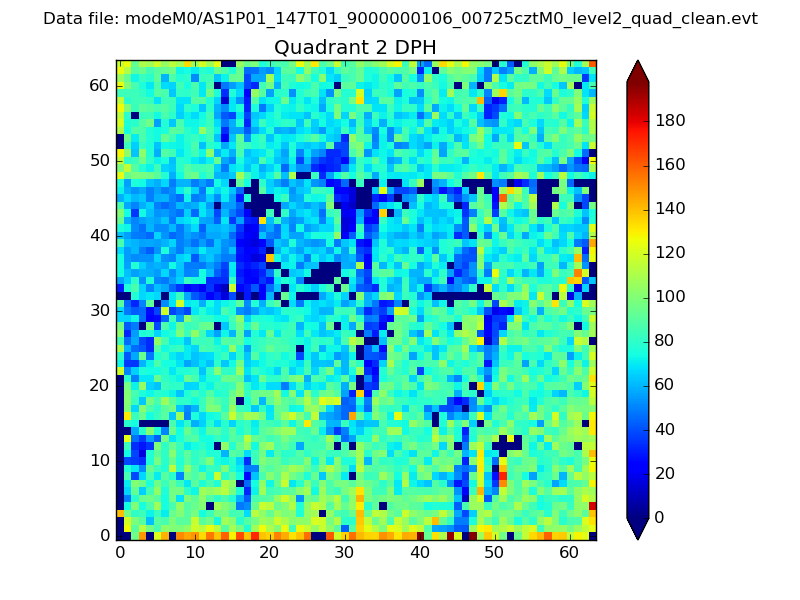
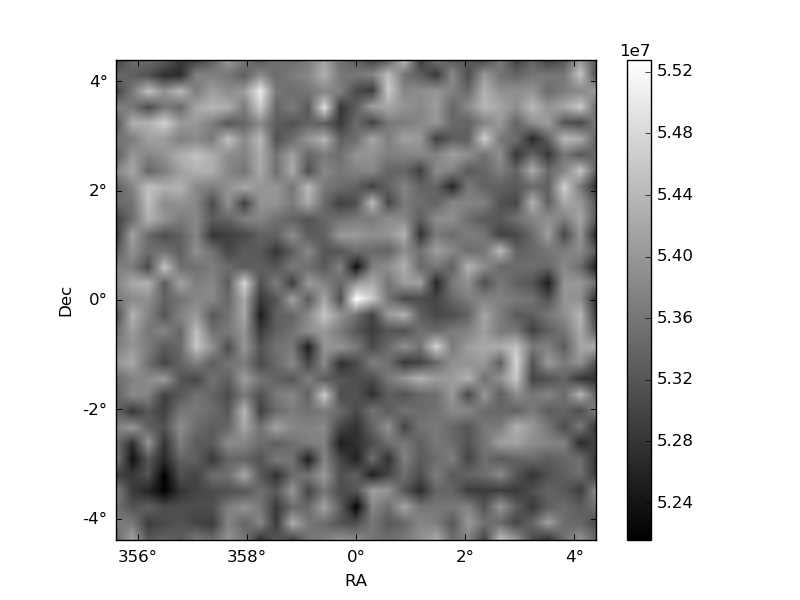
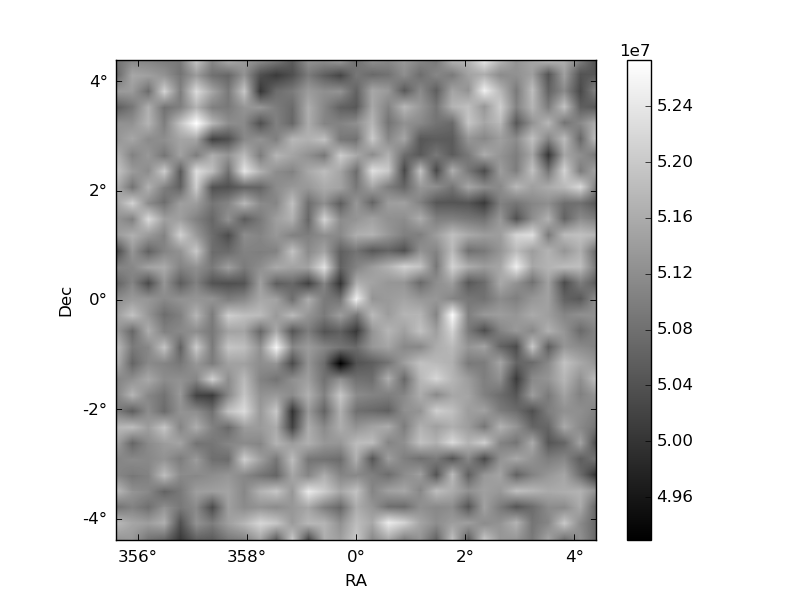
Histogram calculated using DETX and DETY for each event in the final _common_clean file
| Quadrant A | 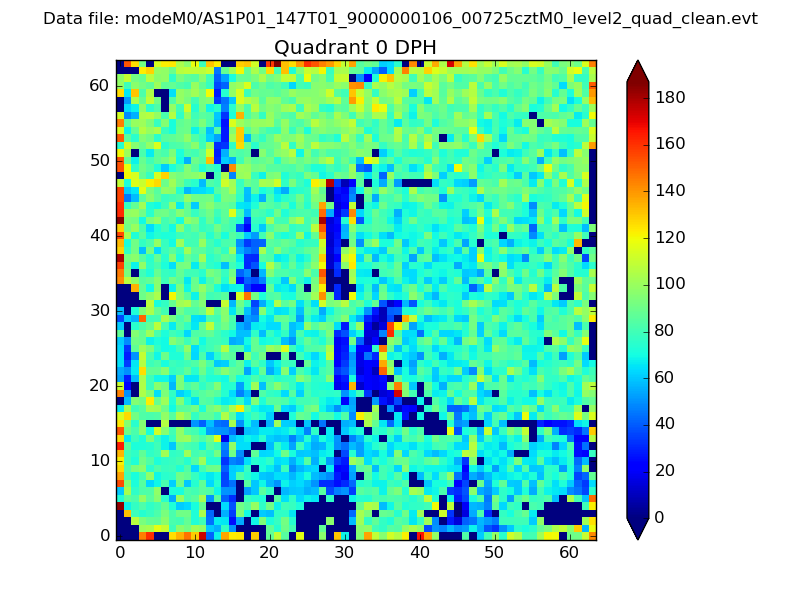 |
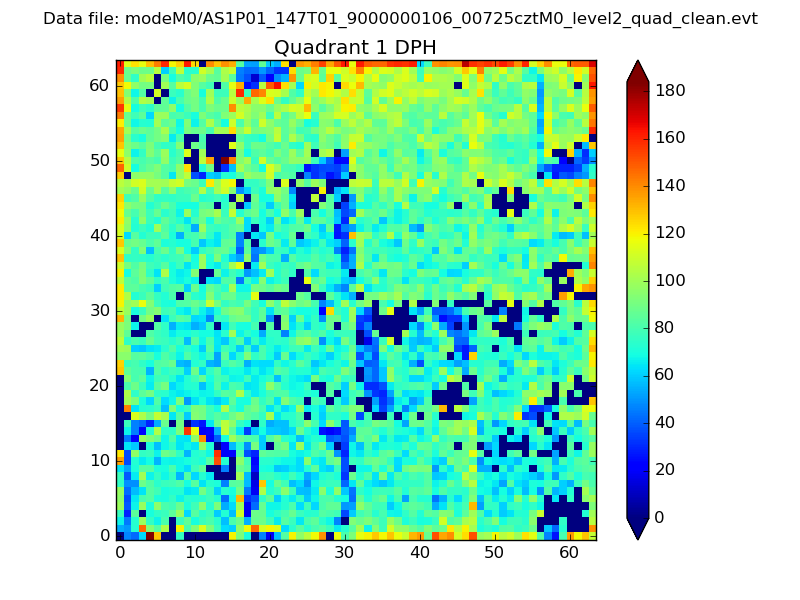 |
Quadrant B |
|---|---|---|---|
| Quadrant D | 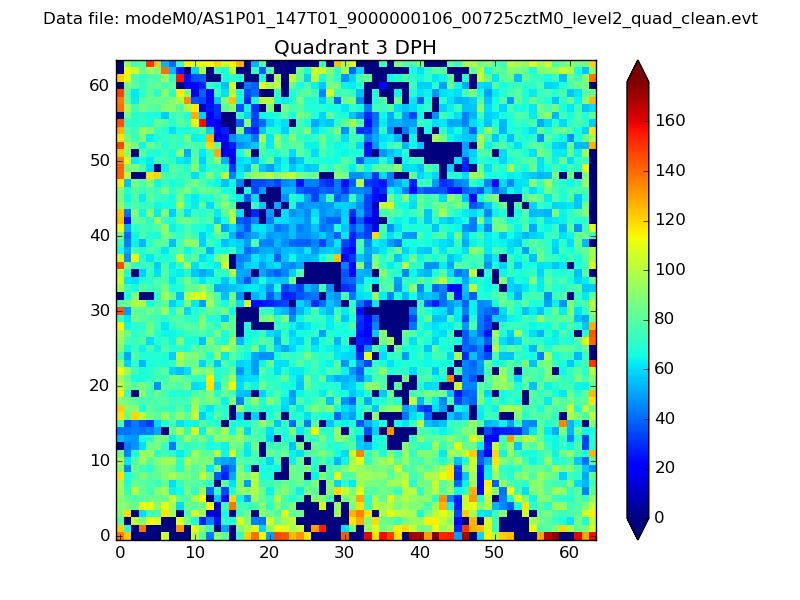 |
 |
Quadrant C |
| Plot type | Count rate plots | Images |
|---|---|---|
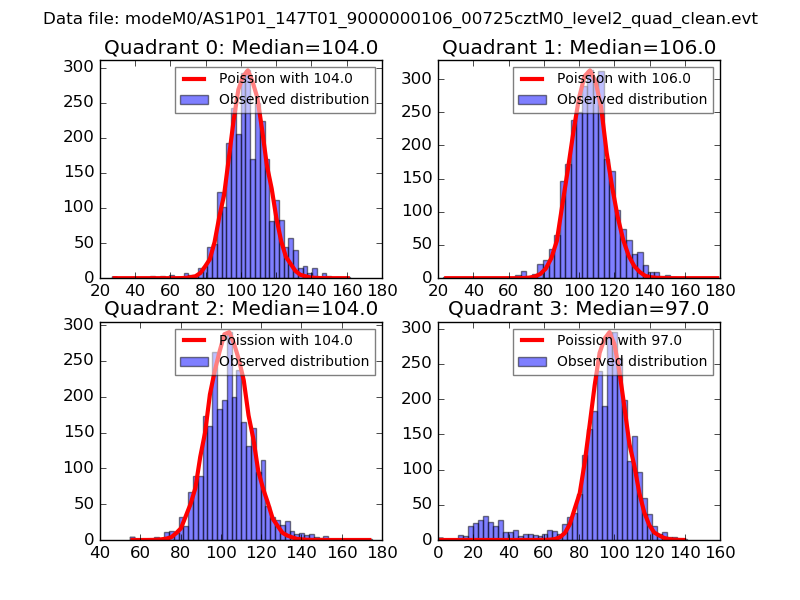
| Comparison with Poisson distribution Blue bars denote a histogram of data divided into 1 sec bins. Red curve is a Poisson curve with rate = median count rate of data. |
 |
 |
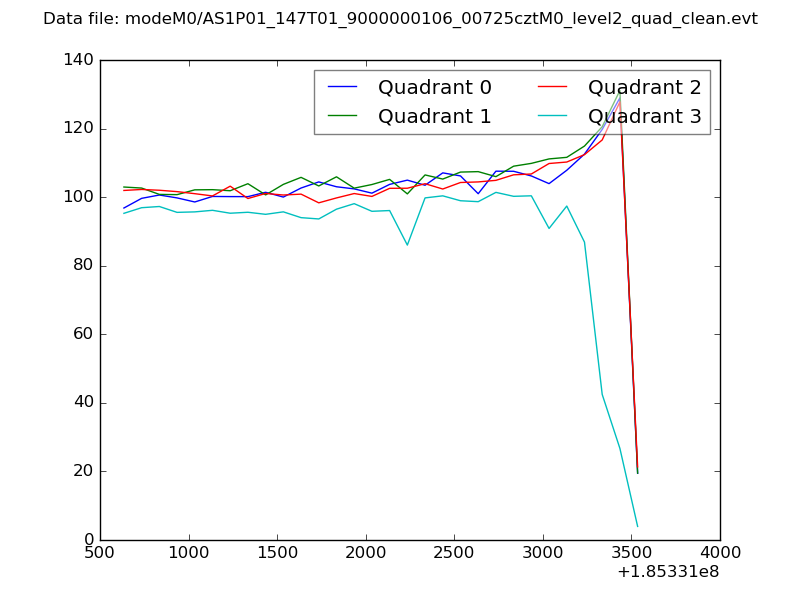
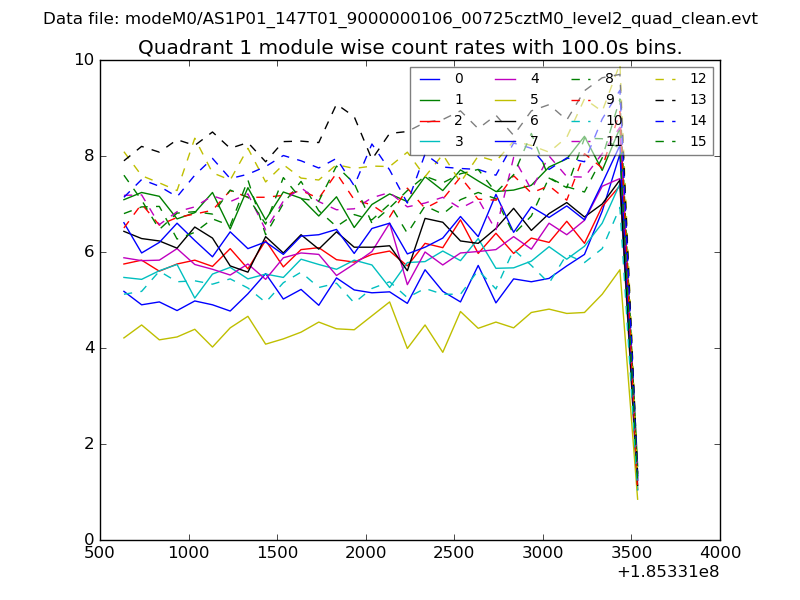
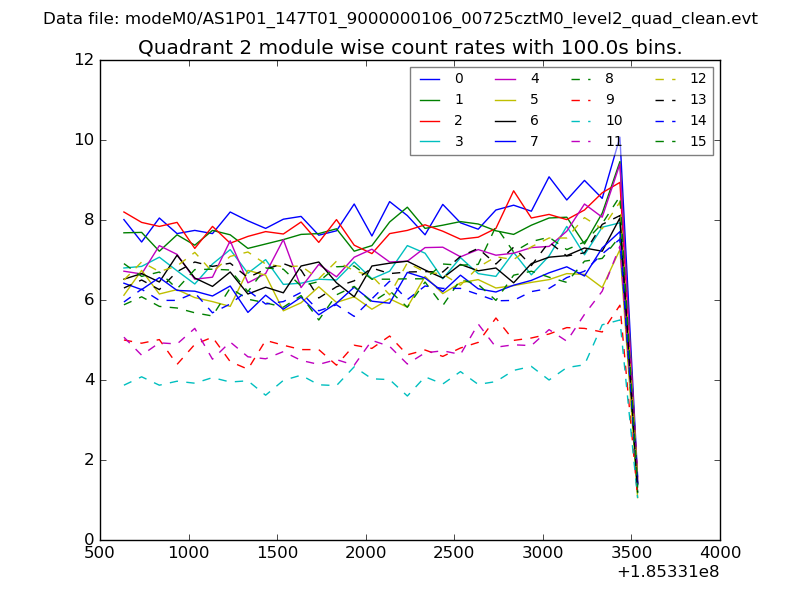
| Quadrant-wise count rates Data is divided into 100 sec bins |
 |
|
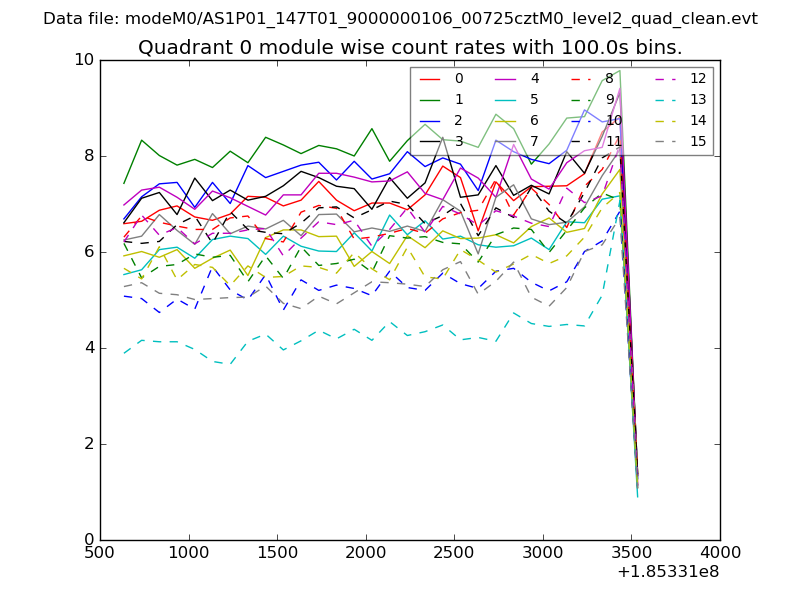
| Module-wise count rates for Quadrant A Data is divided into 100 sec bins |
 |
 |
| Module-wise count rates for Quadrant B Data is divided into 100 sec bins |
 |
 |
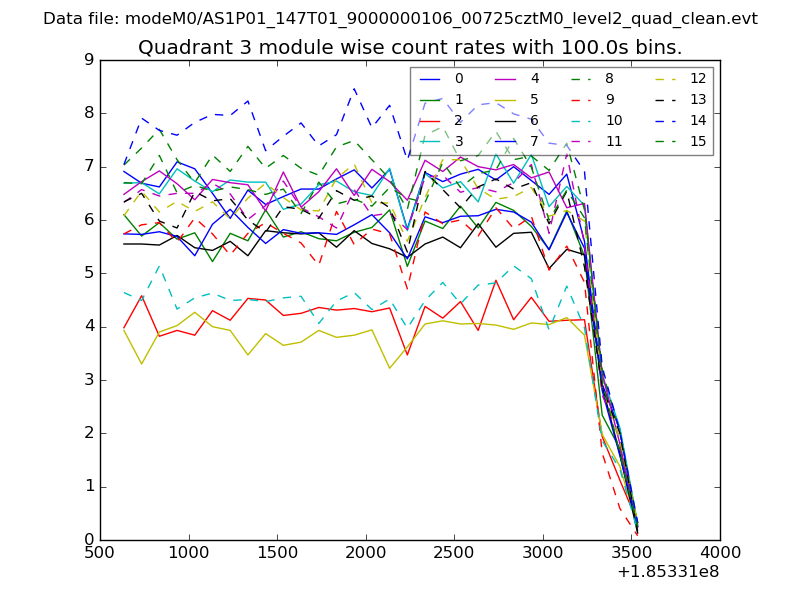
| Module-wise count rates for Quadrant C Data is divided into 100 sec bins |
 |
 |
| Module-wise count rates for Quadrant D Data is divided into 100 sec bins |
 |
 |
| Parameter | Plot |
|---|---|
| CZT HV Monitor | 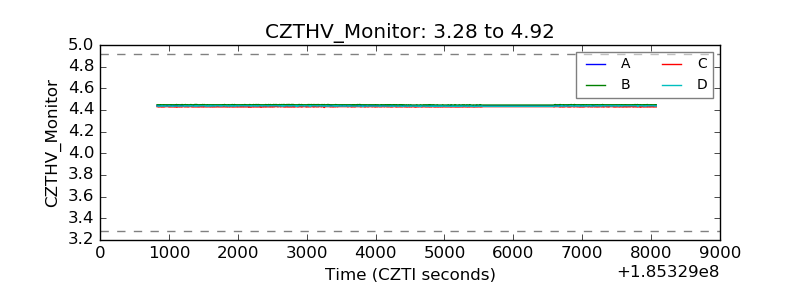 |
| D_VDD | 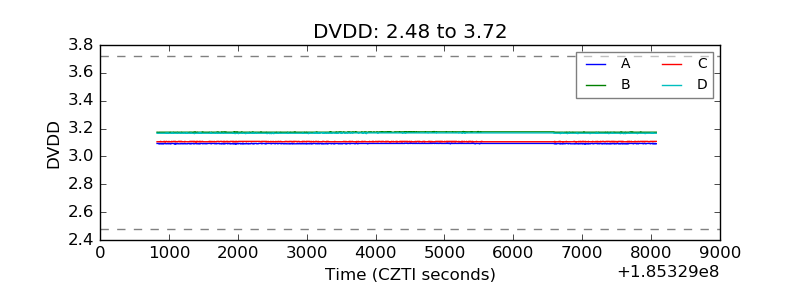 |
| Temperature 1 | 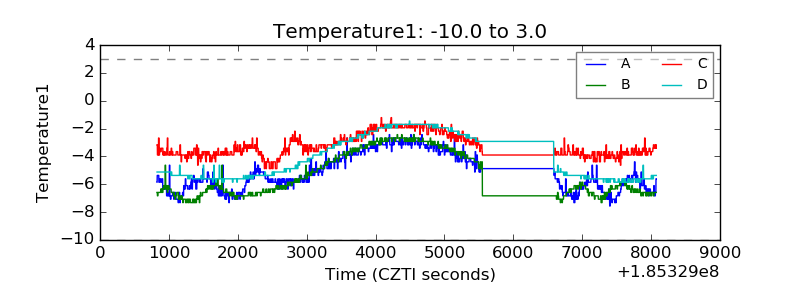 |
| Veto HV Monitor | 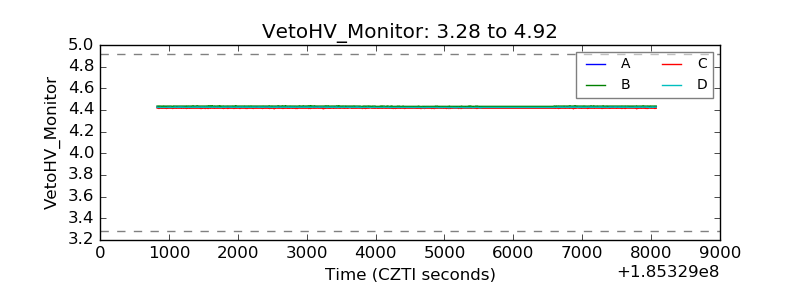 |
| Veto LLD | 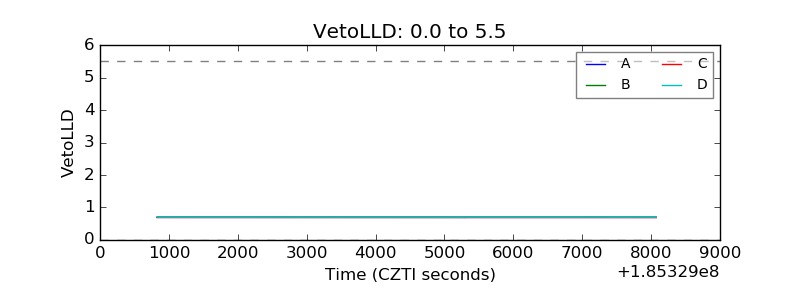 |
| Alpha Counter | 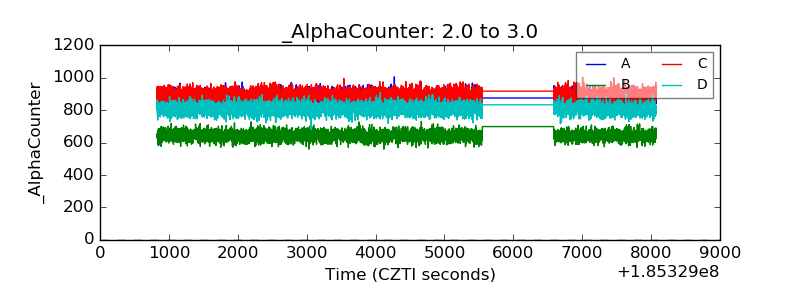 |
| _CPM_Rate | 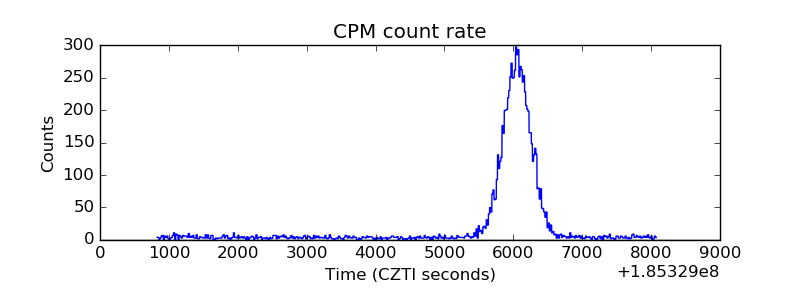 |
| CZT Counter | 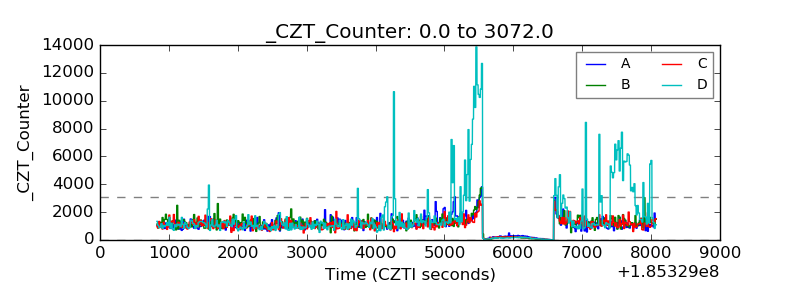 |
| +2.5 Volts monitor | 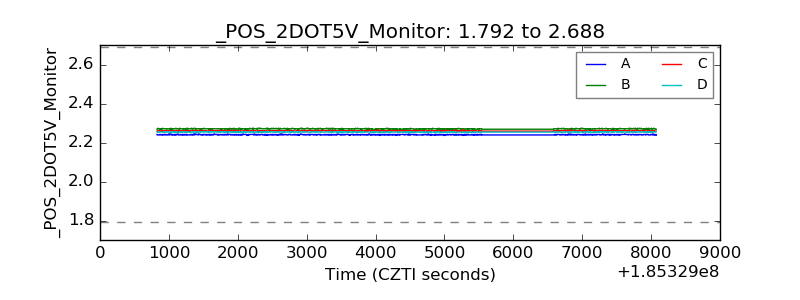 |
| +5 Volts monitor |  |
| _ROLL_ROT | 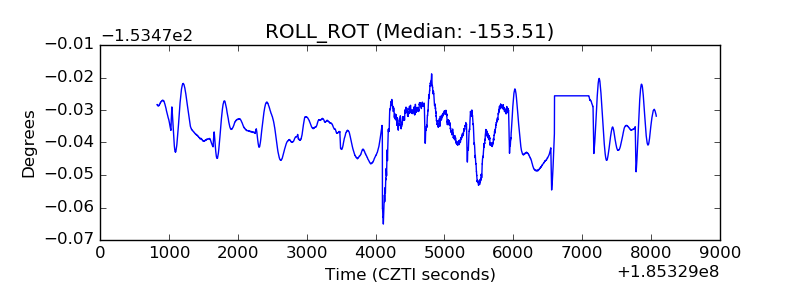 |
| _Roll_DEC | 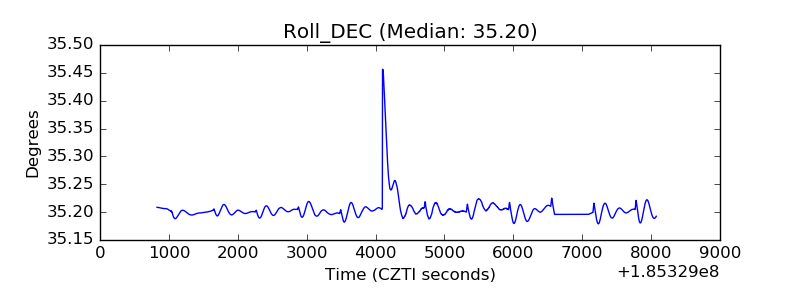 |
| _Roll_RA | 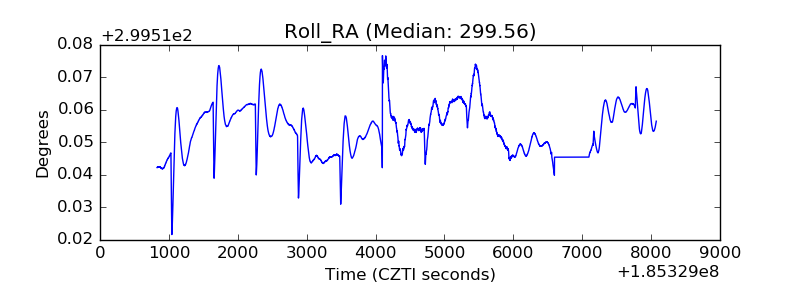 |
| Veto Counter | 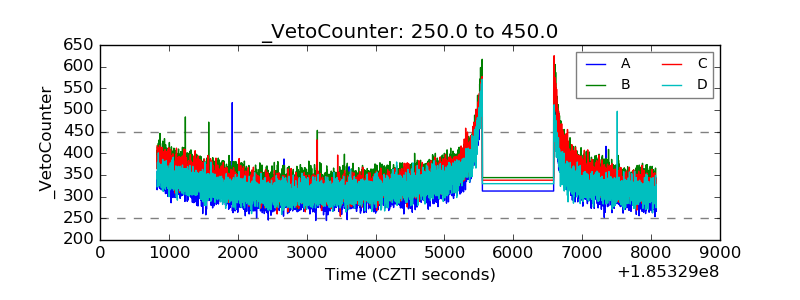 |