| Param | Original file | Final file |
|---|---|---|
| Filename | modeM0/AS1P01_147T01_9000000106_00726cztM0_level2.evt | modeM0/AS1P01_147T01_9000000106_00726cztM0_level2_quad_clean.evt |
| Size (bytes) | 638,409,600 | 42,223,680 |
| Size | 608.8 MB | 40.3 MB |
| Events in quadrant A | 4,506,819 | 253,193 |
| Events in quadrant B | 4,705,850 | 255,780 |
| Events in quadrant C | 4,160,706 | 252,615 |
| Events in quadrant D | 5,698,842 | 239,531 |
| Mode SS | |||
|---|---|---|---|
| Quadrant | BADHDUFLAG | Total packets | Discarded packets |
| A | 0 | 78 | 0 |
| B | 0 | 78 | 0 |
| C | 0 | 78 | 0 |
| D | 0 | 78 | 0 |
| Mode M0 | |||
|---|---|---|---|
| Quadrant | BADHDUFLAG | Total packets | Discarded packets |
| A | 0 | 16152 | 0 |
| B | 0 | 16772 | 0 |
| C | 0 | 15160 | 0 |
| D | 0 | 19777 | 0 |
| Quadrant | Total seconds | Saturated seconds | Saturation percentage |
|---|---|---|---|
| A | 3924 | 3 | 0.076453% |
| B | 3924 | 7 | 0.178389% |
| C | 3925 | 0 | 0.000000% |
| D | 3925 | 511 | 13.019108% |
Noise dominated data is calculated using 1-second bins in cleaned event files. If a bin has >2000 counts, and if more than 50% of those come from <1% of pixels, then it is considered to be noise-dominated and hence unusable.
| Quadrant | # 1 sec bins | Bins with >0 counts | Bins with >2000 counts | High rate bins dominated by noise | Noise dominated (total time) | Noise dominated (detector-on time) | Marked lightcurve |
|---|---|---|---|---|---|---|---|
| A | 3924 | 3924 | 55 | 55 | 1.40% | 1.40% | 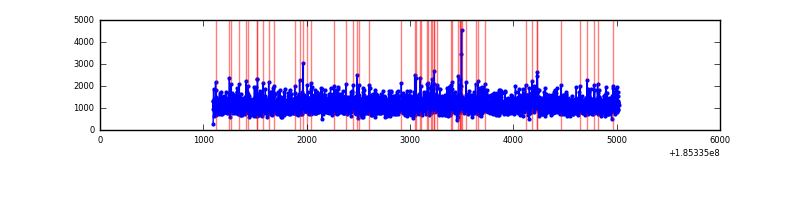 |
| B | 3924 | 3924 | 62 | 62 | 1.58% | 1.58% | 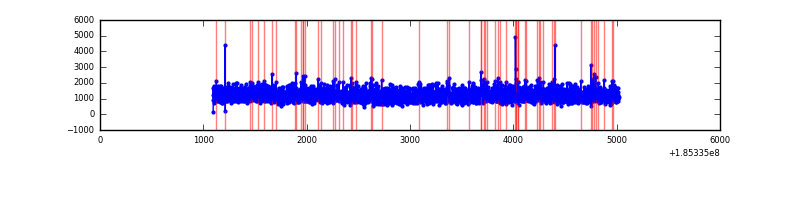 |
| C | 3925 | 3925 | 18 | 18 | 0.46% | 0.46% | 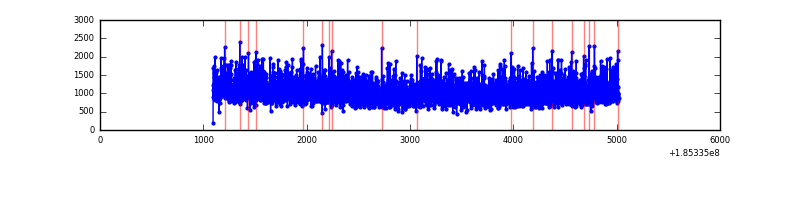 |
| D | 3925 | 3925 | 712 | 712 | 18.14% | 18.14% | 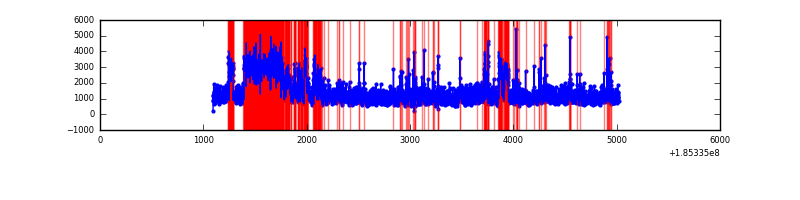 |
Top three noisy pixels from each quadrant. If the there are fewer than three noisy pixels in the level2.evt file, extra rows are filled as -1
| Pixel properties | Quadrant properties | ||||||
|---|---|---|---|---|---|---|---|
| Quadrant | DetID | PixID | Counts | Sigma | Mean | Median | Sigma |
| A | 15 | 171 | 87125 | 308.0 | 1147 | 1157 | 279.1 |
| A | 13 | 8 | 14265 | 46.96 | 1147 | 1157 | 279.1 |
| A | 11 | 79 | 5048 | 13.94 | 1147 | 1157 | 279.1 |
| B | 7 | 221 | 163254 | 577.64 | 1177 | 1187 | 280.6 |
| B | 0 | 220 | 27635 | 94.27 | 1177 | 1187 | 280.6 |
| B | 3 | 204 | 18169 | 60.53 | 1177 | 1187 | 280.6 |
| C | 15 | 241 | 24861 | 81.34 | 1049 | 1085 | 292.3 |
| C | 3 | 111 | 15967 | 50.91 | 1049 | 1085 | 292.3 |
| C | 3 | 79 | 8688 | 26.01 | 1049 | 1085 | 292.3 |
| D | 9 | 52 | 1527353 | 5019.57 | 977 | 1011 | 304.1 |
| D | 6 | 226 | 455170 | 1493.56 | 977 | 1011 | 304.1 |
| D | 7 | 207 | 29375 | 93.28 | 977 | 1011 | 304.1 |
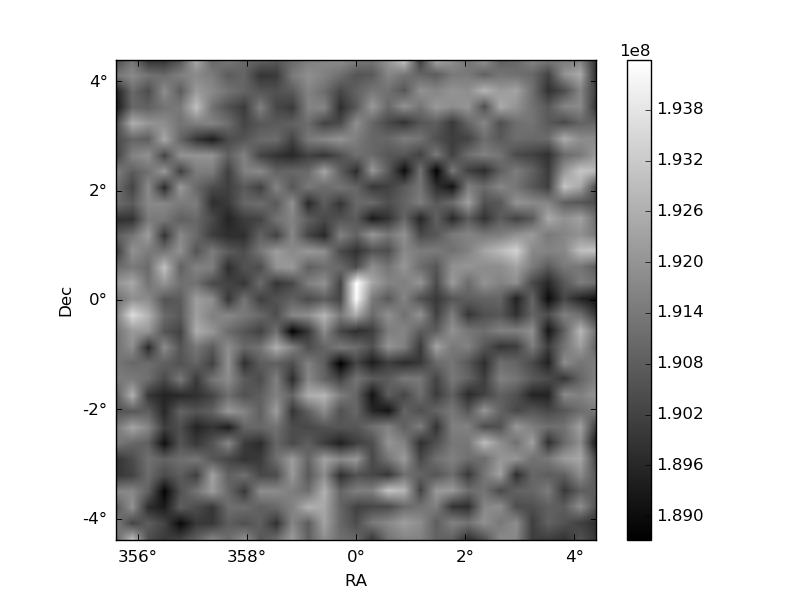
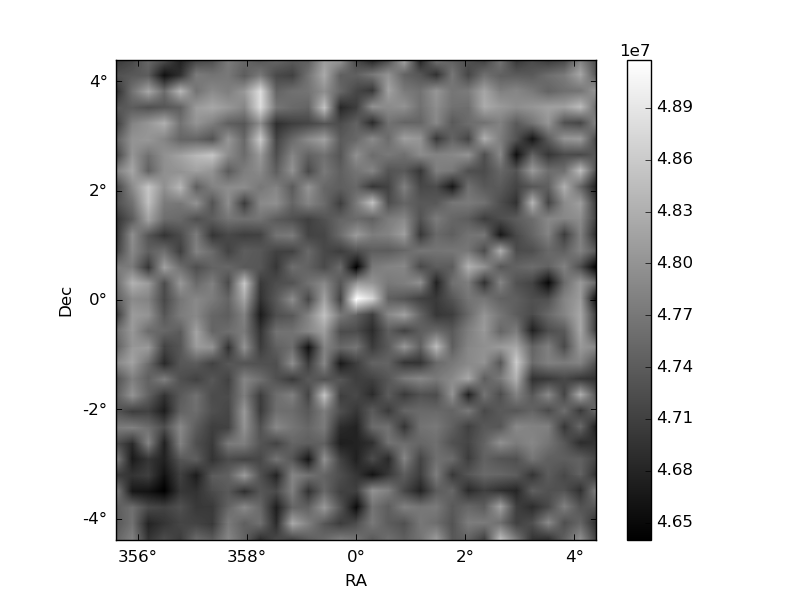
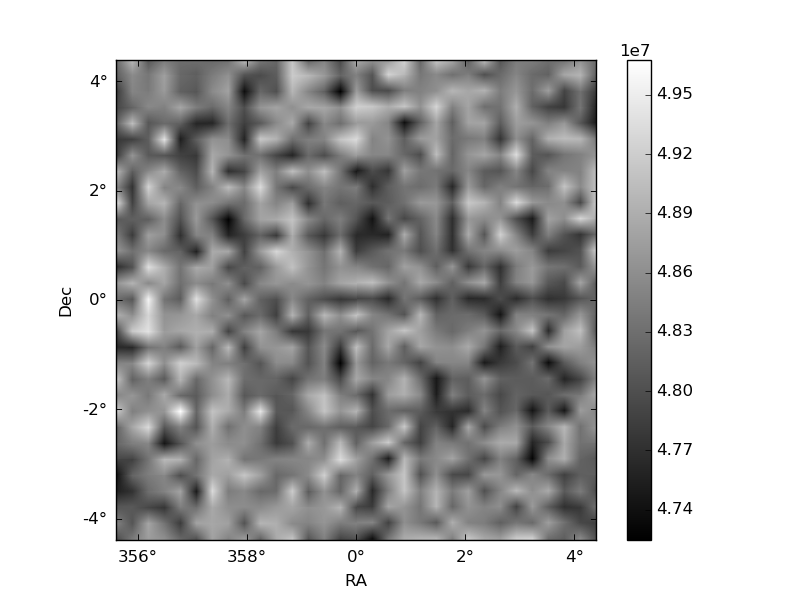
Histogram calculated using DETX and DETY for each event in the final _common_clean file
| Quadrant A | 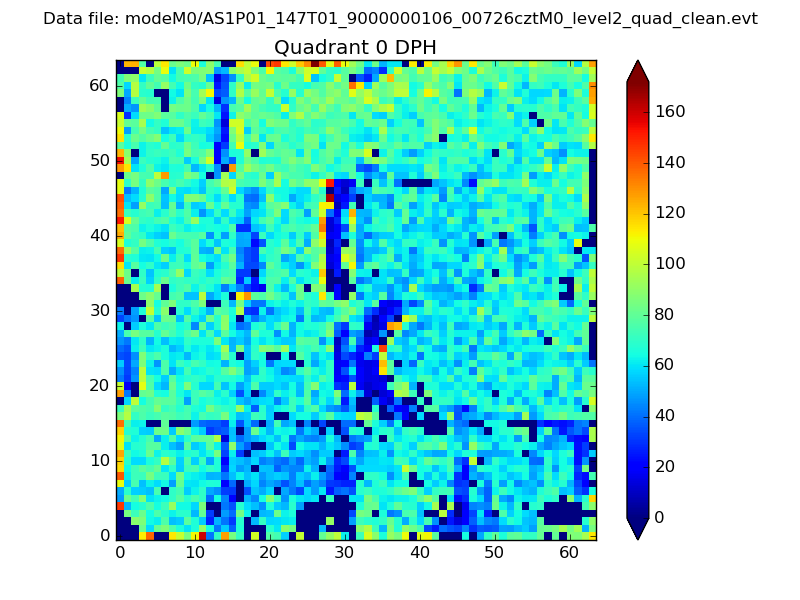 |
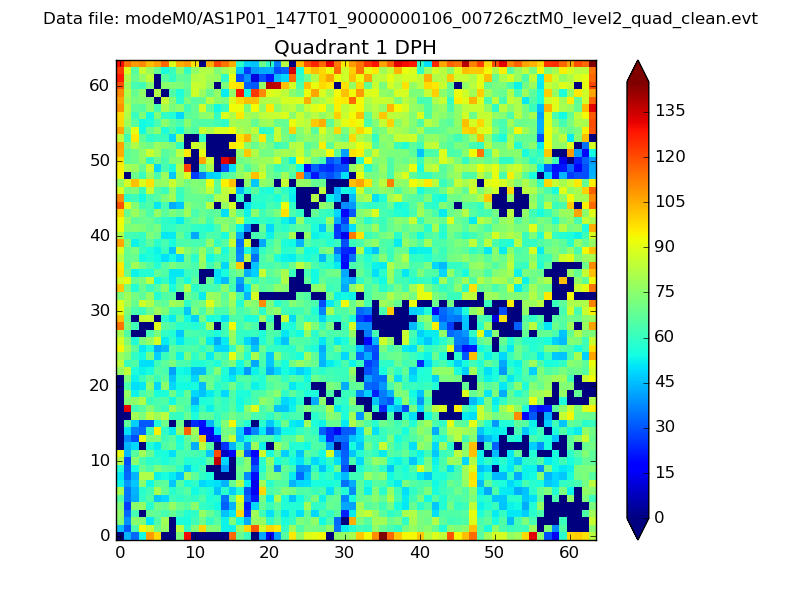 |
Quadrant B |
|---|---|---|---|
| Quadrant D |  |
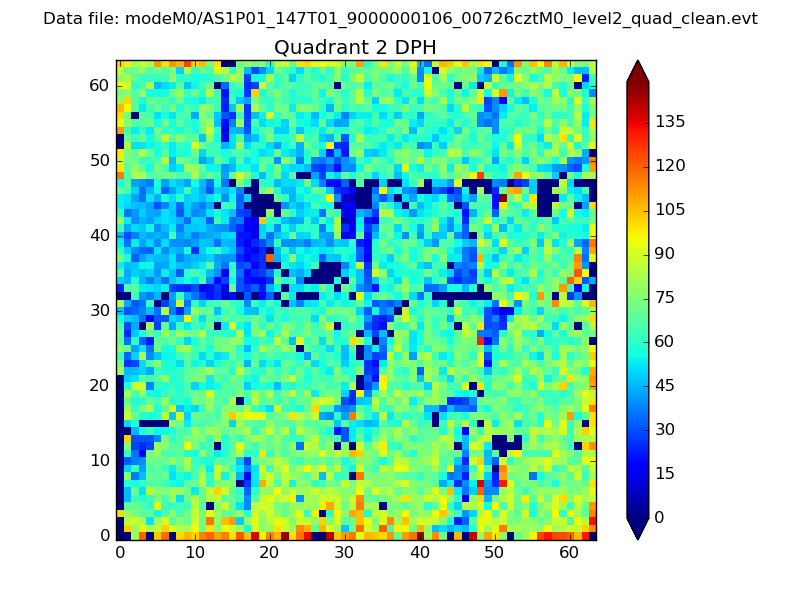 |
Quadrant C |
| Plot type | Count rate plots | Images |
|---|---|---|
| Comparison with Poisson distribution Blue bars denote a histogram of data divided into 1 sec bins. Red curve is a Poisson curve with rate = median count rate of data. |
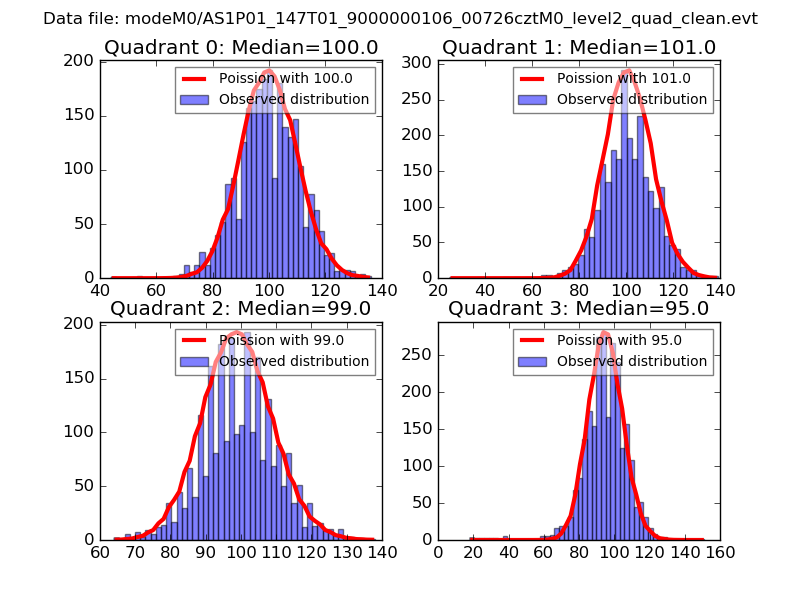 |
 |
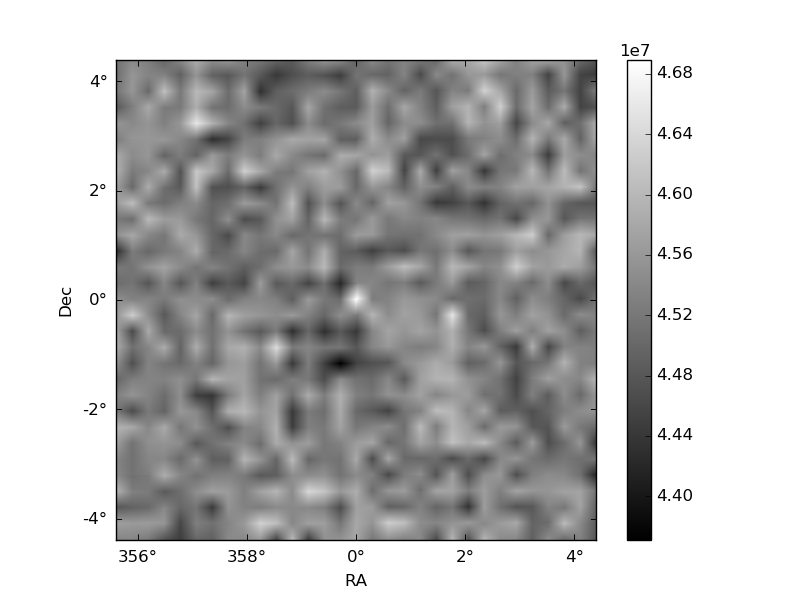
| Quadrant-wise count rates Data is divided into 100 sec bins |
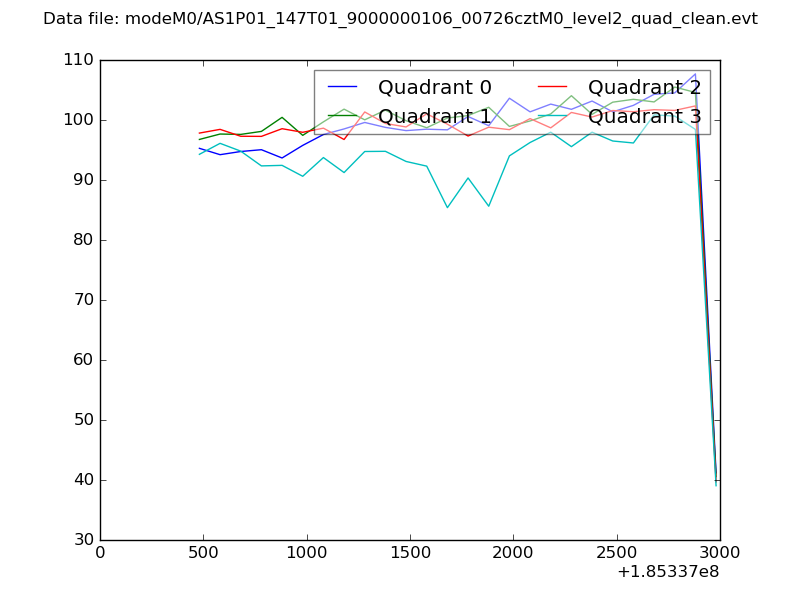 |
|
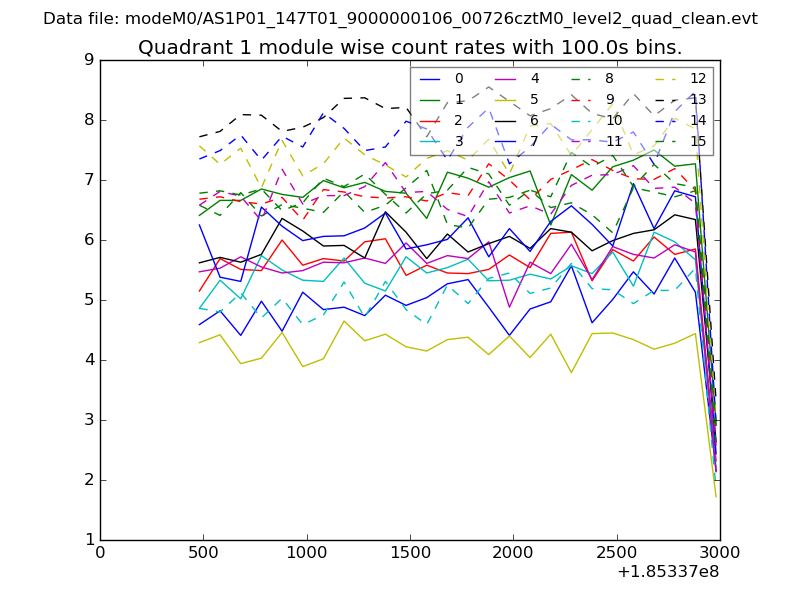
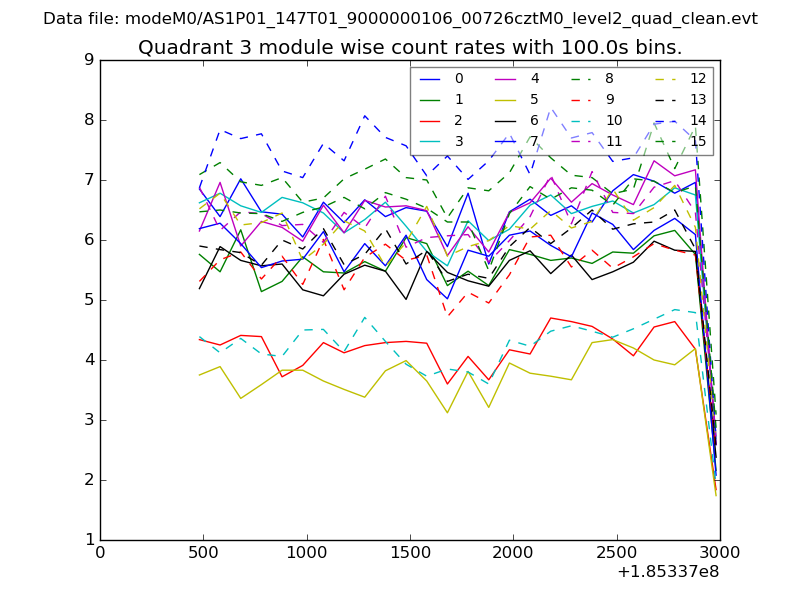
| Module-wise count rates for Quadrant A Data is divided into 100 sec bins |
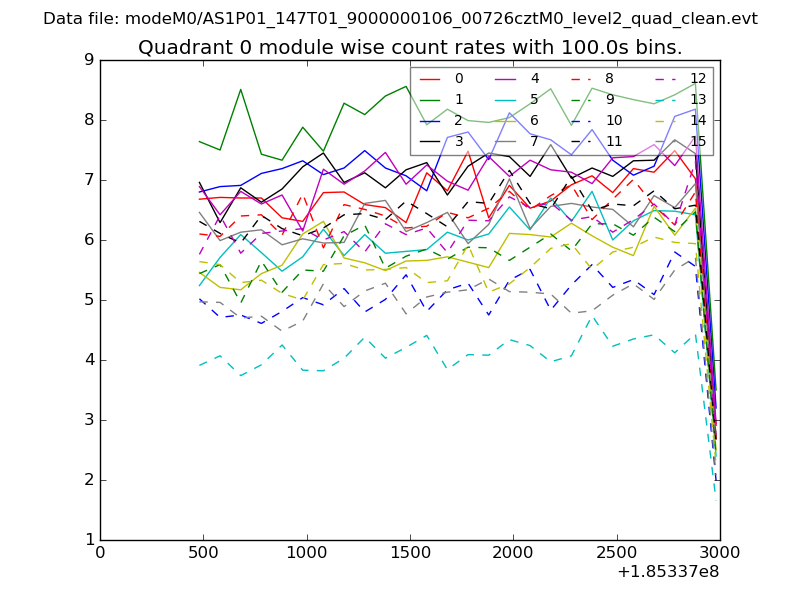 |
 |
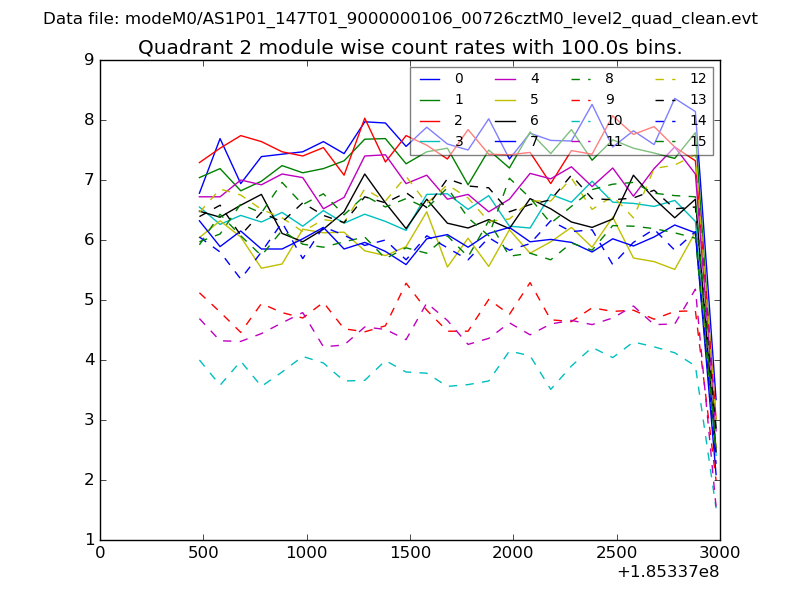
| Module-wise count rates for Quadrant B Data is divided into 100 sec bins |
 |
 |
| Module-wise count rates for Quadrant C Data is divided into 100 sec bins |
 |
 |
| Module-wise count rates for Quadrant D Data is divided into 100 sec bins |
 |
 |
| Parameter | Plot |
|---|---|
| CZT HV Monitor | 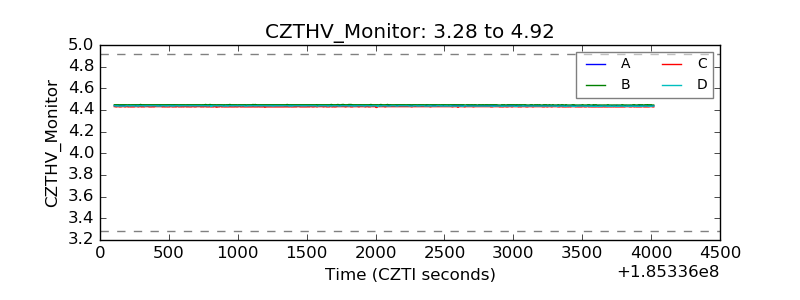 |
| D_VDD | 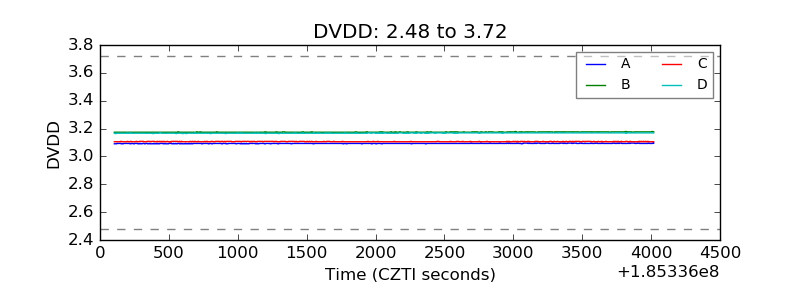 |
| Temperature 1 | 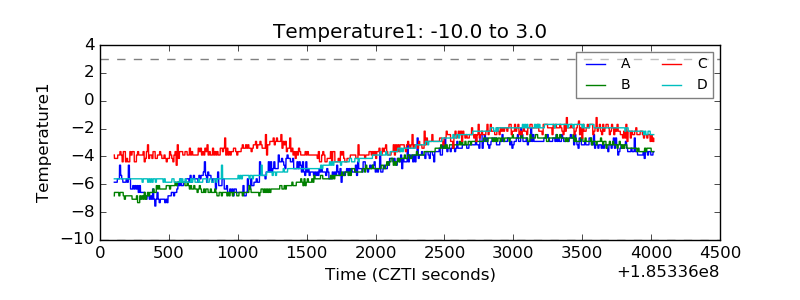 |
| Veto HV Monitor | 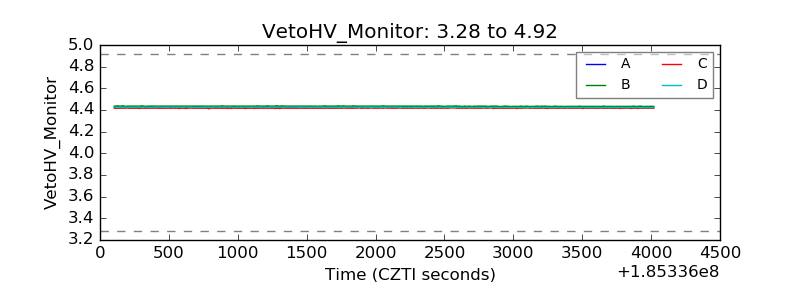 |
| Veto LLD | 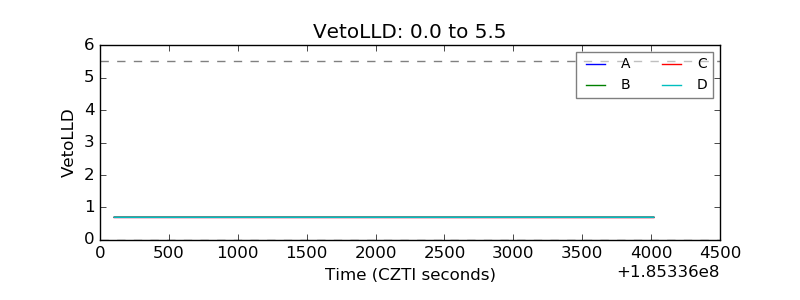 |
| Alpha Counter | 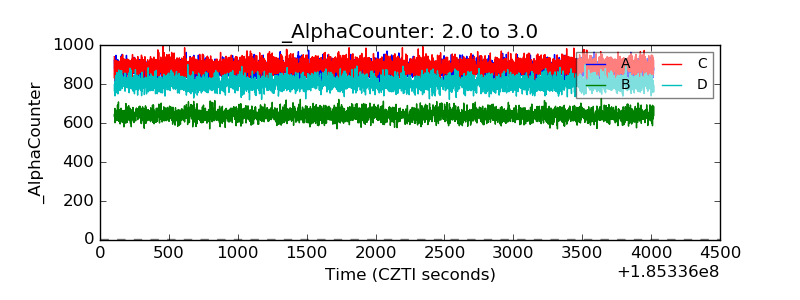 |
| _CPM_Rate | 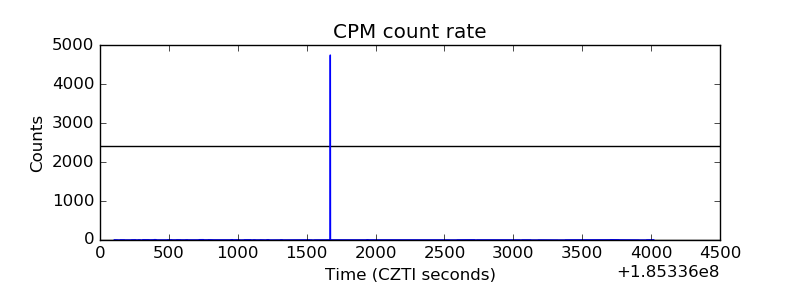 |
| CZT Counter | 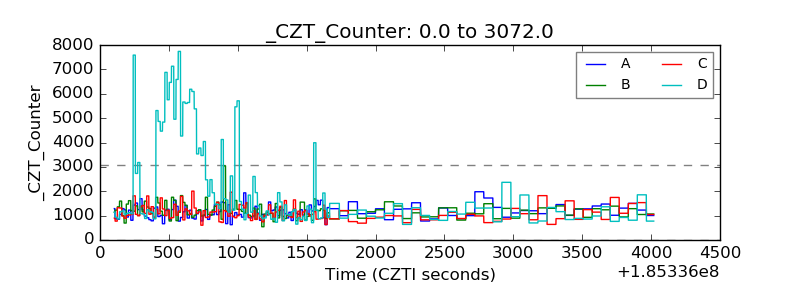 |
| +2.5 Volts monitor |  |
| +5 Volts monitor |  |
| _ROLL_ROT | 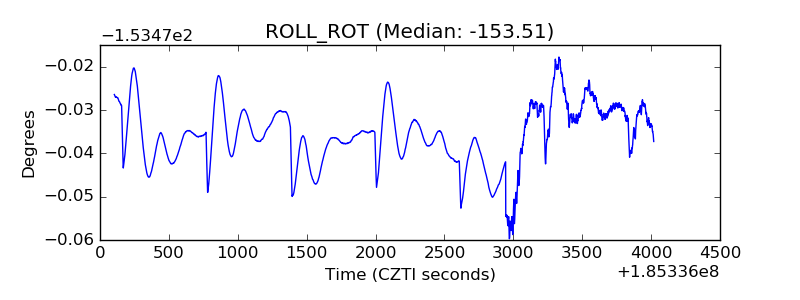 |
| _Roll_DEC | 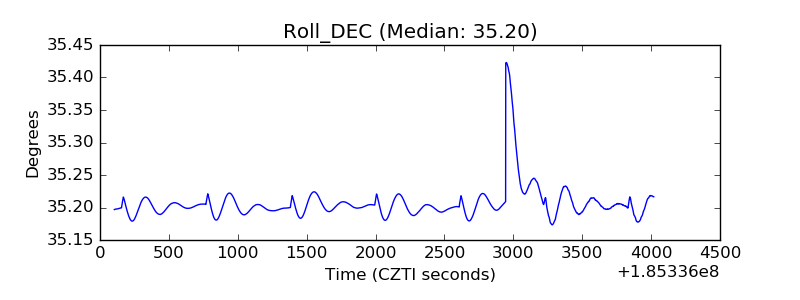 |
| _Roll_RA | 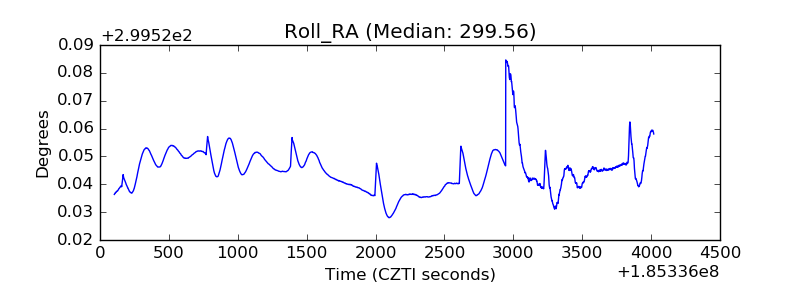 |
| Veto Counter | 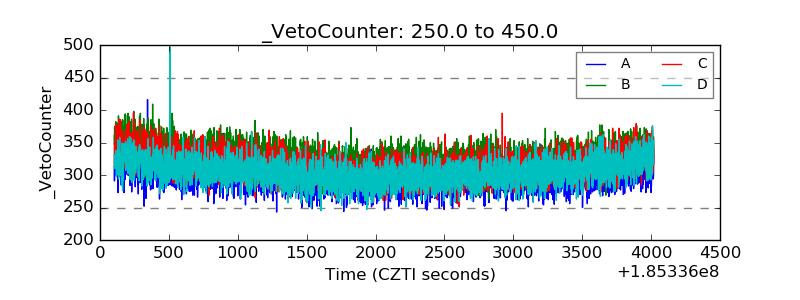 |