| Param | Original file | Final file |
|---|---|---|
| Filename | modeM0/AS1P01_010T01_9000000108cztM0_level2.fits | modeM0/AS1P01_010T01_9000000108cztM0_level2_quad_clean.evt |
| Size (bytes) | 2,432,448,000 | 3,461,791,680 |
| Size | 2.3 GB | 3.2 GB |
| Events in quadrant A | 14,013,218 | 22,404,829 |
| Events in quadrant B | 13,839,496 | 22,182,454 |
| Events in quadrant C | 13,817,208 | 21,317,937 |
| Events in quadrant D | 11,345,054 | 18,317,929 |
| Mode SS | |||
|---|---|---|---|
| Quadrant | BADHDUFLAG | Total packets | Discarded packets |
| A | 0 | 6122 | 0 |
| B | 0 | 6122 | 0 |
| C | 0 | 6122 | 0 |
| D | 0 | 6122 | 0 |
| Mode M0 | |||
|---|---|---|---|
| Quadrant | BADHDUFLAG | Total packets | Discarded packets |
| A | 0 | 1306247 | 0 |
| B | 0 | 1414895 | 0 |
| C | 0 | 1289372 | 0 |
| D | 0 | 1477225 | 0 |
| Mode M9 | |||
|---|---|---|---|
| Quadrant | BADHDUFLAG | Total packets | Discarded packets |
| A | 0 | 402 | 0 |
| B | 0 | 402 | 0 |
| C | 0 | 402 | 0 |
| D | 0 | 402 | 0 |
| Quadrant | Total seconds | Saturated seconds | Saturation percentage |
|---|---|---|---|
| A | 301238 | 3552 | 1.179134% |
| B | 301237 | 8793 | 2.918964% |
| C | 301239 | 3518 | 1.167843% |
| D | 301239 | 24757 | 8.218391% |
Noise dominated data is calculated using 1-second bins in cleaned event files. If a bin has >2000 counts, and if more than 50% of those come from <1% of pixels, then it is considered to be noise-dominated and hence unusable.
| Quadrant | # 1 sec bins | Bins with >0 counts | Bins with >2000 counts | High rate bins dominated by noise | Noise dominated (total time) | Noise dominated (detector-on time) | Marked lightcurve |
|---|---|---|---|---|---|---|---|
| A | 349518 | 301052 | 0 | 0 | 0.00% | 0.00% | 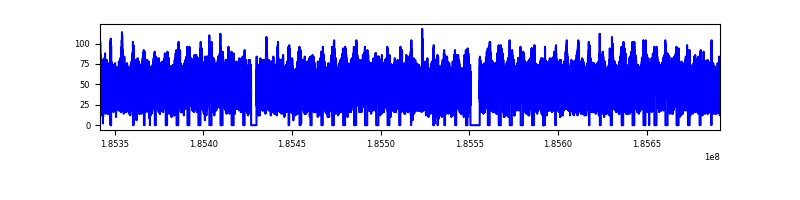 |
| B | 349518 | 301071 | 0 | 0 | 0.00% | 0.00% | 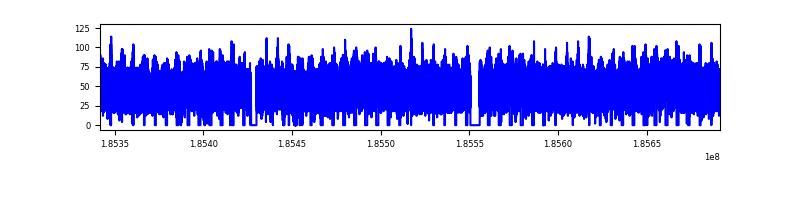 |
| C | 349518 | 301217 | 0 | 0 | 0.00% | 0.00% | 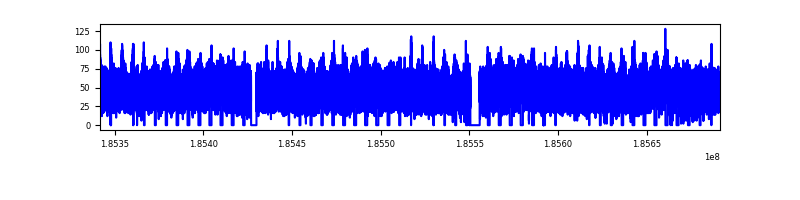 |
| D | 349518 | 300777 | 0 | 0 | 0.00% | 0.00% | 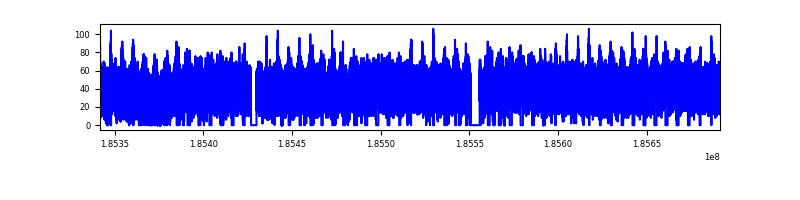 |
Top three noisy pixels from each quadrant. If the there are fewer than three noisy pixels in the level2.evt file, extra rows are filled as -1
| Pixel properties | Quadrant properties | ||||||
|---|---|---|---|---|---|---|---|
| Quadrant | DetID | PixID | Counts | Sigma | Mean | Median | Sigma |
| A | 7 | 110 | 13247 | 11.83 | 3629 | 3384 | 834.0 |
| A | 0 | 29 | 12919 | 11.43 | 3629 | 3384 | 834.0 |
| A | 14 | 188 | 10643 | 8.7 | 3629 | 3384 | 834.0 |
| B | 2 | 9 | 11275 | 11.85 | 3664 | 3474 | 658.3 |
| B | 14 | 254 | 9298 | 8.85 | 3664 | 3474 | 658.3 |
| B | 10 | 225 | 8756 | 8.02 | 3664 | 3474 | 658.3 |
| C | 12 | 241 | 9351 | 6.78 | 3658 | 3368 | 882.4 |
| C | 2 | 191 | 9275 | 6.69 | 3658 | 3368 | 882.4 |
| C | 9 | 242 | 8915 | 6.29 | 3658 | 3368 | 882.4 |
| D | 6 | 44 | 8537 | 7.25 | 3255 | 2974 | 767.8 |
| D | 6 | 231 | 8346 | 7.0 | 3255 | 2974 | 767.8 |
| D | 11 | 82 | 8276 | 6.91 | 3255 | 2974 | 767.8 |
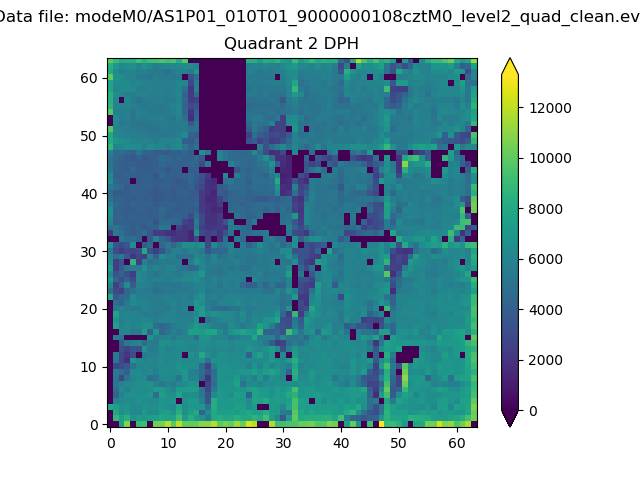
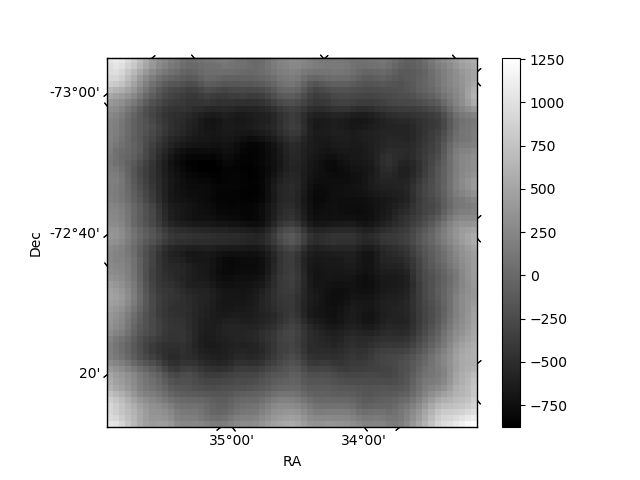
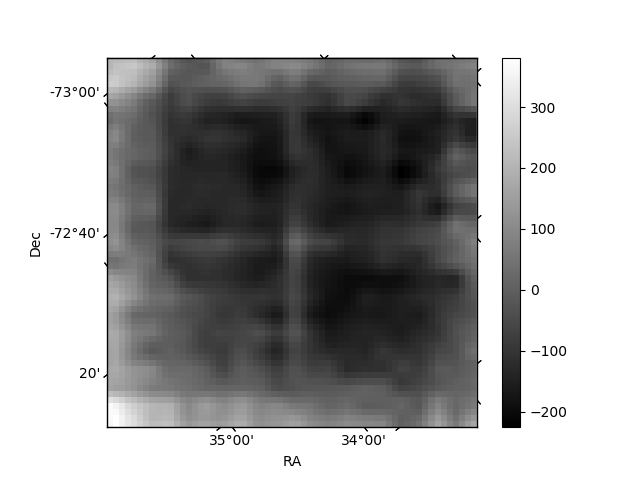
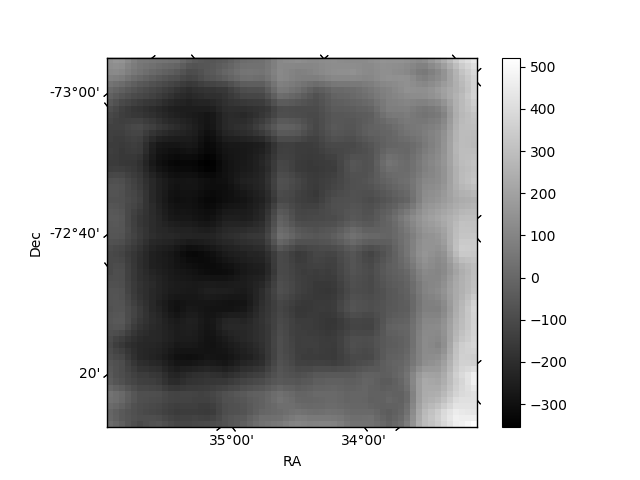
Histogram calculated using DETX and DETY for each event in the final _common_clean file
| Quadrant A | 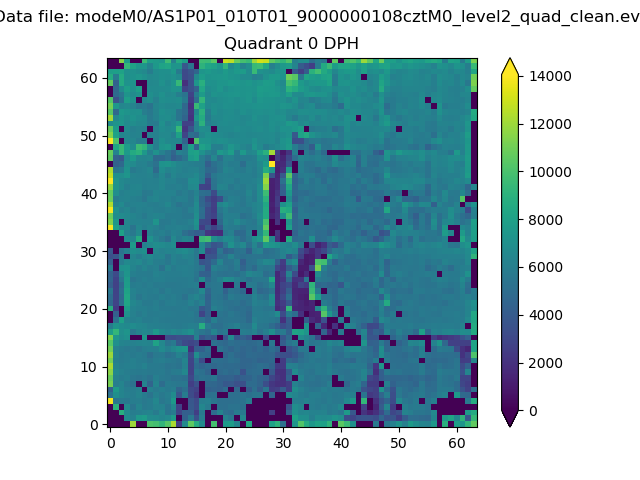 |
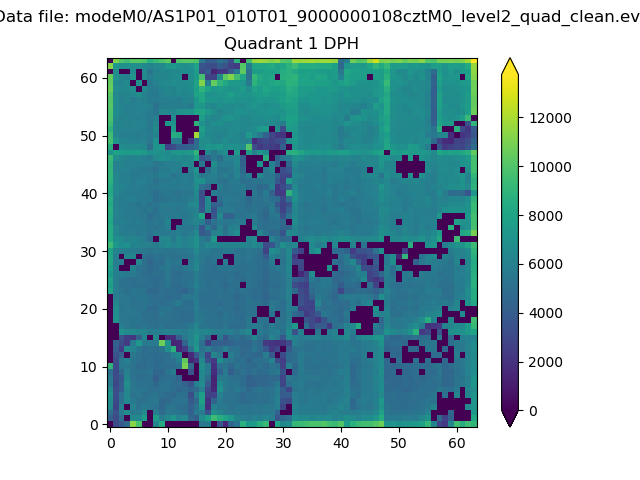 |
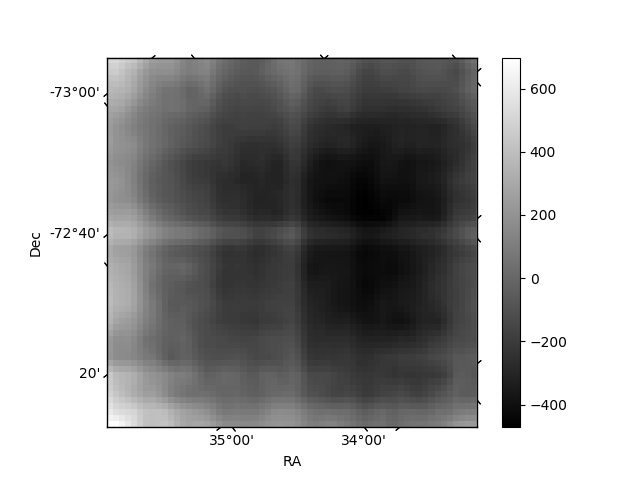
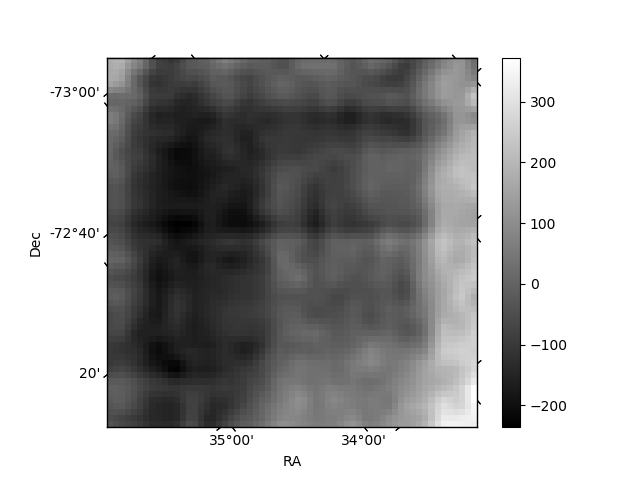
Quadrant B |
|---|---|---|---|
| Quadrant D | 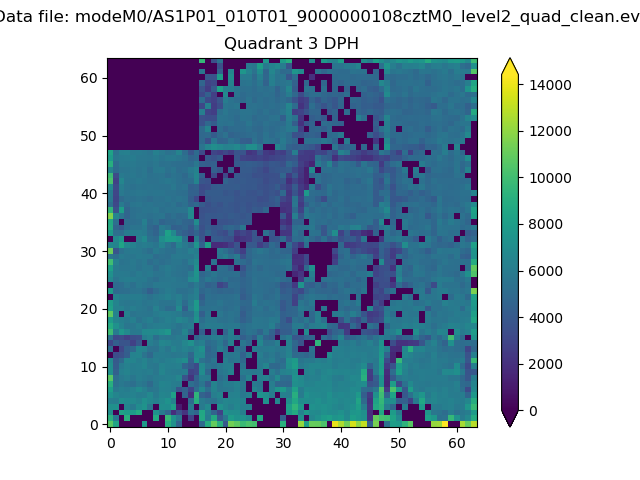 |
 |
Quadrant C |
| Plot type | Count rate plots | Images |
|---|---|---|
| Comparison with Poisson distribution Blue bars denote a histogram of data divided into 1 sec bins. Red curve is a Poisson curve with rate = median count rate of data. |
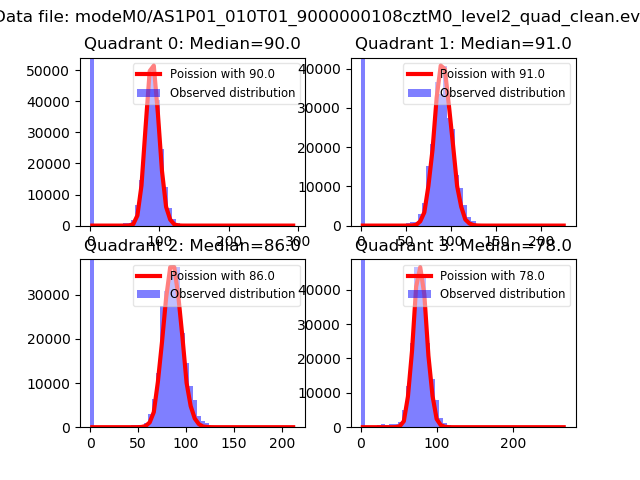 |
 |
| Quadrant-wise count rates Data is divided into 100 sec bins |
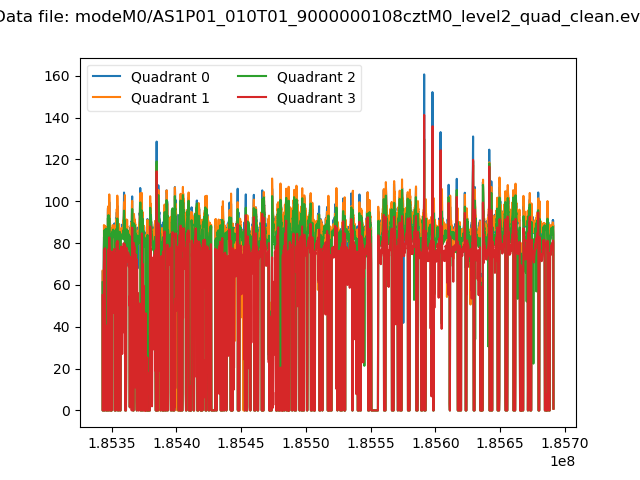 |
|
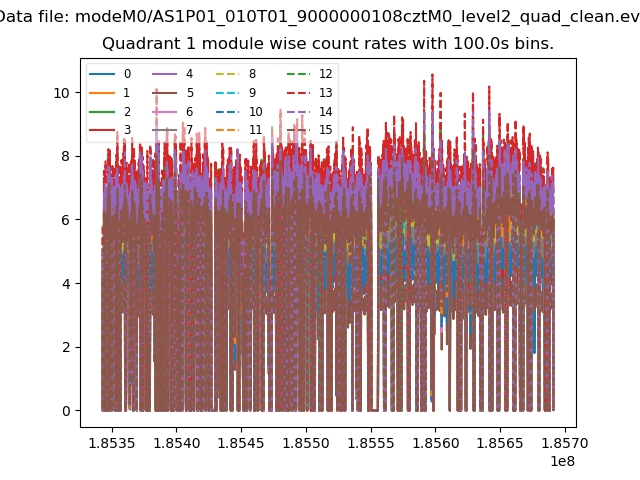
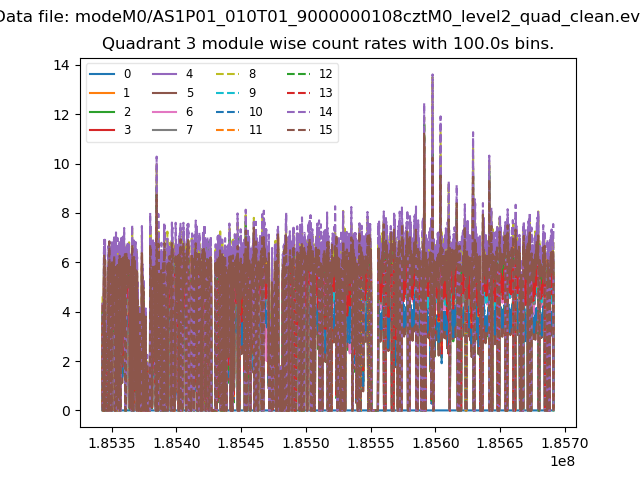
| Module-wise count rates for Quadrant A Data is divided into 100 sec bins |
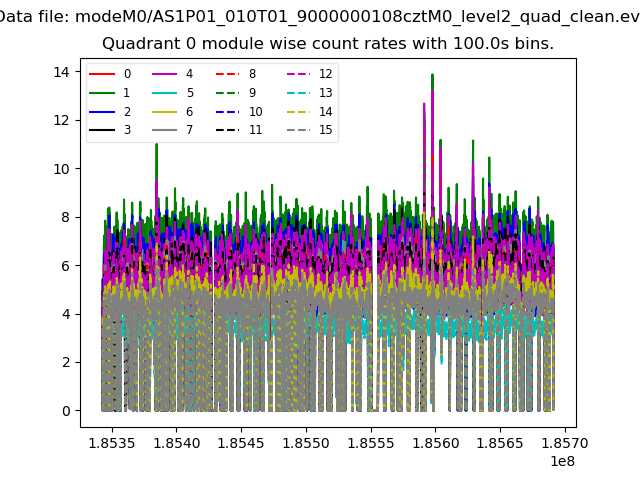 |
 |
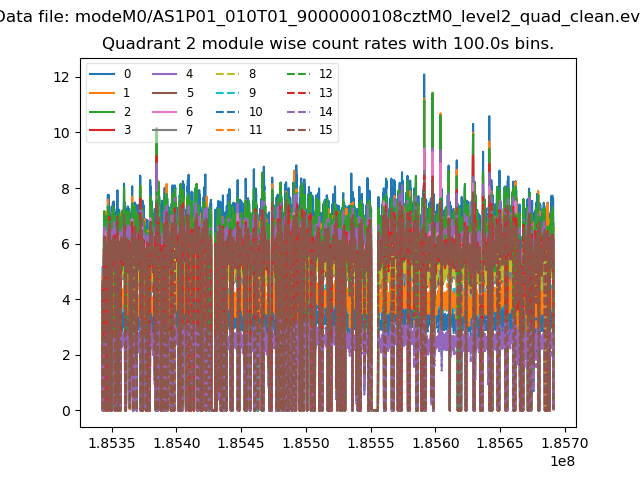
| Module-wise count rates for Quadrant B Data is divided into 100 sec bins |
 |
 |
| Module-wise count rates for Quadrant C Data is divided into 100 sec bins |
 |
 |
| Module-wise count rates for Quadrant D Data is divided into 100 sec bins |
 |
 |
| Parameter | Plot |
|---|---|
| CZT HV Monitor | 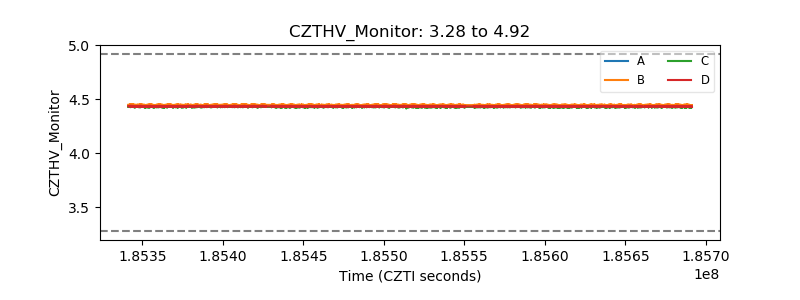 |
| D_VDD | 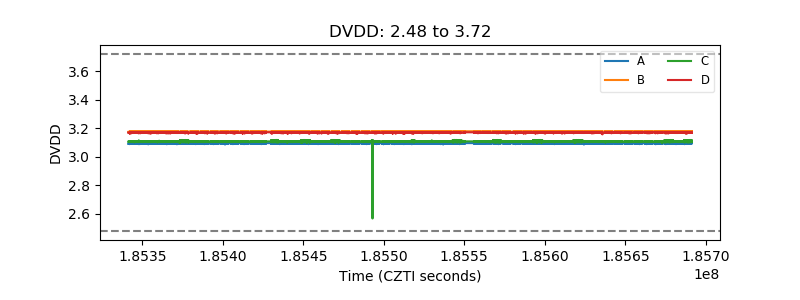 |
| Temperature 1 |  |
| Veto HV Monitor | 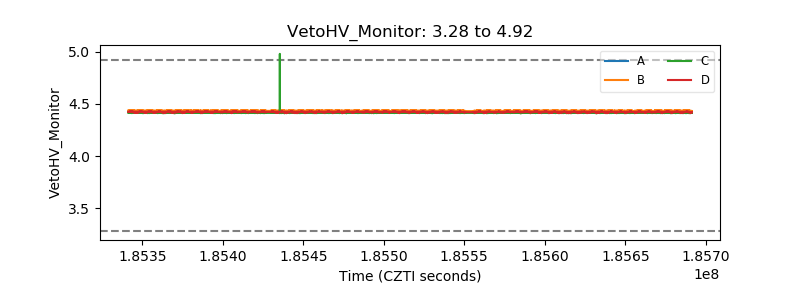 |
| Veto LLD | 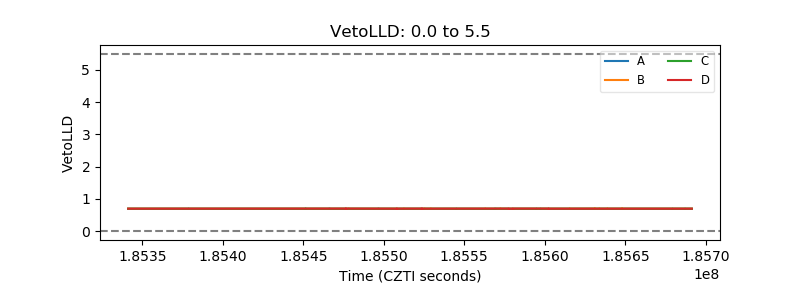 |
| Alpha Counter | 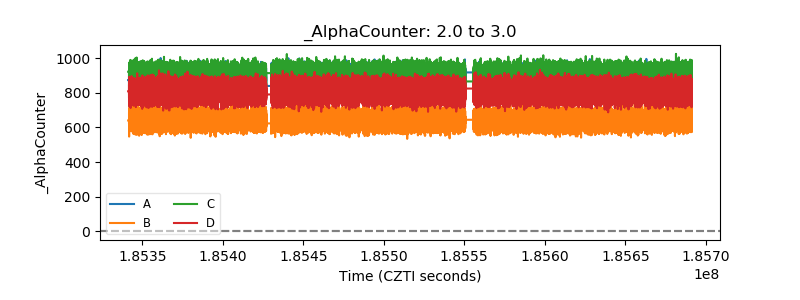 |
| _CPM_Rate | 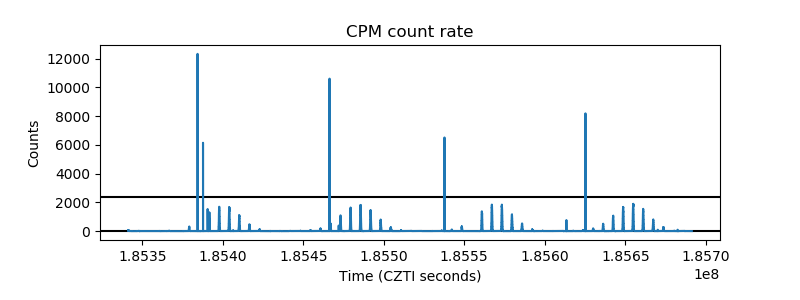 |
| CZT Counter | 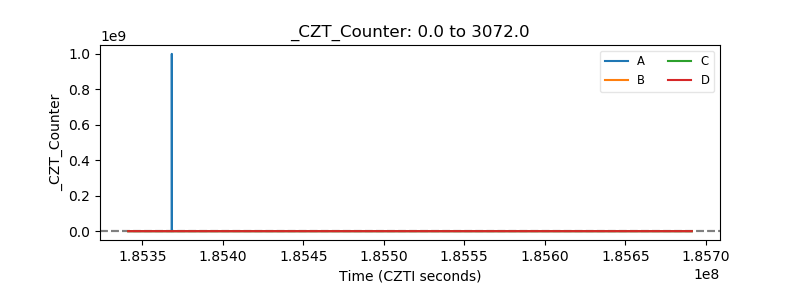 |
| +2.5 Volts monitor | 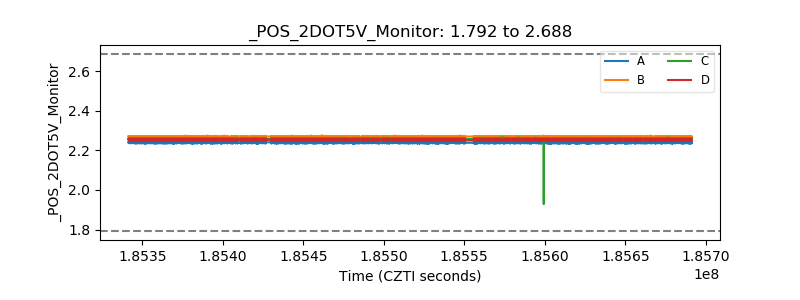 |
| +5 Volts monitor | 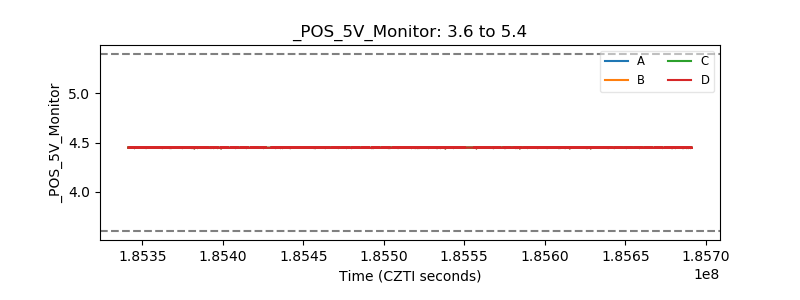 |
| _ROLL_ROT | 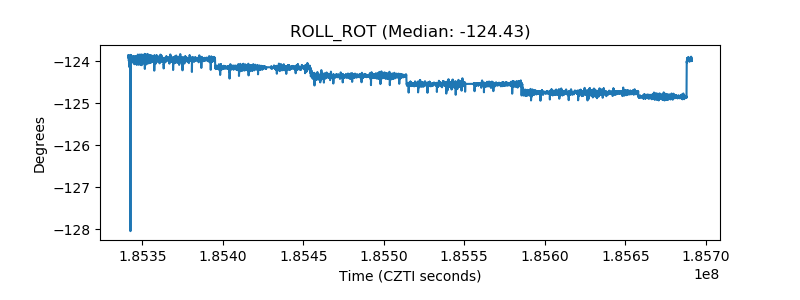 |
| _Roll_DEC | 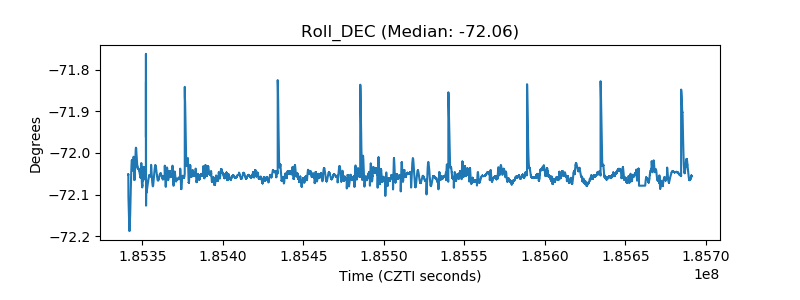 |
| _Roll_RA | 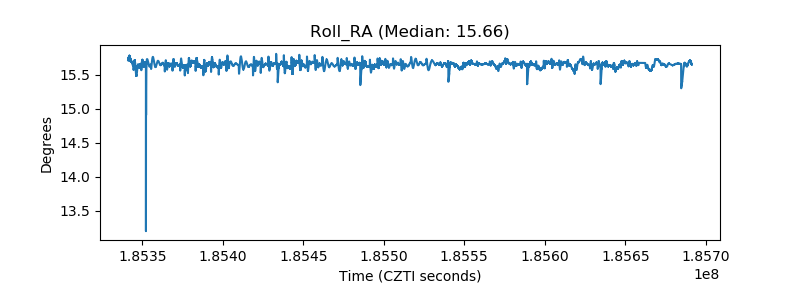 |
| Veto Counter | 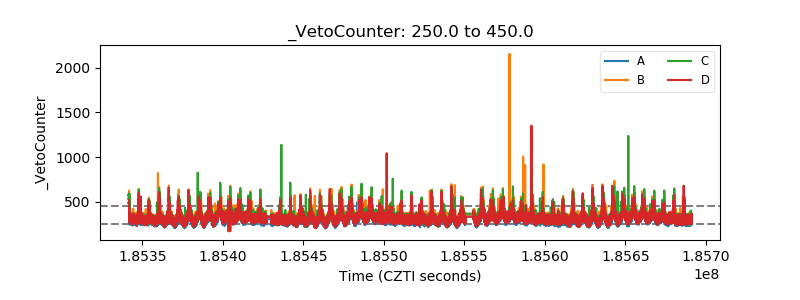 |