| Param | Original file | Final file |
|---|---|---|
| Filename | modeM0/AS1P01_010T01_9000000108_00727cztM0_level2.evt | modeM0/AS1P01_010T01_9000000108_00727cztM0_level2_quad_clean.evt |
| Size (bytes) | 1,208,675,520 | 79,623,360 |
| Size | 1.1 GB | 75.9 MB |
| Events in quadrant A | 8,403,792 | 505,347 |
| Events in quadrant B | 8,716,843 | 511,103 |
| Events in quadrant C | 7,972,391 | 501,890 |
| Events in quadrant D | 11,073,207 | 429,513 |
| Mode SS | |||
|---|---|---|---|
| Quadrant | BADHDUFLAG | Total packets | Discarded packets |
| A | 0 | 136 | 0 |
| B | 0 | 136 | 0 |
| C | 0 | 136 | 0 |
| D | 0 | 136 | 0 |
| Mode M0 | |||
|---|---|---|---|
| Quadrant | BADHDUFLAG | Total packets | Discarded packets |
| A | 0 | 29738 | 4 |
| B | 0 | 30624 | 3 |
| C | 0 | 28394 | 3 |
| D | 0 | 37806 | 3 |
| Mode M9 | |||
|---|---|---|---|
| Quadrant | BADHDUFLAG | Total packets | Discarded packets |
| A | 0 | 1 | 0 |
| B | 0 | 1 | 0 |
| C | 0 | 1 | 0 |
| D | 0 | 1 | 0 |
| Quadrant | Total seconds | Saturated seconds | Saturation percentage |
|---|---|---|---|
| A | 6625 | 222 | 3.350943% |
| B | 6626 | 139 | 2.097797% |
| C | 6626 | 139 | 2.097797% |
| D | 6626 | 1370 | 20.676124% |
Noise dominated data is calculated using 1-second bins in cleaned event files. If a bin has >2000 counts, and if more than 50% of those come from <1% of pixels, then it is considered to be noise-dominated and hence unusable.
| Quadrant | # 1 sec bins | Bins with >0 counts | Bins with >2000 counts | High rate bins dominated by noise | Noise dominated (total time) | Noise dominated (detector-on time) | Marked lightcurve |
|---|---|---|---|---|---|---|---|
| A | 6795 | 6628 | 518 | 518 | 7.62% | 7.82% | 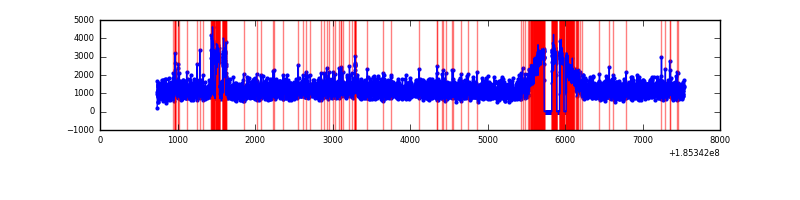 |
| B | 6796 | 6629 | 489 | 489 | 7.20% | 7.38% | 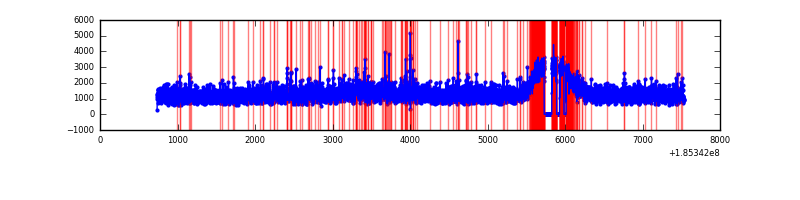 |
| C | 6796 | 6629 | 381 | 381 | 5.61% | 5.75% | 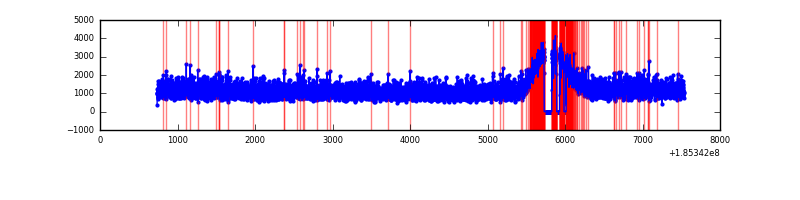 |
| D | 6796 | 6629 | 1839 | 1839 | 27.06% | 27.74% | 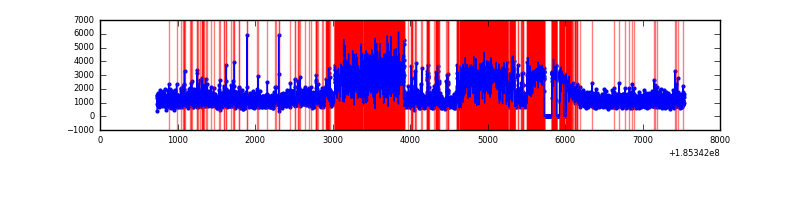 |
Top three noisy pixels from each quadrant. If the there are fewer than three noisy pixels in the level2.evt file, extra rows are filled as -1
| Pixel properties | Quadrant properties | ||||||
|---|---|---|---|---|---|---|---|
| Quadrant | DetID | PixID | Counts | Sigma | Mean | Median | Sigma |
| A | 15 | 171 | 267807 | 517.55 | 2098 | 2112 | 513.4 |
| A | 15 | 17 | 48913 | 91.16 | 2098 | 2112 | 513.4 |
| A | 10 | 230 | 19563 | 33.99 | 2098 | 2112 | 513.4 |
| B | 7 | 221 | 203077 | 386.56 | 2196 | 2200 | 519.6 |
| B | 5 | 191 | 75176 | 140.43 | 2196 | 2200 | 519.6 |
| B | 0 | 220 | 39366 | 71.52 | 2196 | 2200 | 519.6 |
| C | 15 | 241 | 39232 | 65.71 | 2012 | 2084 | 565.4 |
| C | 3 | 111 | 31644 | 52.29 | 2012 | 2084 | 565.4 |
| C | 3 | 79 | 20599 | 32.75 | 2012 | 2084 | 565.4 |
| D | 9 | 52 | 3699012 | 6534.09 | 1807 | 1866 | 565.8 |
| D | 6 | 226 | 311198 | 546.69 | 1807 | 1866 | 565.8 |
| D | 7 | 207 | 172487 | 301.54 | 1807 | 1866 | 565.8 |
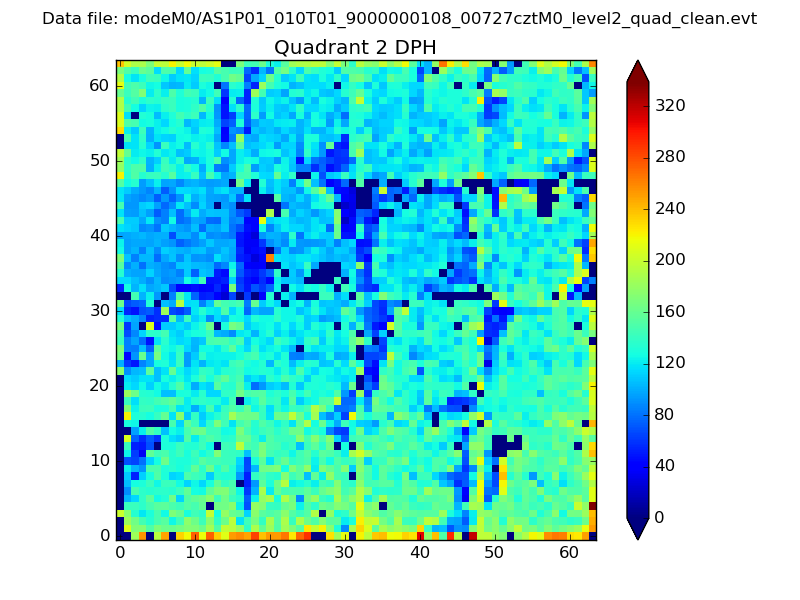
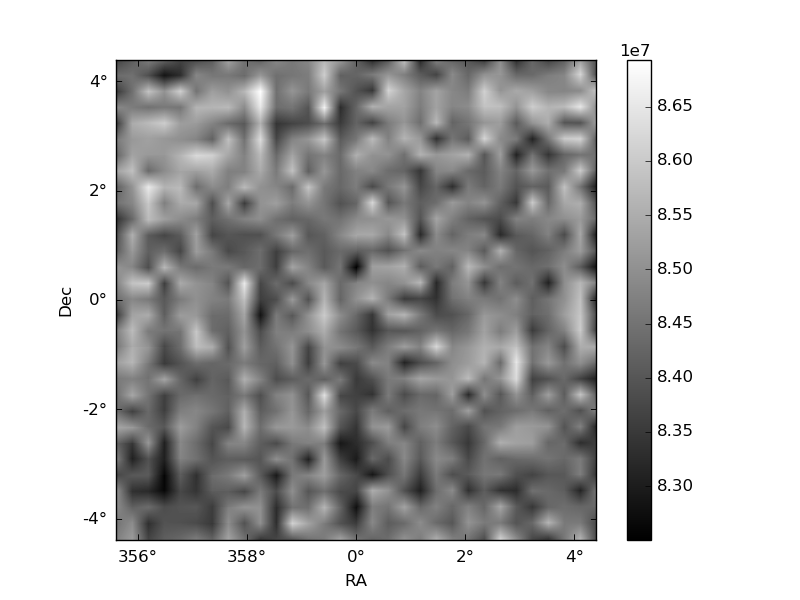
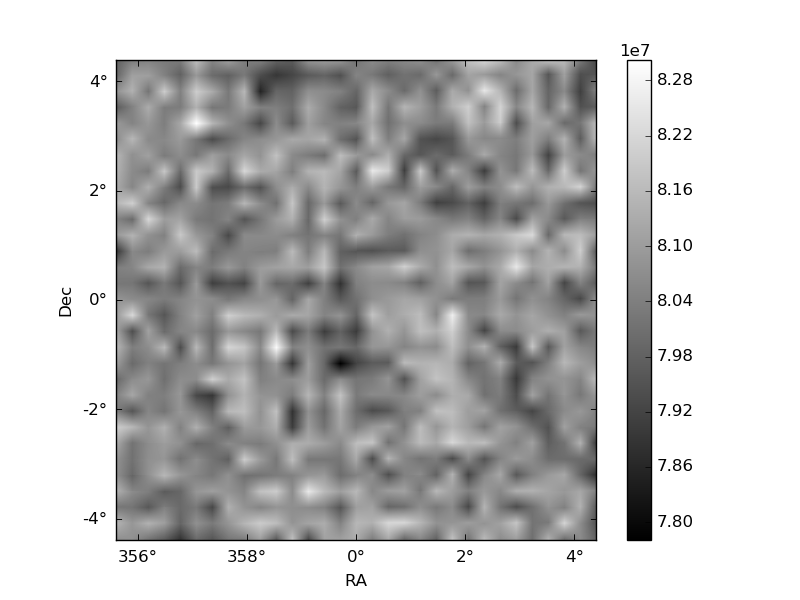
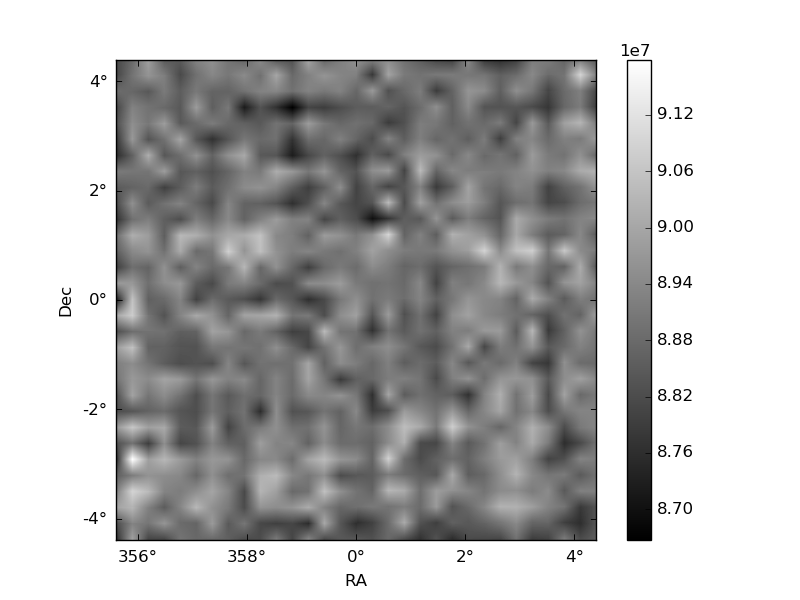
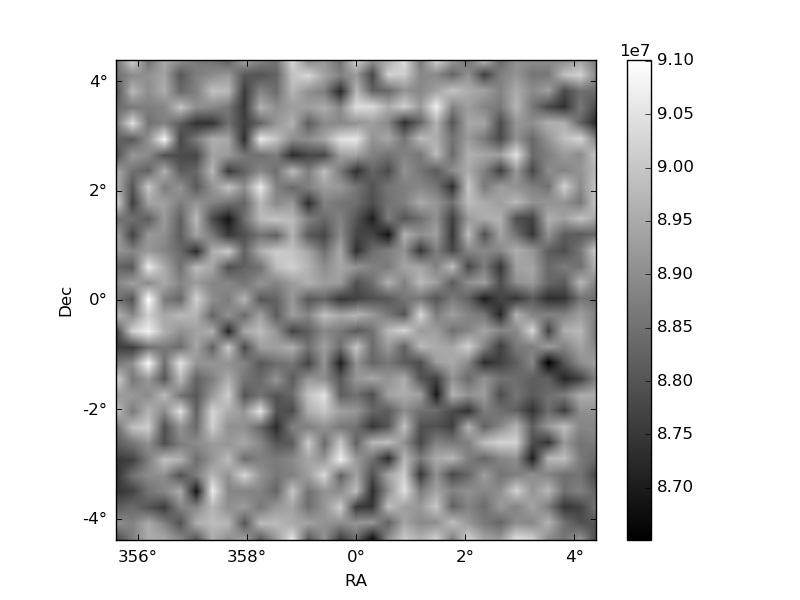
Histogram calculated using DETX and DETY for each event in the final _common_clean file
| Quadrant A | 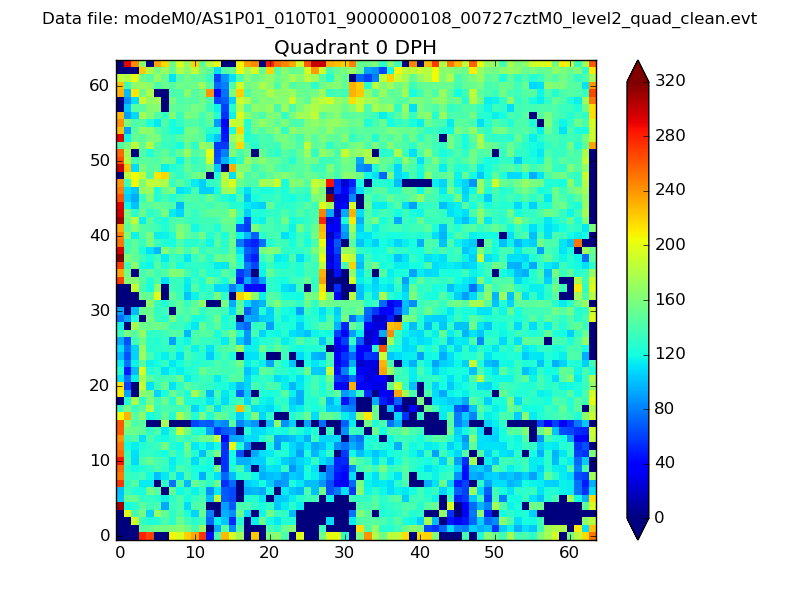 |
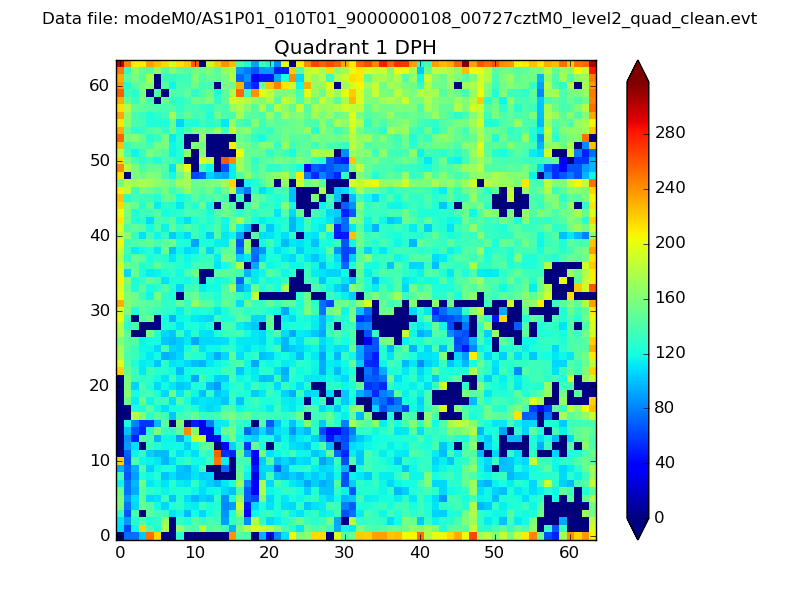 |
Quadrant B |
|---|---|---|---|
| Quadrant D | 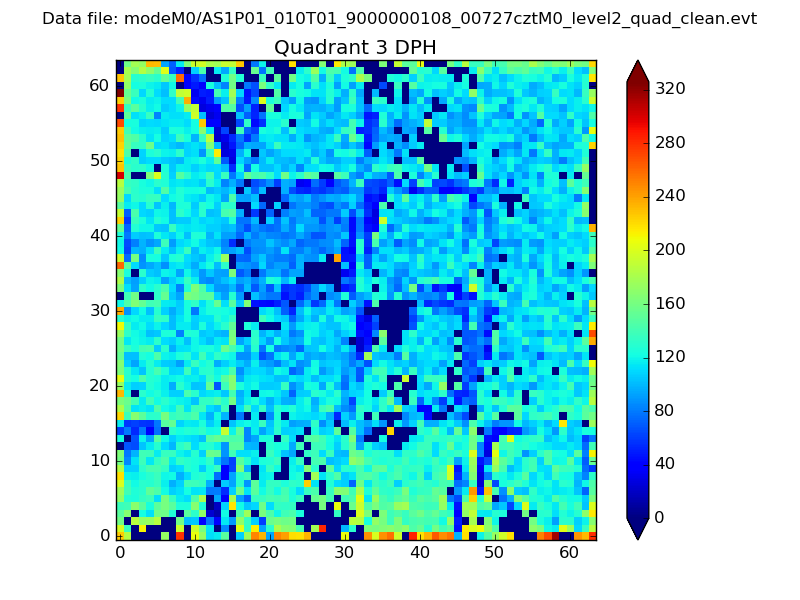 |
 |
Quadrant C |
| Plot type | Count rate plots | Images |
|---|---|---|
| Comparison with Poisson distribution Blue bars denote a histogram of data divided into 1 sec bins. Red curve is a Poisson curve with rate = median count rate of data. |
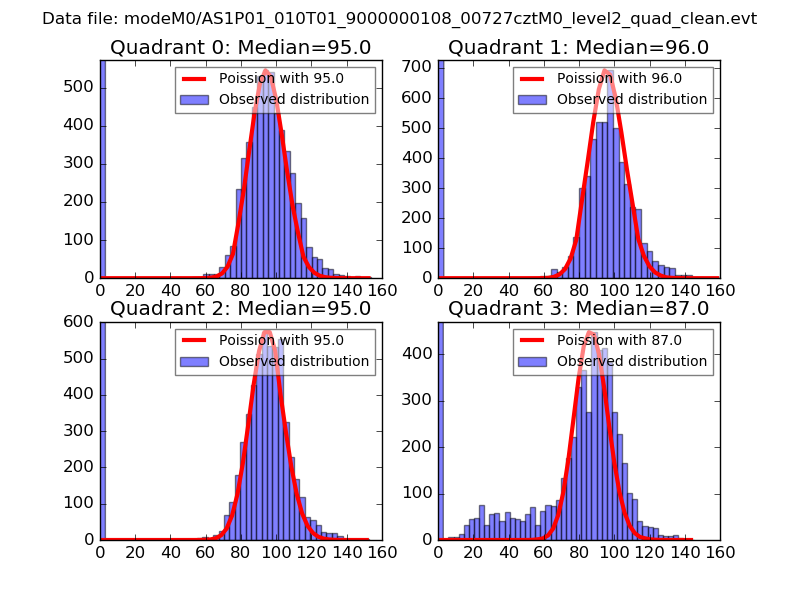 |
 |
| Quadrant-wise count rates Data is divided into 100 sec bins |
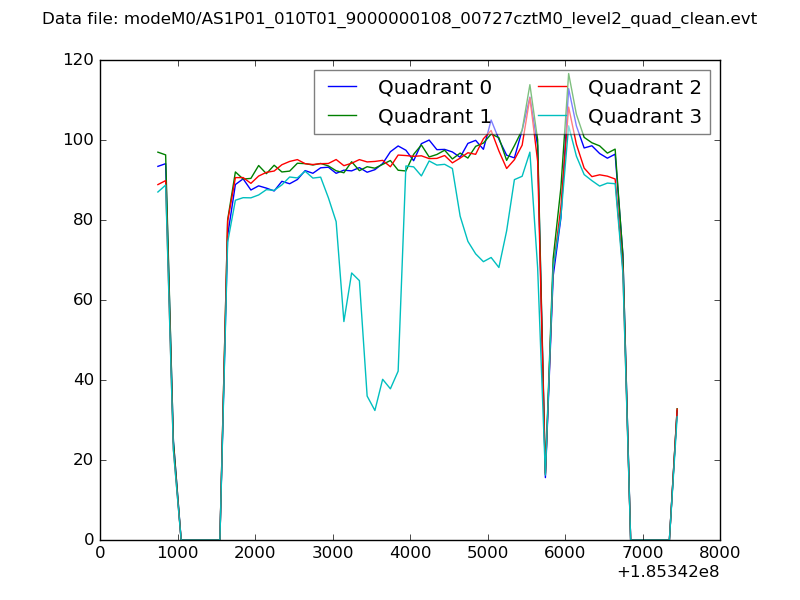 |
|
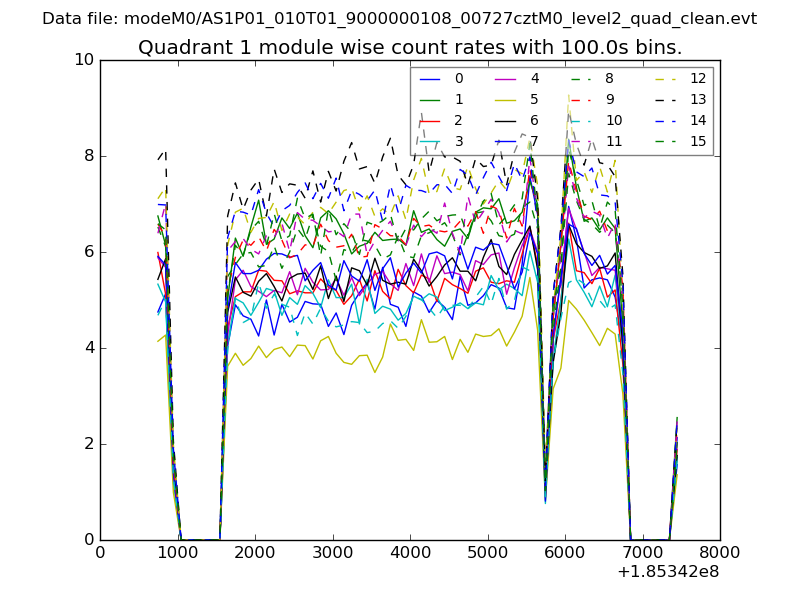
| Module-wise count rates for Quadrant A Data is divided into 100 sec bins |
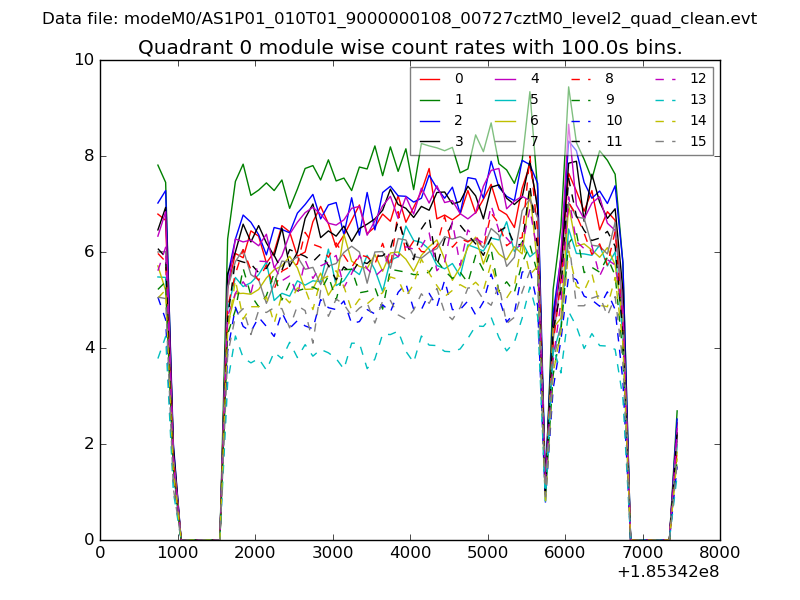 |
 |
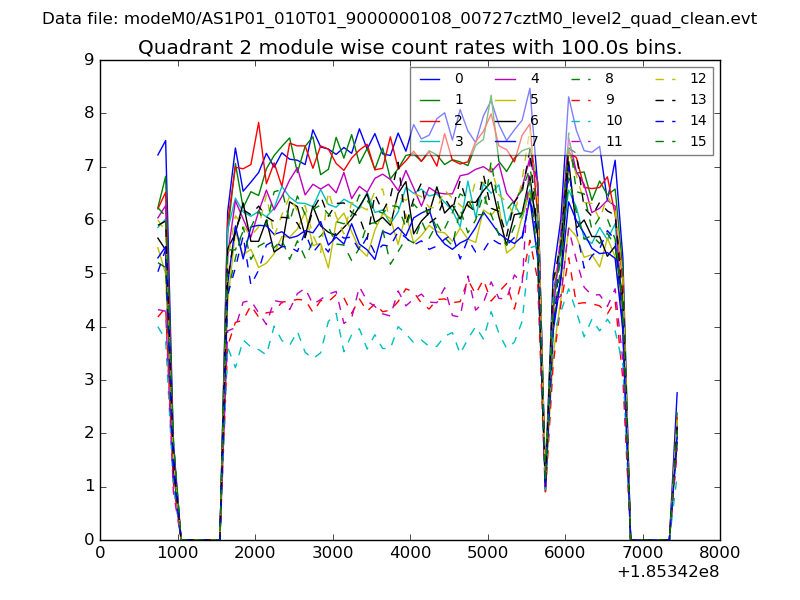
| Module-wise count rates for Quadrant B Data is divided into 100 sec bins |
 |
 |
| Module-wise count rates for Quadrant C Data is divided into 100 sec bins |
 |
 |
| Module-wise count rates for Quadrant D Data is divided into 100 sec bins |
 |
 |
| Parameter | Plot |
|---|---|
| CZT HV Monitor | 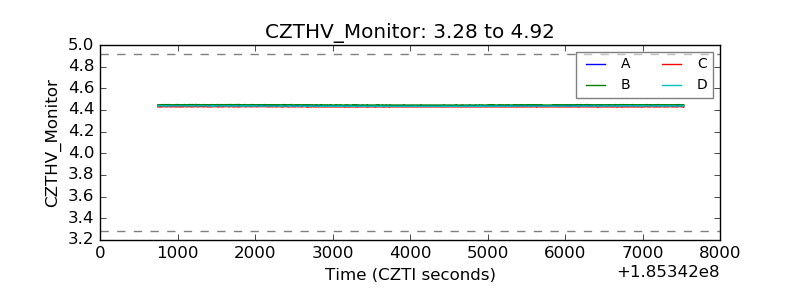 |
| D_VDD | 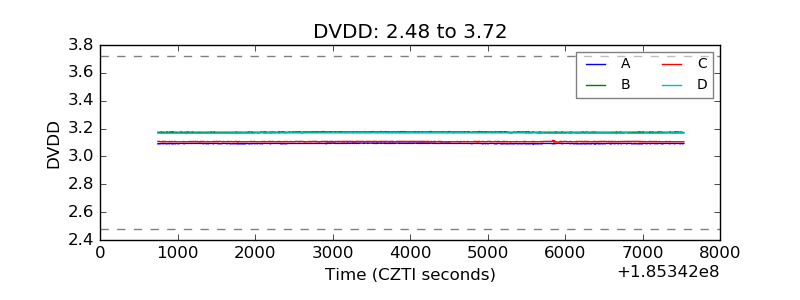 |
| Temperature 1 | 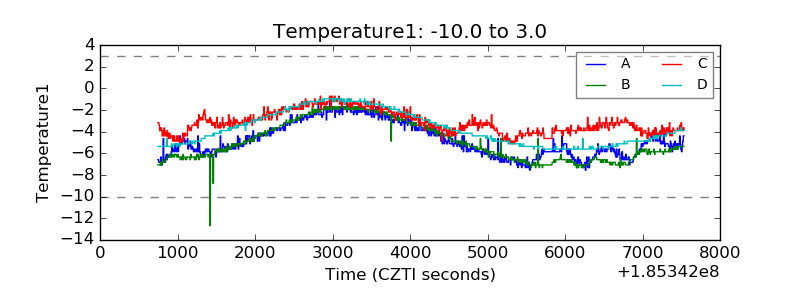 |
| Veto HV Monitor | 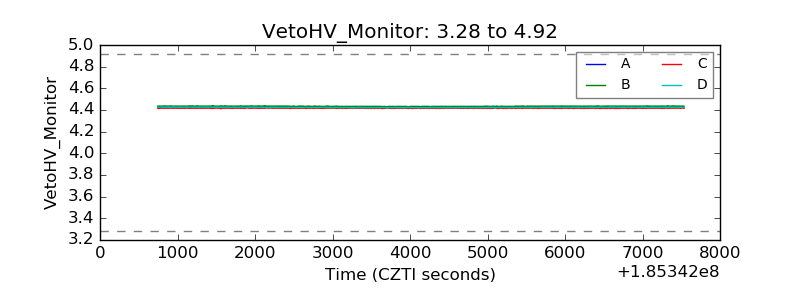 |
| Veto LLD | 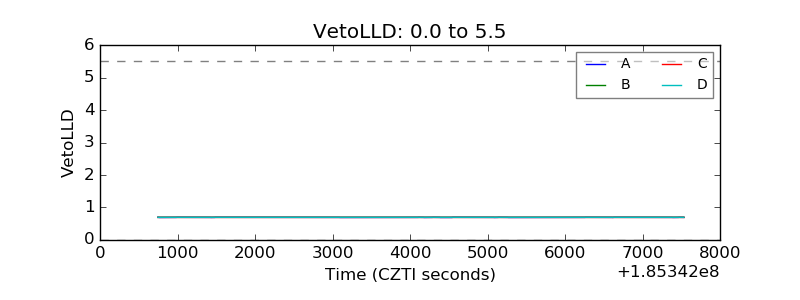 |
| Alpha Counter | 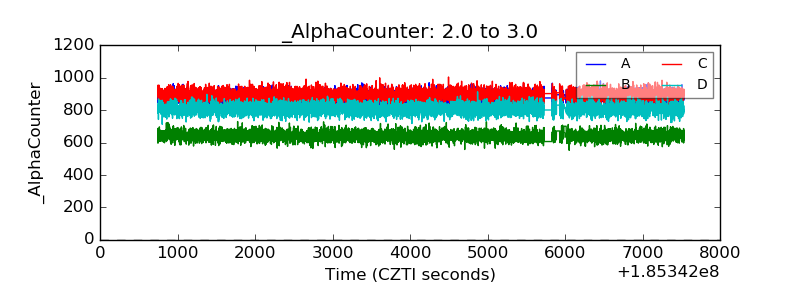 |
| _CPM_Rate | 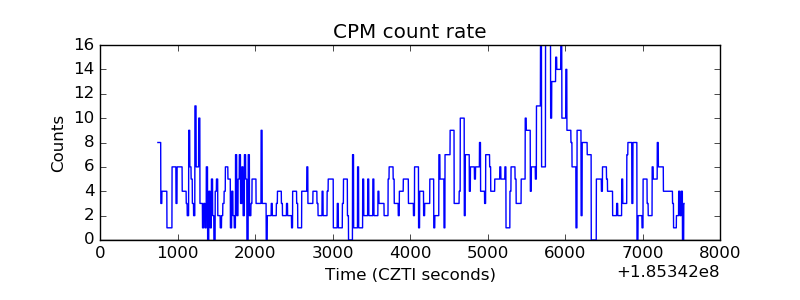 |
| CZT Counter | 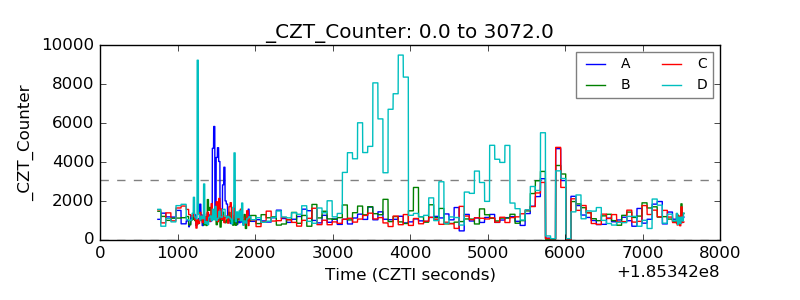 |
| +2.5 Volts monitor |  |
| +5 Volts monitor | 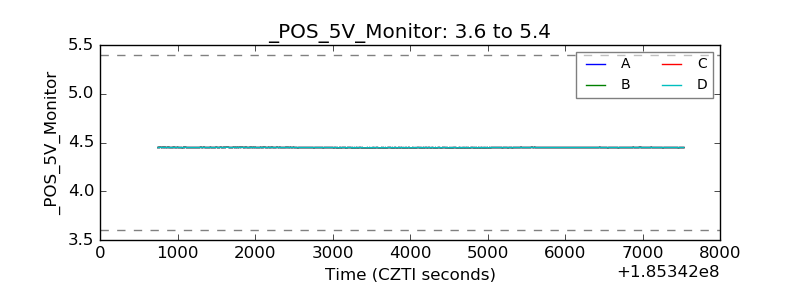 |
| _ROLL_ROT | 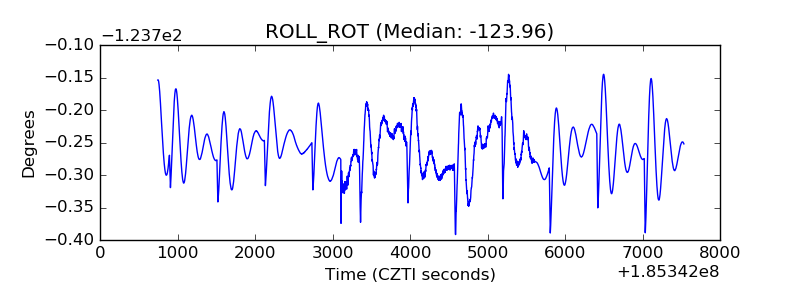 |
| _Roll_DEC | 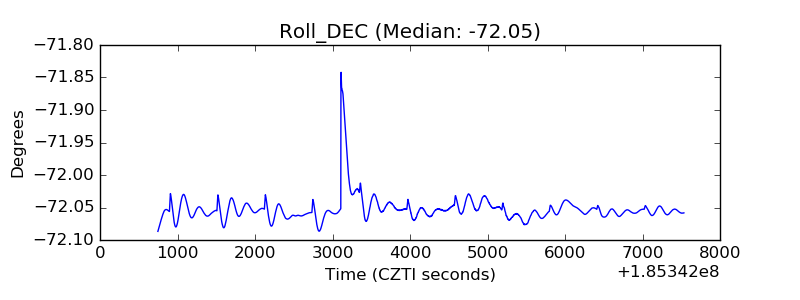 |
| _Roll_RA | 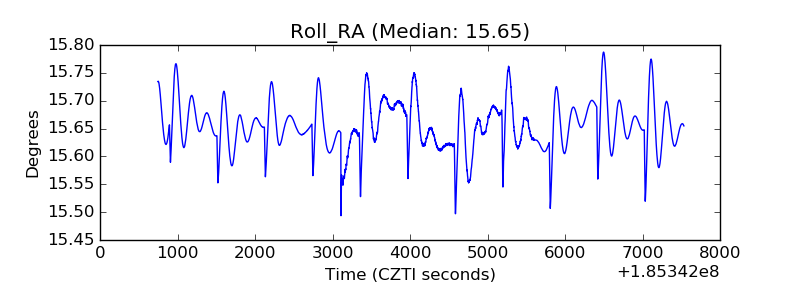 |
| Veto Counter | 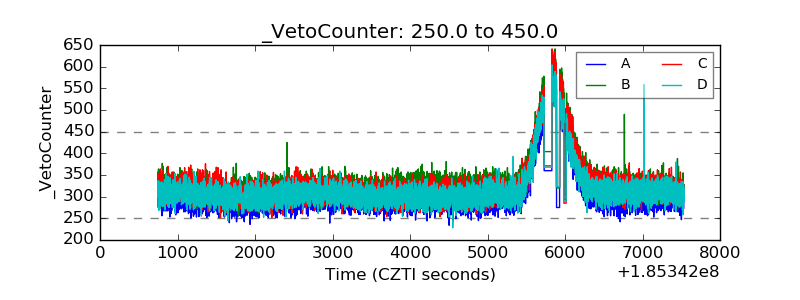 |